America’s Water Crisis: Cities Where Water Demand Far Outpaces Supply
 https://climate-crisis-247-bucket.nyc3.cdn.digitaloceanspaces.com/wp-content/uploads/2025/07/07210933/Annual-Baseline-Water-Stress-for-Watershed-Sub-Basins-150x150.png
Nationwide, a majority of the U.S. population lives in sustainable water basins. Water supply outweighs demand in most counties, and on a national level the U.S. ranks 71st out of 181 countries in baseline water stress.
Hot property? From Maui to Malibu, These Affluent Enclaves Are Becoming Wildfire Hotspots
Whence the next pandemic? Cities Where the Next Pandemic Is Most Likely to Break Out
In some municipalities, however, the net consumption of water is far greater than renewable freshwater available at the sub-basin level, putting serious strain on water systems. In several cities – like Chandler, Arizona, and Lubbock, Texas – year-round water consumption outweighs renewable water supply by sevenfold. In these water scarce cities, residential and industrial consumers depend on non-renewable and imported water sources, relying on river diversions from hundreds of miles away or groundwater pumps that can draw down aquifers and result in overdrafting. A closer look at the data reveals the cities where water demand outpaces supply the most.
To determine America’s thirstiest cities, Climate Crisis 247 reviewed data on water demand and supply from the World Resources Institute. Cities are ranked based on average baseline water stress – the ratio of net water consumption to available renewable freshwater available to a sub-basin, which includes surface flow, interflow, and groundwater recharge. Data was aggregated from the sub-basin level to cities using QGIS. Supplemental data on drought conditions are from the U.S. Drought Monitor. Only cities with at least 100,000 residents were considered, with only the highest-ranking city in each county included.
25. Boise City, ID
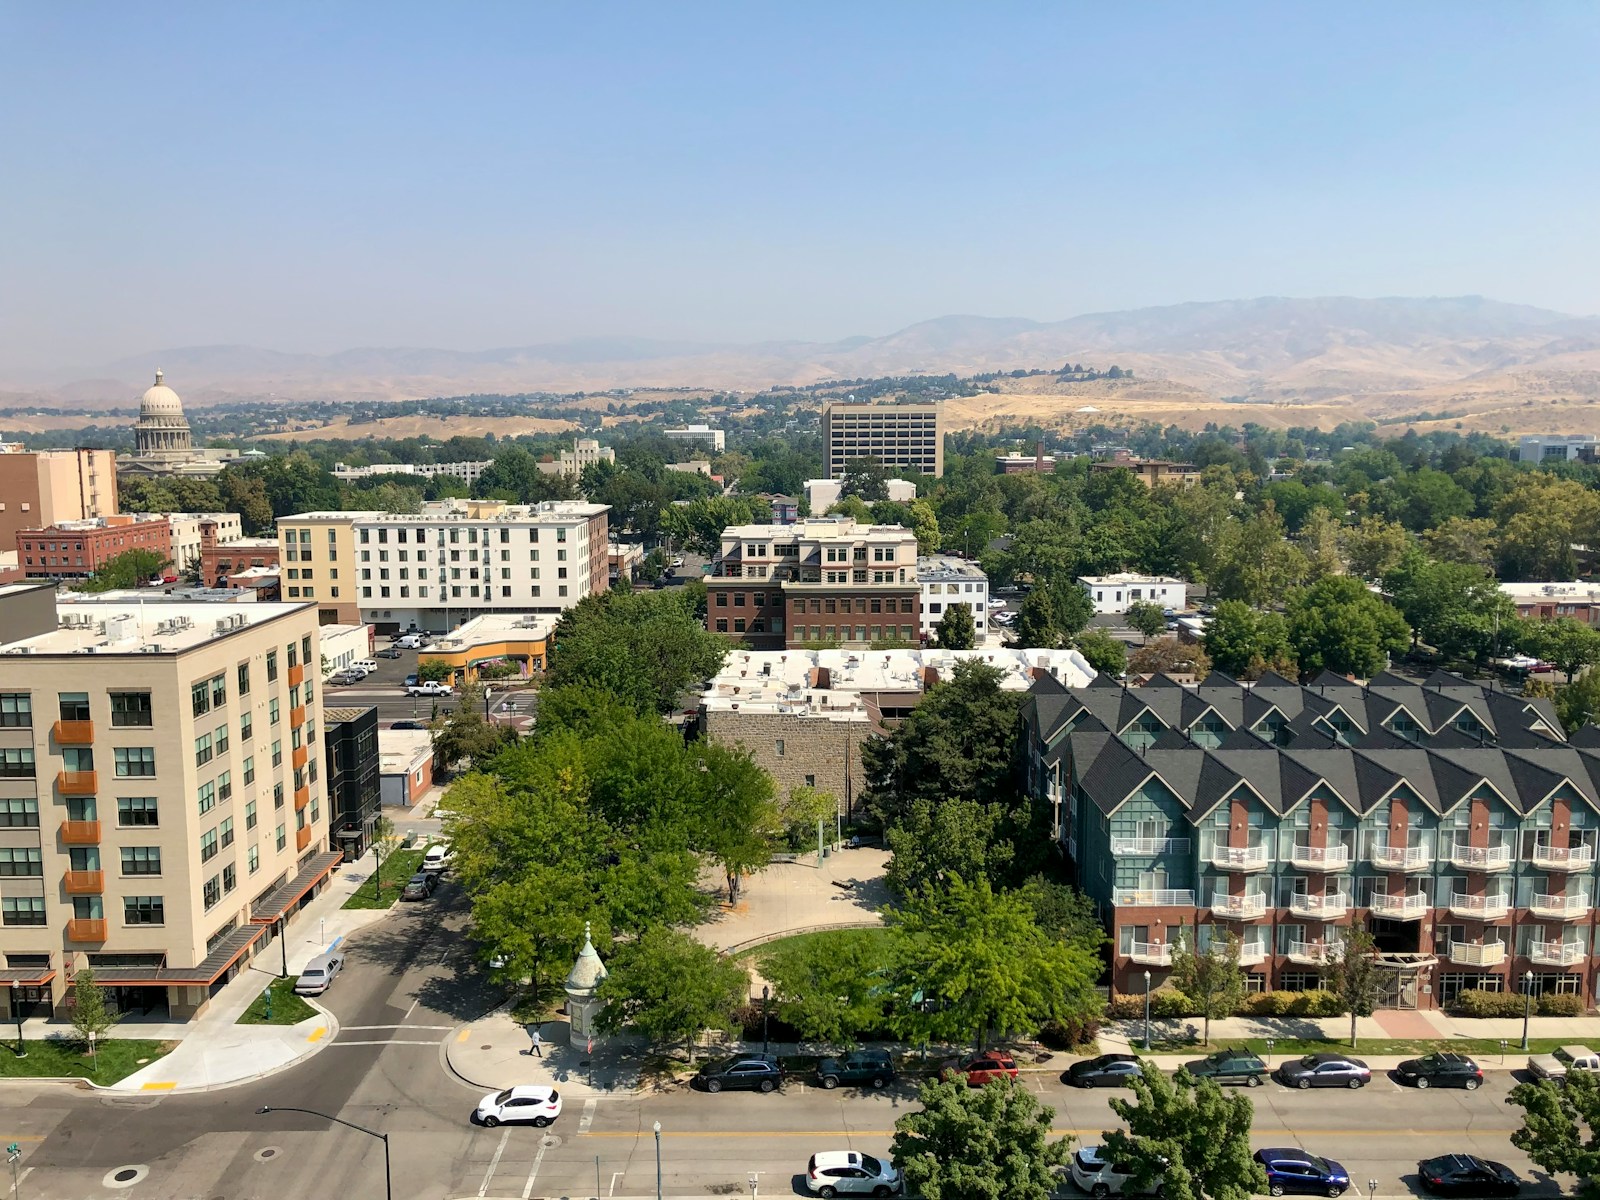
- Annual water withdrawals: 162.7% of renewable supply
- Land area that is abnormally dry: 100.0%
- Value of all homes: $28.4 billion
- Total population: 234,192
24. Concord, NC
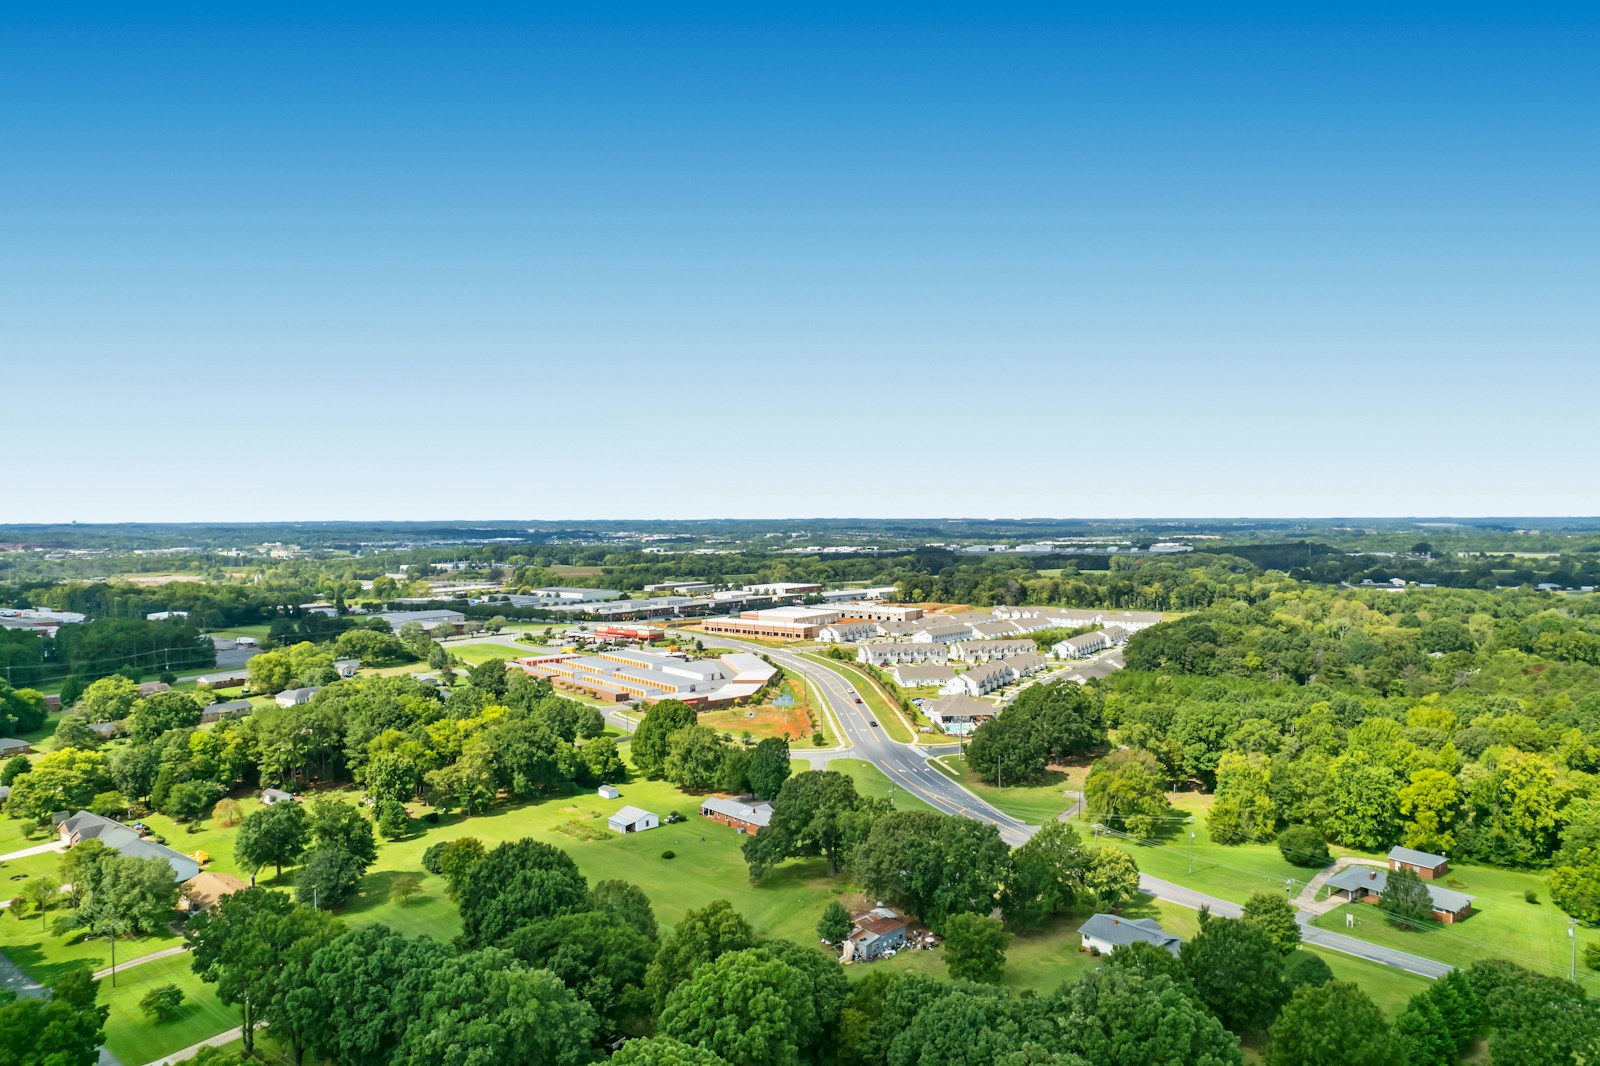
- Annual water withdrawals: 172.1% of renewable supply
- Land area that is abnormally dry: 64.2%
- Value of all homes: $7.8 billion
- Total population: 105,335
23. Amarillo, TX
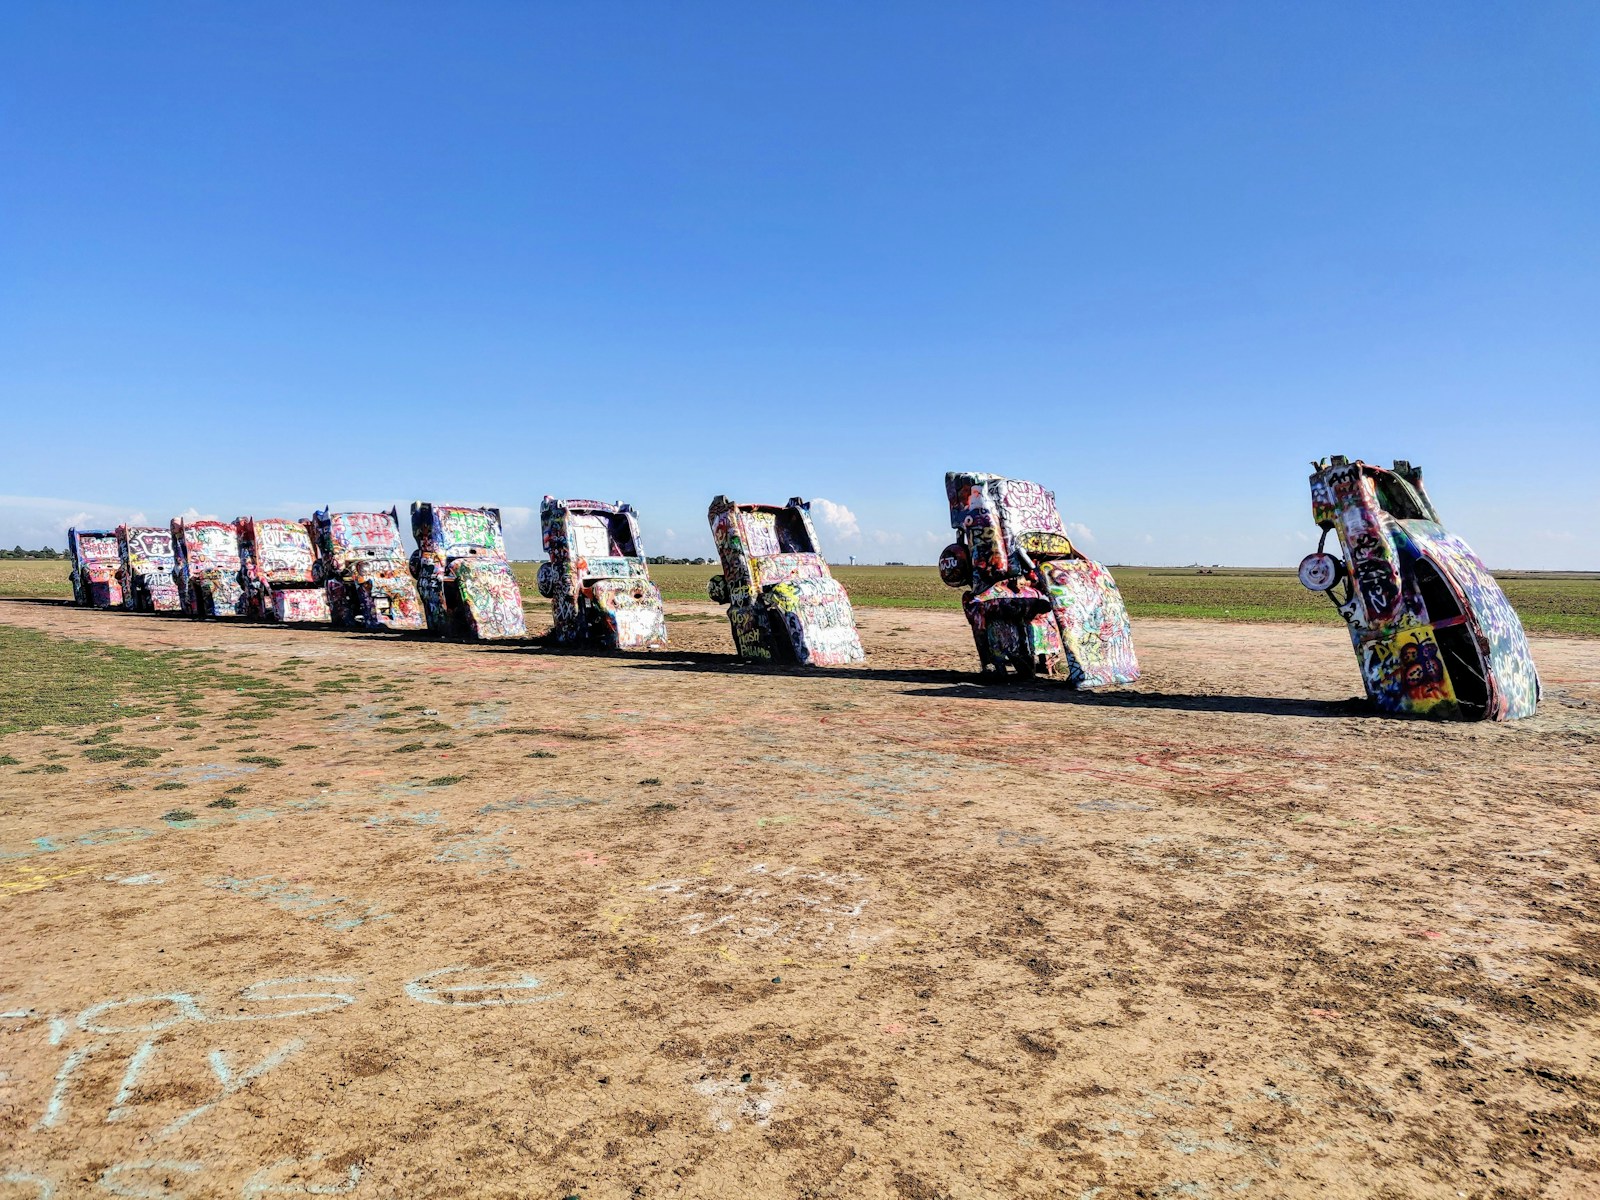
- Annual water withdrawals: 212.1% of renewable supply
- Land area that is abnormally dry: 0.0%
- Value of all homes: $9.8 billion
- Total population: 200,360
22. Highlands Ranch, CO
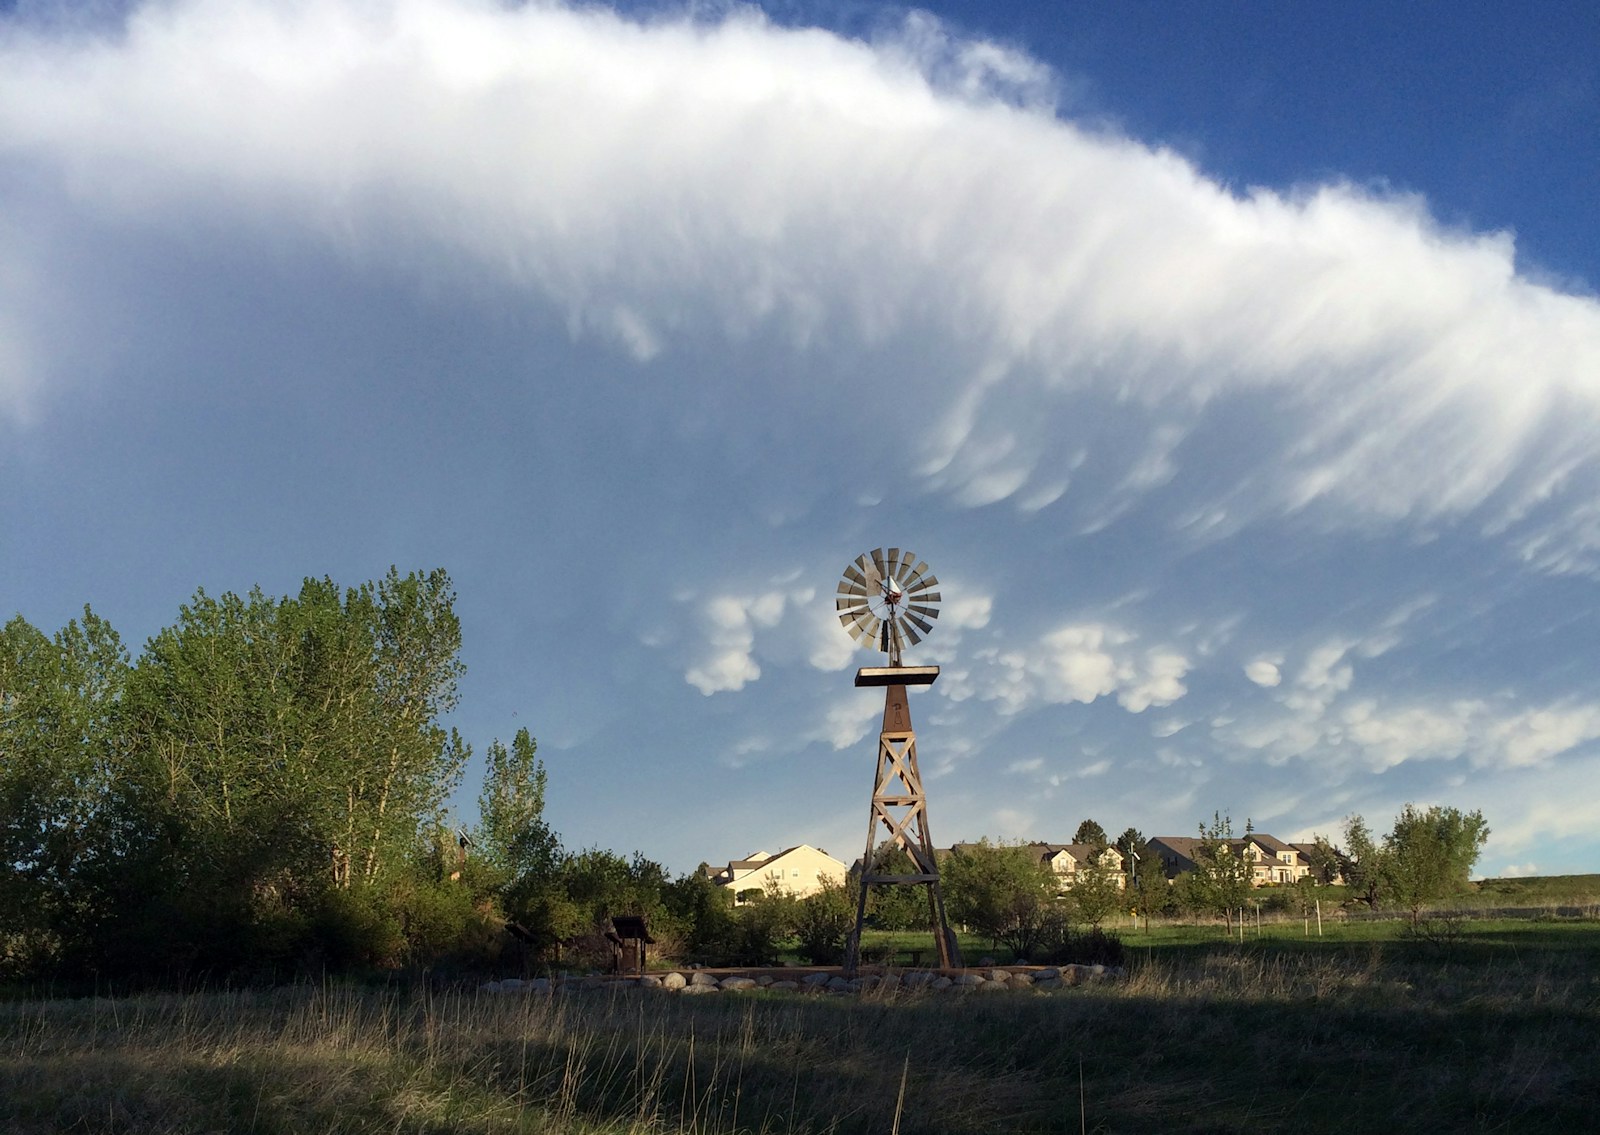
- Annual water withdrawals: 224.3% of renewable supply
- Land area that is abnormally dry: 100.0%
- Value of all homes: $20.1 billion
- Total population: 101,514
21. Boulder, CO
- Annual water withdrawals: 224.3% of renewable supply
- Land area that is abnormally dry: 0.0%
- Value of all homes: $23.4 billion
- Total population: 106,598
20. Greeley, CO
- Annual water withdrawals: 224.3% of renewable supply
- Land area that is abnormally dry: 0.8%
- Value of all homes: $8.3 billion
- Total population: 107,949
19. Thornton, CO
- Annual water withdrawals: 224.3% of renewable supply
- Land area that is abnormally dry: 0.0%
- Value of all homes: $16.6 billion
- Total population: 141,799
18. Lakewood, CO
- Annual water withdrawals: 224.3% of renewable supply
- Land area that is abnormally dry: 99.3%
- Value of all homes: $21.0 billion
- Total population: 156,149
17. Fort Collins, CO
- Annual water withdrawals: 224.3% of renewable supply
- Land area that is abnormally dry: 100.0%
- Value of all homes: $19.6 billion
- Total population: 168,758
16. Aurora, CO
- Annual water withdrawals: 224.3% of renewable supply
- Land area that is abnormally dry: 28.4%
- Value of all homes: $39.8 billion
- Total population: 387,349
15. Denver, CO
- Annual water withdrawals: 224.3% of renewable supply
- Land area that is abnormally dry: 35.3%
- Value of all homes: $104.5 billion
- Total population: 710,800
14. Clovis, CA
- Annual water withdrawals: 280.5% of renewable supply
- Land area that is abnormally dry: 100.0%
- Value of all homes: $12.2 billion
- Total population: 120,607
13. Brownsville, TX
- Annual water withdrawals: 299.1% of renewable supply
- Land area that is abnormally dry: 0.0%
- Value of all homes: $4.7 billion
- Total population: 186,999
12. San Diego, CA
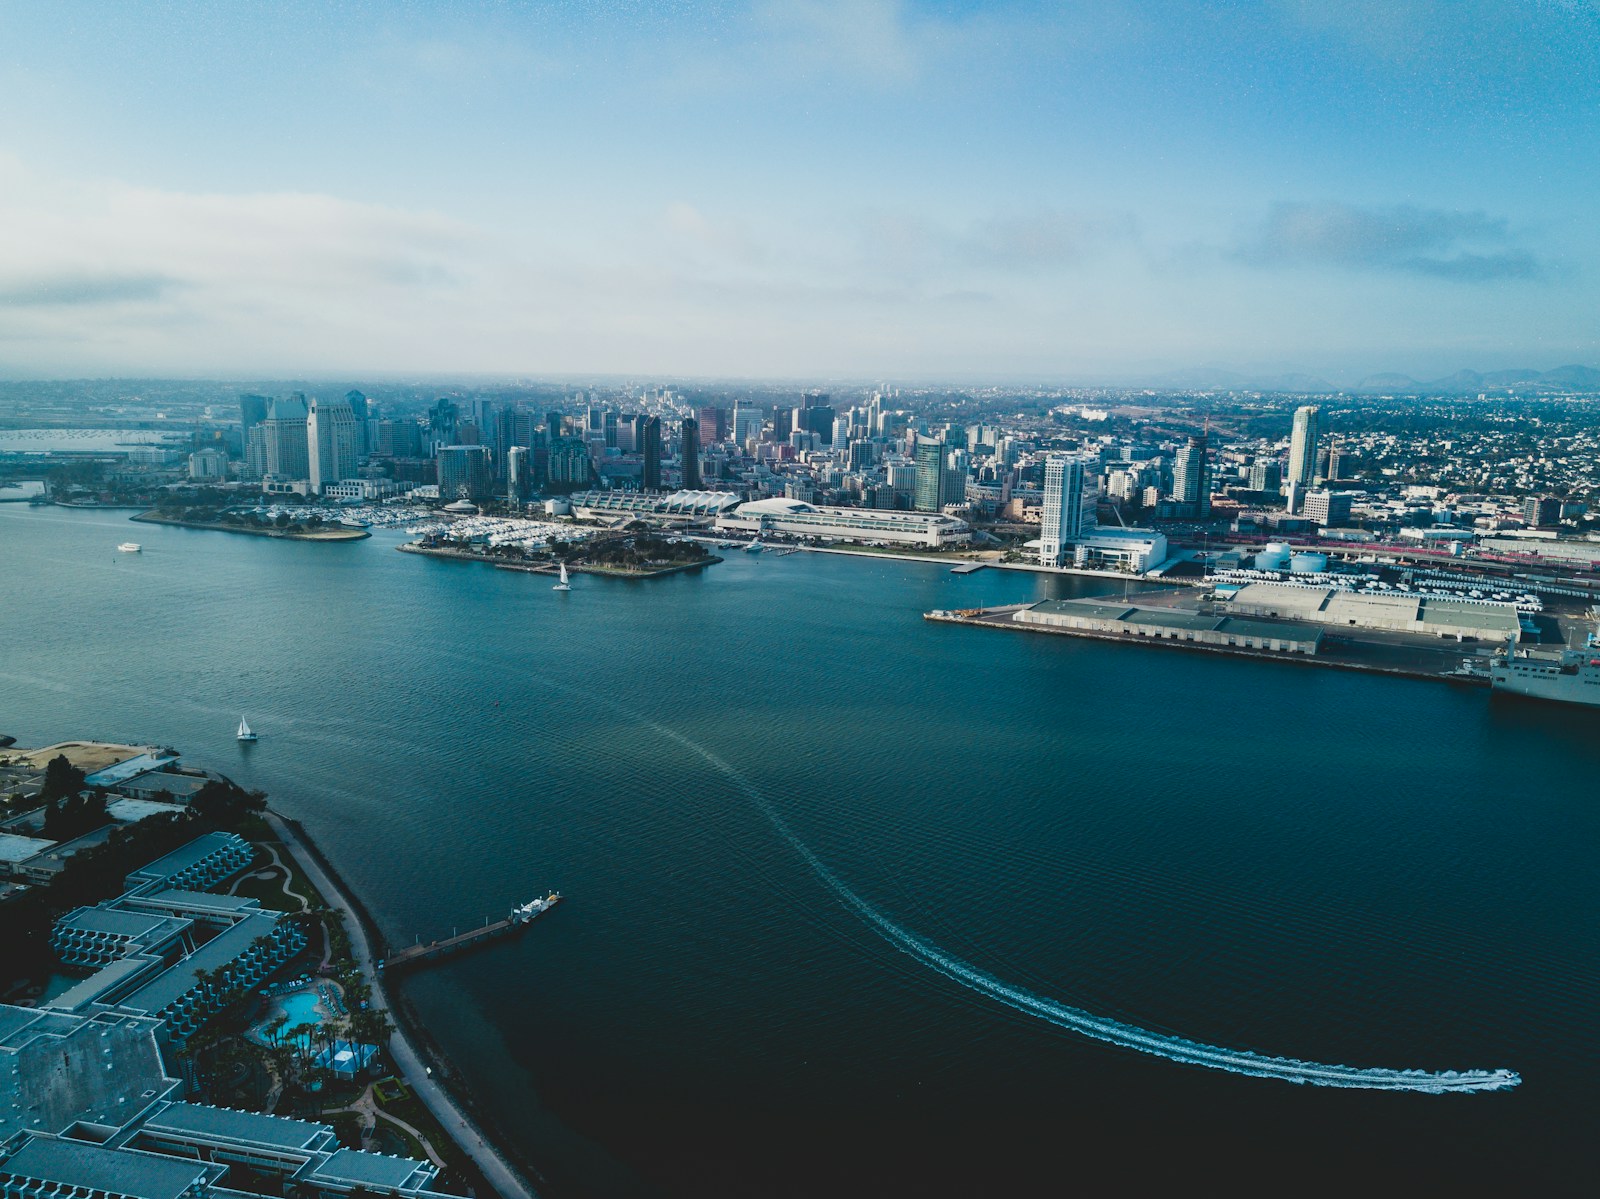
- Annual water withdrawals: 339.5% of renewable supply
- Land area that is abnormally dry: 88.8%
- Value of all homes: $236.0 billion
- Total population: 1.4 million
11. Oxnard, CA
- Annual water withdrawals: 349.8% of renewable supply
- Land area that is abnormally dry: 68.9%
- Value of all homes: $16.8 billion
- Total population: 202,279
10. Bakersfield, CA
- Annual water withdrawals: 364.1% of renewable supply
- Land area that is abnormally dry: 100.0%
- Value of all homes: $26.3 billion
- Total population: 404,321
9. Pomona, CA
- Annual water withdrawals: 440.8% of renewable supply
- Land area that is abnormally dry: 100.0%
- Value of all homes: $11.6 billion
- Total population: 149,831
8. Edinburg, TX
- Annual water withdrawals: 458.0% of renewable supply
- Land area that is abnormally dry: 0.0%
- Value of all homes: $3.2 billion
- Total population: 100,964
7. Visalia, CA
- Annual water withdrawals: 497.9% of renewable supply
- Land area that is abnormally dry: 100.0%
- Value of all homes: $9.3 billion
- Total population: 141,466
6. San Bernardino, CA
- Annual water withdrawals: 530.7% of renewable supply
- Land area that is abnormally dry: 100.0%
- Value of all homes: $11.2 billion
- Total population: 221,041
5. Santa Ana, CA
- Annual water withdrawals: 530.7% of renewable supply
- Land area that is abnormally dry: 100.0%
- Value of all homes: $22.5 billion
- Total population: 311,379
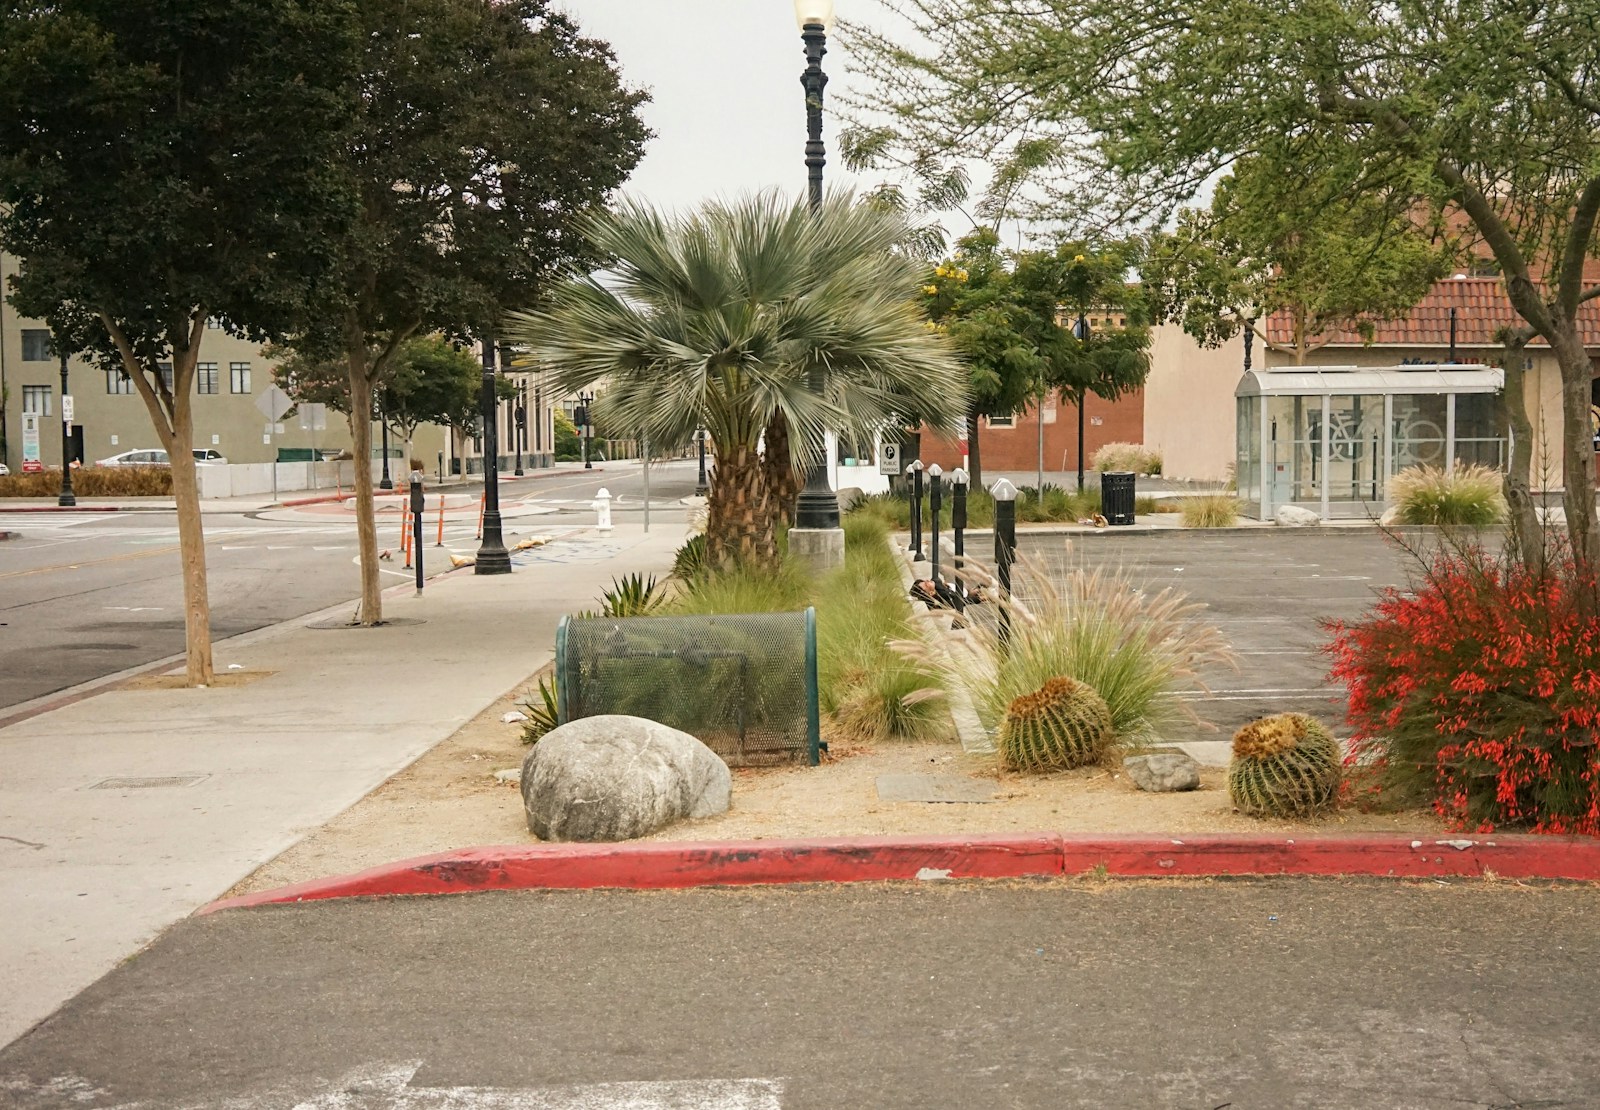
4. Riverside, CA
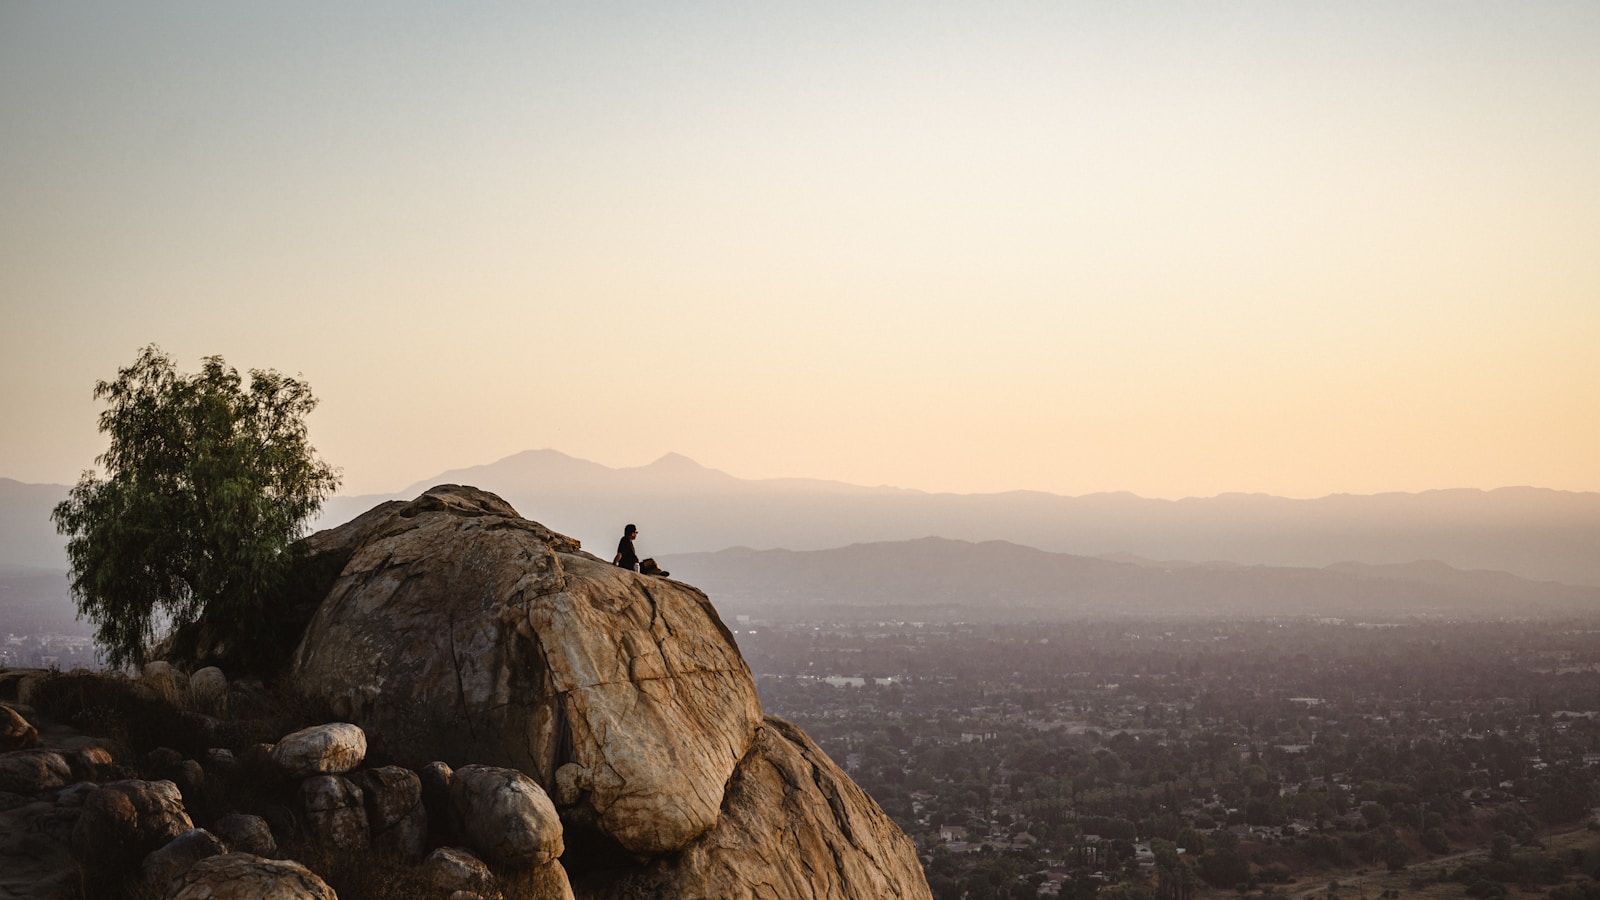
- Annual water withdrawals: 530.7% of renewable supply
- Land area that is abnormally dry: 100.0%
- Value of all homes: $26.9 billion
- Total population: 316,076
3. Lubbock, TX
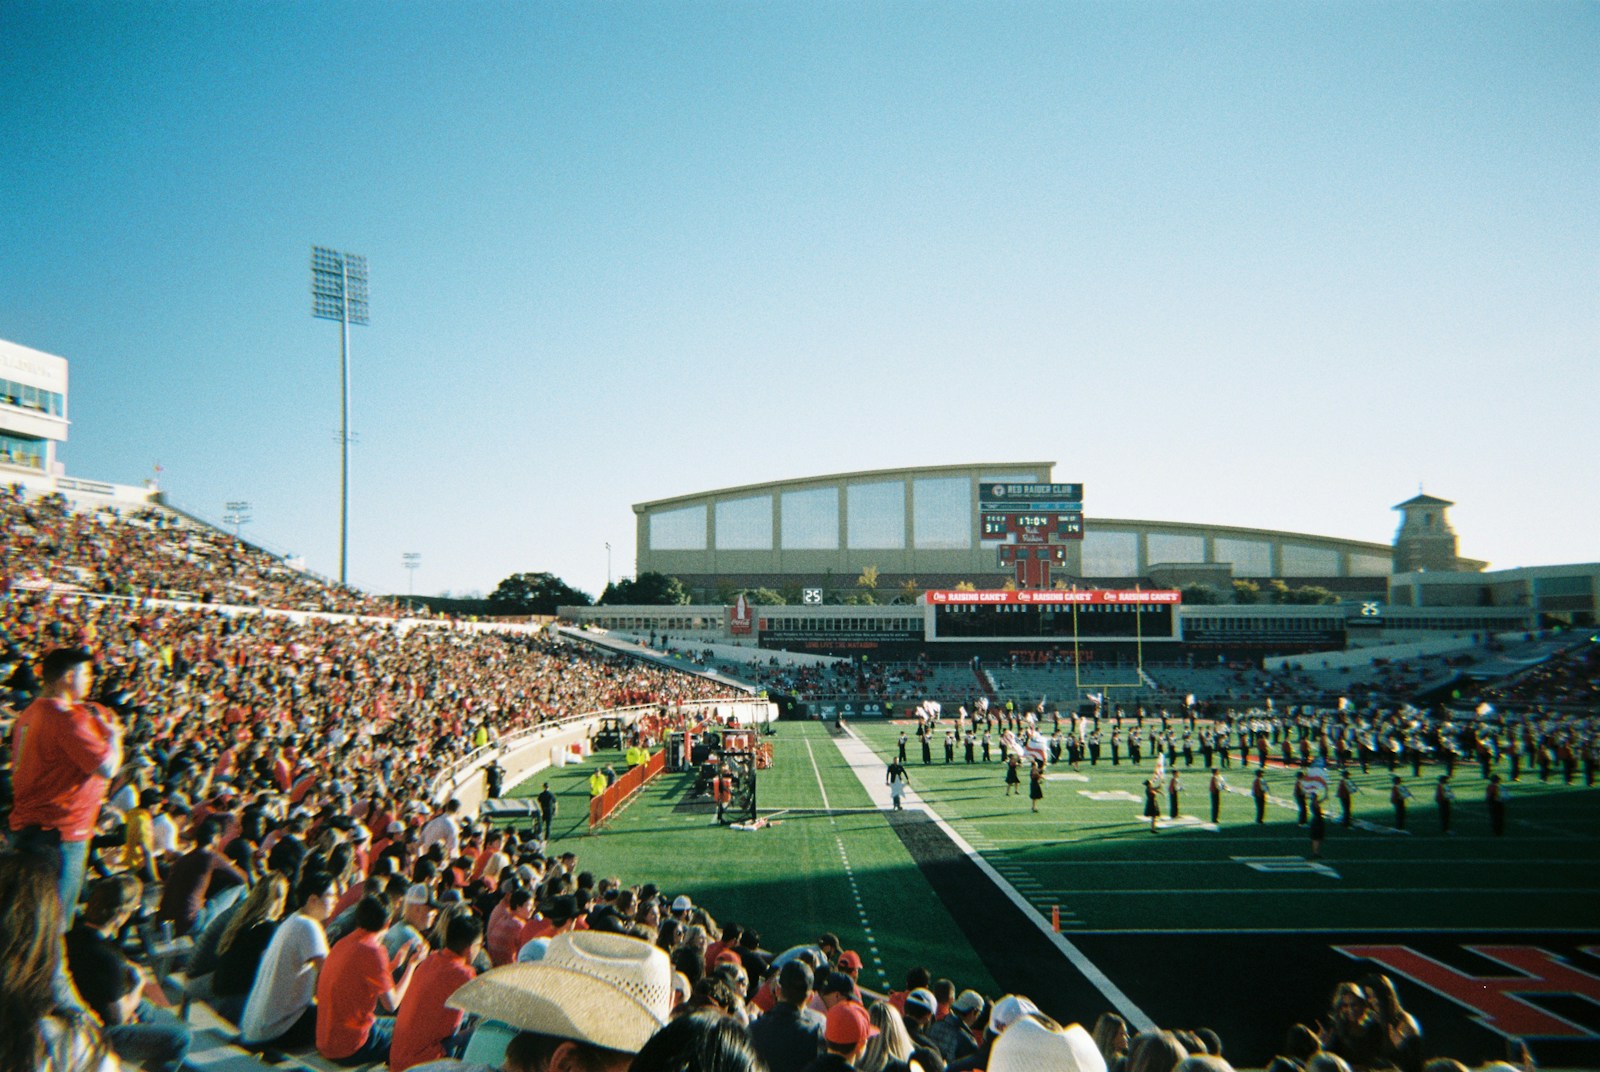
- Annual water withdrawals: 671.1% of renewable supply
- Land area that is abnormally dry: 0.0%
- Value of all homes: $12.0 billion
- Total population: 258,190
2. San Tan Valley, AZ
- Annual water withdrawals: 684.3% of renewable supply
- Land area that is abnormally dry: 100.0%
- Value of all homes: $9.4 billion
- Total population: 101,207
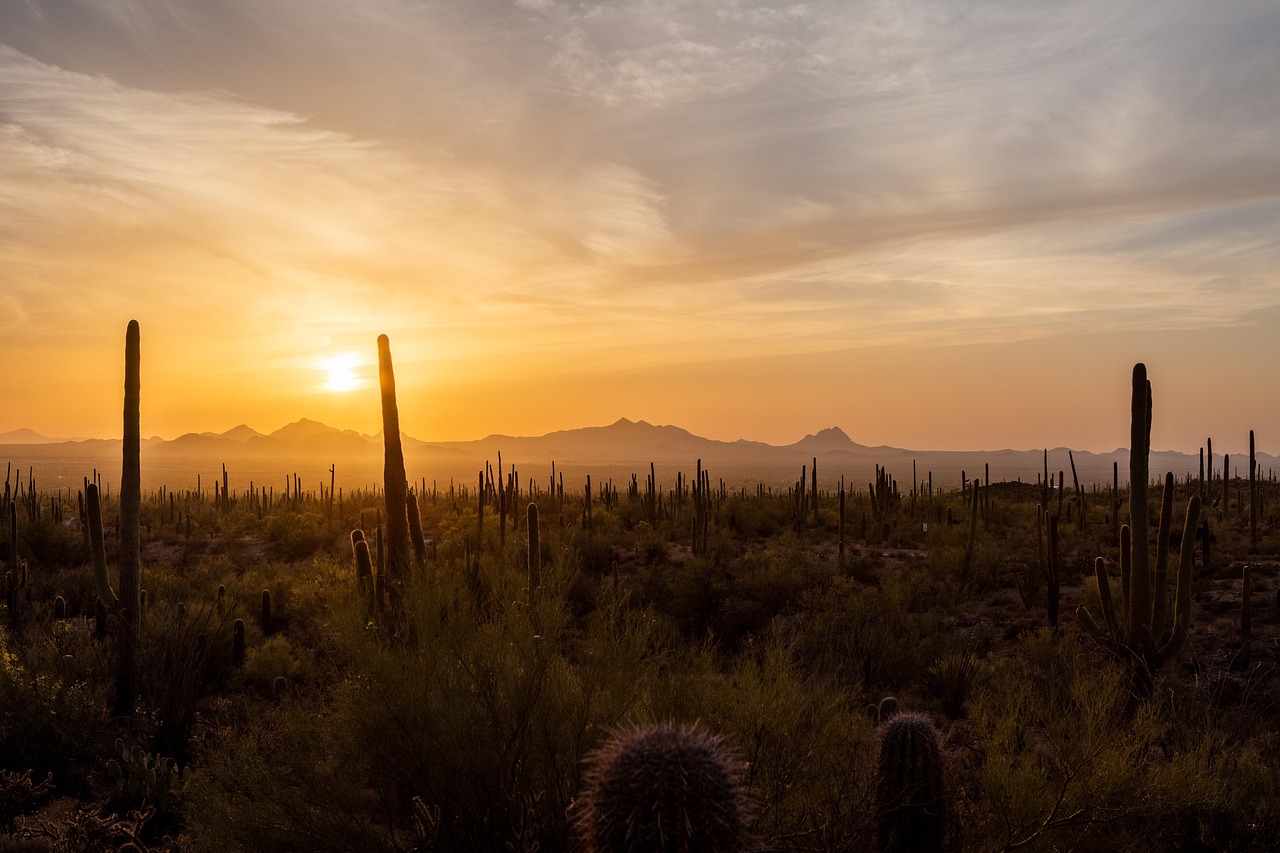
1. Chandler, AZ
- Annual water withdrawals: 684.3% of renewable supply
- Land area that is abnormally dry: 100.0%
- Value of all homes: $31.8 billion
- Total population: 275,618