U.S. Cities Where Fall Temperatures Have Surged in the Last 55 Years
 https://climatecrisis247.com/wp-content/uploads/2025/09/vp7fryvgdg-150x150.jpg
The first day of fall is weeks away, but meteorological fall – which is based on atmospheric temperatures rather than Earth’s position relative to the sun – began on September 1, 2025 and will last through November. For decades, fall has been getting warmer across the United States, and this year will likely be no different.
A recent study published by Climate Central – an independent, non-profit, research organization – analyzed data for a representative sample of 237 American cities. According to the report, fall temperatures across these cities climbed by an average of 2.8°F between 1970 and 2024. Higher fall temperatures in the last 55 years are indicative of a broader warming trend impacting all four seasons, as the volume of heat-trapping pollution continues to accumulate in Earth’s atmosphere.
While a 2.8°F shift in average fall temperatures over the last half century may seem relatively inconsequential, the seasonal warming pattern has several known ecological implications – disrupting timing of bird migrations, prolonging drought risk, and extending the wildfire season. In dozens of U.S. cities, changes in fall temperatures have been so pronounced that the warming trend is likely self-evident to local residents.
Using data from Climate Central, Climate Crisis 247 identified the U.S. cities where fall temperatures climbed the most in the last half century. We reviewed the average change in annual fall temperatures, calculated using linear regression, for over 200 U.S. cities between 1970 and 2024. Only cities where average temperatures between September and November have climbed by over 4°F since 1970 were included on this list. Cities covered by Climate Central for which historical average fall temperatures in 1970 and 2024 were not available from NOAA were excluded. Supplemental temperature data is from the National Oceanic and Atmospheric Administration, and population data are five-year estimates from the U.S. Census Bureau’s 2023 American Community Survey. Cities are listed in ascending order, based on their average change in annual fall temperatures since 1970. It is important to note that, due to rounding, the annual temperature anomalies reported in this story may not reflect the precise difference from the noted baseline averages.
The cities on this list span 21 states and are collectively home to over 11 million Americans.
29. Houston, Texas

- Change in annual avg. fall temperatures, 1970-2024: +4.1°F
- Baseline avg. fall temperature, 1991-2020: 73.1°F
- Average fall temperature in 2024: 77.0°F (3.9°F warmer than baseline avg.)
- Average fall temperature in 1970: 69.8°F (3.3°F cooler than baseline avg.)
- Local population: 2,300,419
28. Green Bay, Wisconsin

- Change in annual avg. fall temperatures, 1970-2024: +4.1°F
- Baseline avg. fall temperature, 1991-2020: 48.4°F
- Average fall temperature in 2024: 54.0°F (5.6°F warmer than baseline avg.)
- Average fall temperature in 1970: 47.7°F (0.7°F cooler than baseline avg.)
- Local population: 106,585
27. Fort Smith, Arkansas

- Change in annual avg. fall temperatures, 1970-2024: +4.2°F
- Baseline avg. fall temperature, 1991-2020: 63.6°F
- Average fall temperature in 2024: 67.9°F (4.3°F warmer than baseline avg.)
- Average fall temperature in 1970: 62.5°F (1.2°F cooler than baseline avg.)
- Local population: 89,496
26. Bismarck, North Dakota

- Change in annual avg. fall temperatures, 1970-2024: +4.2°F
- Baseline avg. fall temperature, 1991-2020: 45.0°F
- Average fall temperature in 2024: 49.6°F (4.7°F warmer than baseline avg.)
- Average fall temperature in 1970: 43.4°F (1.5°F cooler than baseline avg.)
- Local population: 74,146
25. Concord, New Hampshire

- Change in annual avg. fall temperatures, 1970-2024: +4.2°F
- Baseline avg. fall temperature, 1991-2020: 49.7°F
- Average fall temperature in 2024: 51.4°F (1.7°F warmer than baseline avg.)
- Average fall temperature in 1970: 51.2°F (1.5°F warmer than baseline avg.)
- Local population: 44,219
24. Chattanooga, Tennessee

- Change in annual avg. fall temperatures, 1970-2024: +4.2°F
- Baseline avg. fall temperature, 1991-2020: 63.1°F
- Average fall temperature in 2024: 66.6°F (3.5°F warmer than baseline avg.)
- Average fall temperature in 1970: 63.7°F (0.7°F warmer than baseline avg.)
- Local population: 182,832
23. Amarillo, Texas

- Change in annual avg. fall temperatures, 1970-2024: +4.2°F
- Baseline avg. fall temperature, 1991-2020: 58.9°F
- Average fall temperature in 2024: 63.7°F (4.9°F warmer than baseline avg.)
- Average fall temperature in 1970: 55.9°F (3.0°F cooler than baseline avg.)
- Local population: 200,945
22. Salt Lake City, Utah
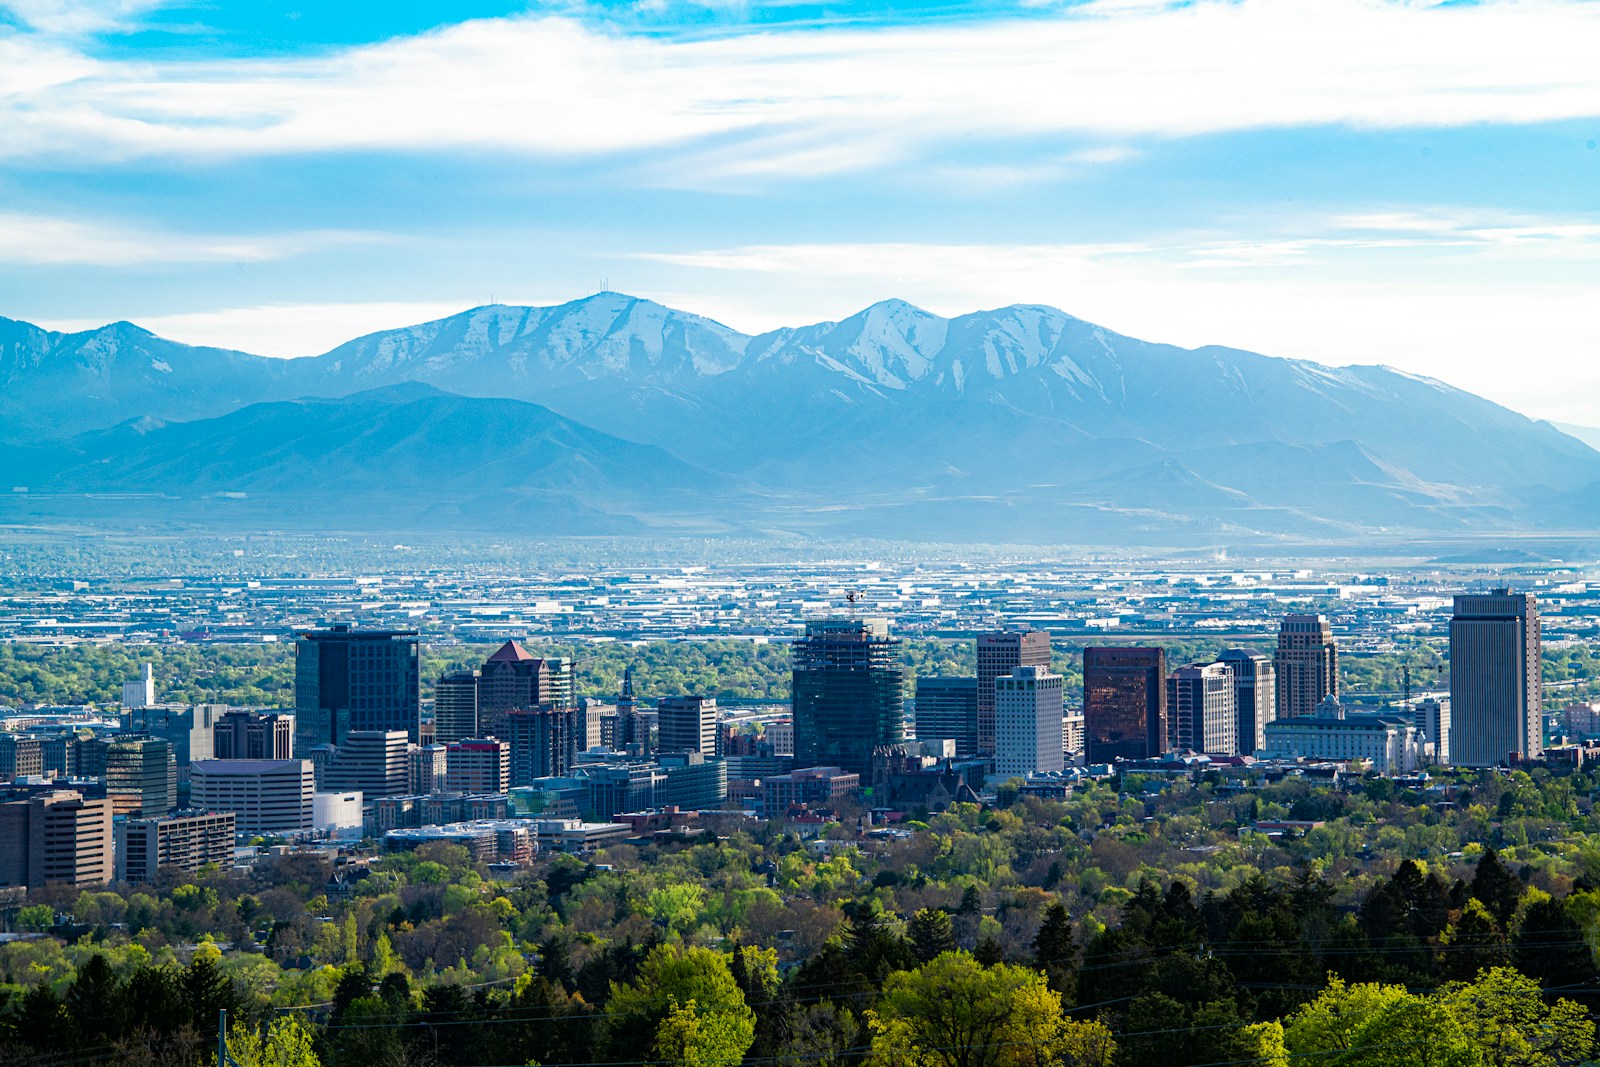
- Change in annual avg. fall temperatures, 1970-2024: +4.2°F
- Baseline avg. fall temperature, 1991-2020: 55.9°F
- Average fall temperature in 2024: 58.8°F (2.9°F warmer than baseline avg.)
- Average fall temperature in 1970: 50.3°F (5.5°F cooler than baseline avg.)
- Local population: 203,888
21. La Crosse, Wisconsin

- Change in annual avg. fall temperatures, 1970-2024: +4.2°F
- Baseline avg. fall temperature, 1991-2020: 51.3°F
- Average fall temperature in 2024: 55.1°F (3.8°F warmer than baseline avg.)
- Average fall temperature in 1970: 51.2°F (0.1°F cooler than baseline avg.)
- Local population: 51,791
20. North Platte, Nebraska
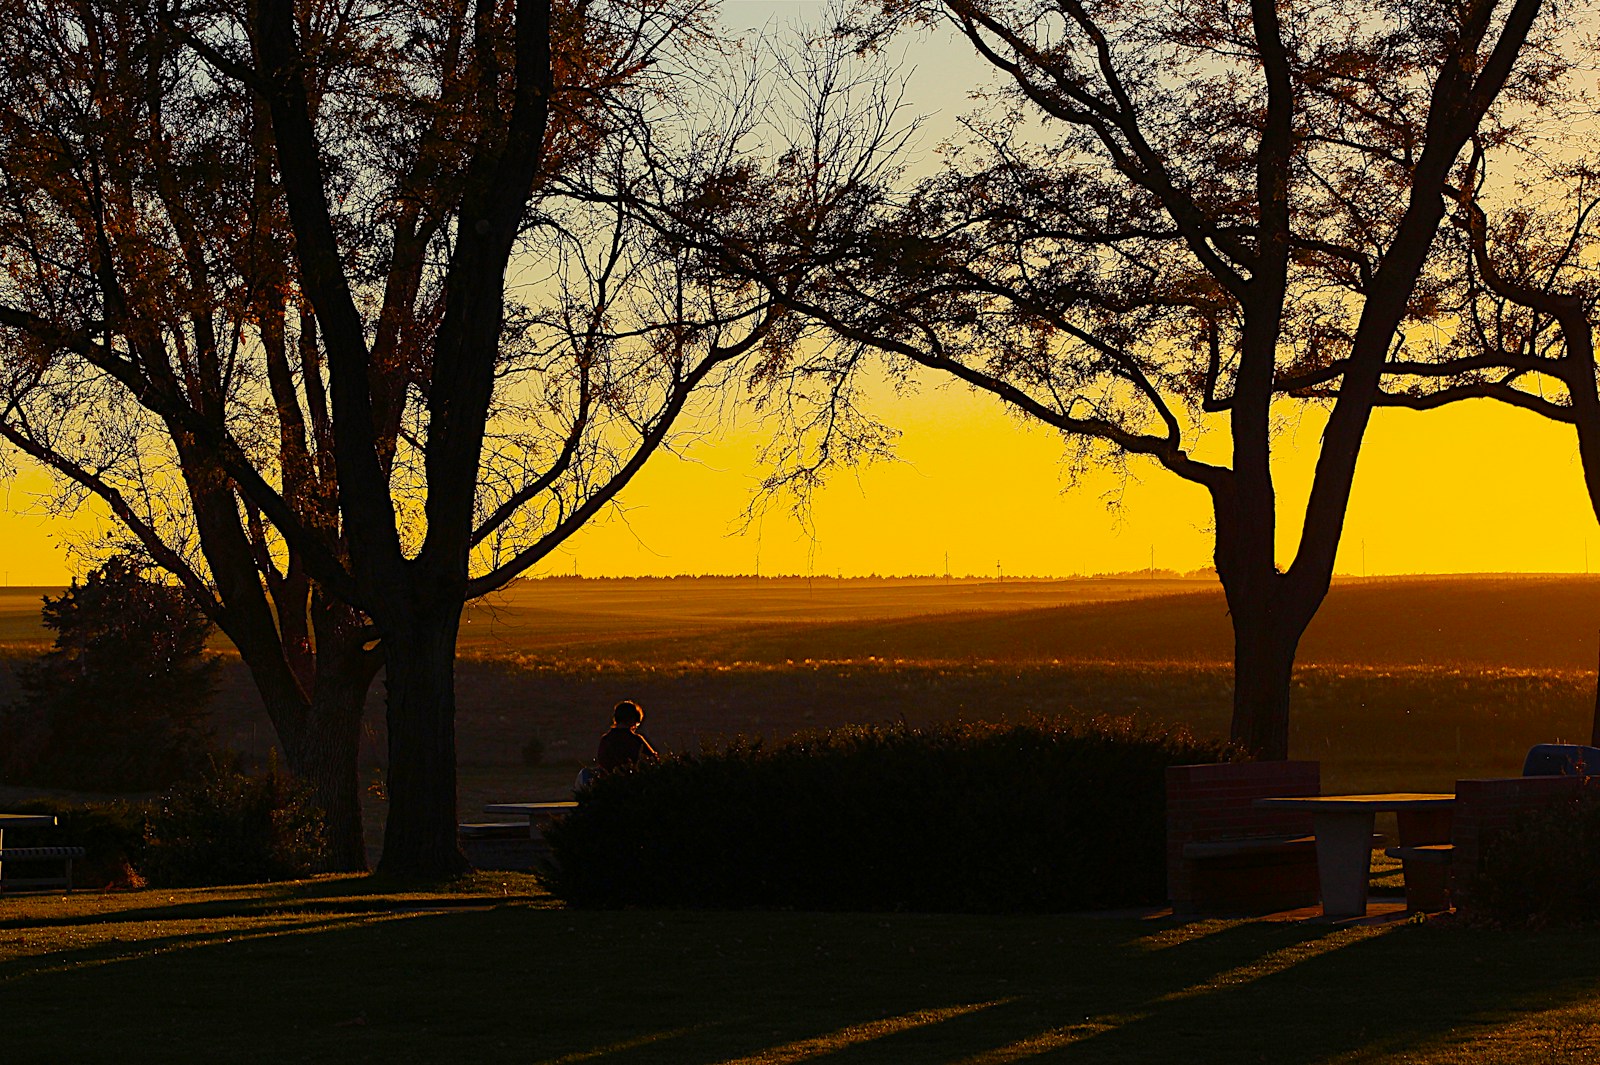
- Change in annual avg. fall temperatures, 1970-2024: +4.3°F
- Baseline avg. fall temperature, 1991-2020: 50.2°F
- Average fall temperature in 2024: 54.7°F (4.4°F warmer than baseline avg.)
- Average fall temperature in 1970: 49.0°F (1.2°F cooler than baseline avg.)
- Local population: 23,030
19. Albuquerque, New Mexico
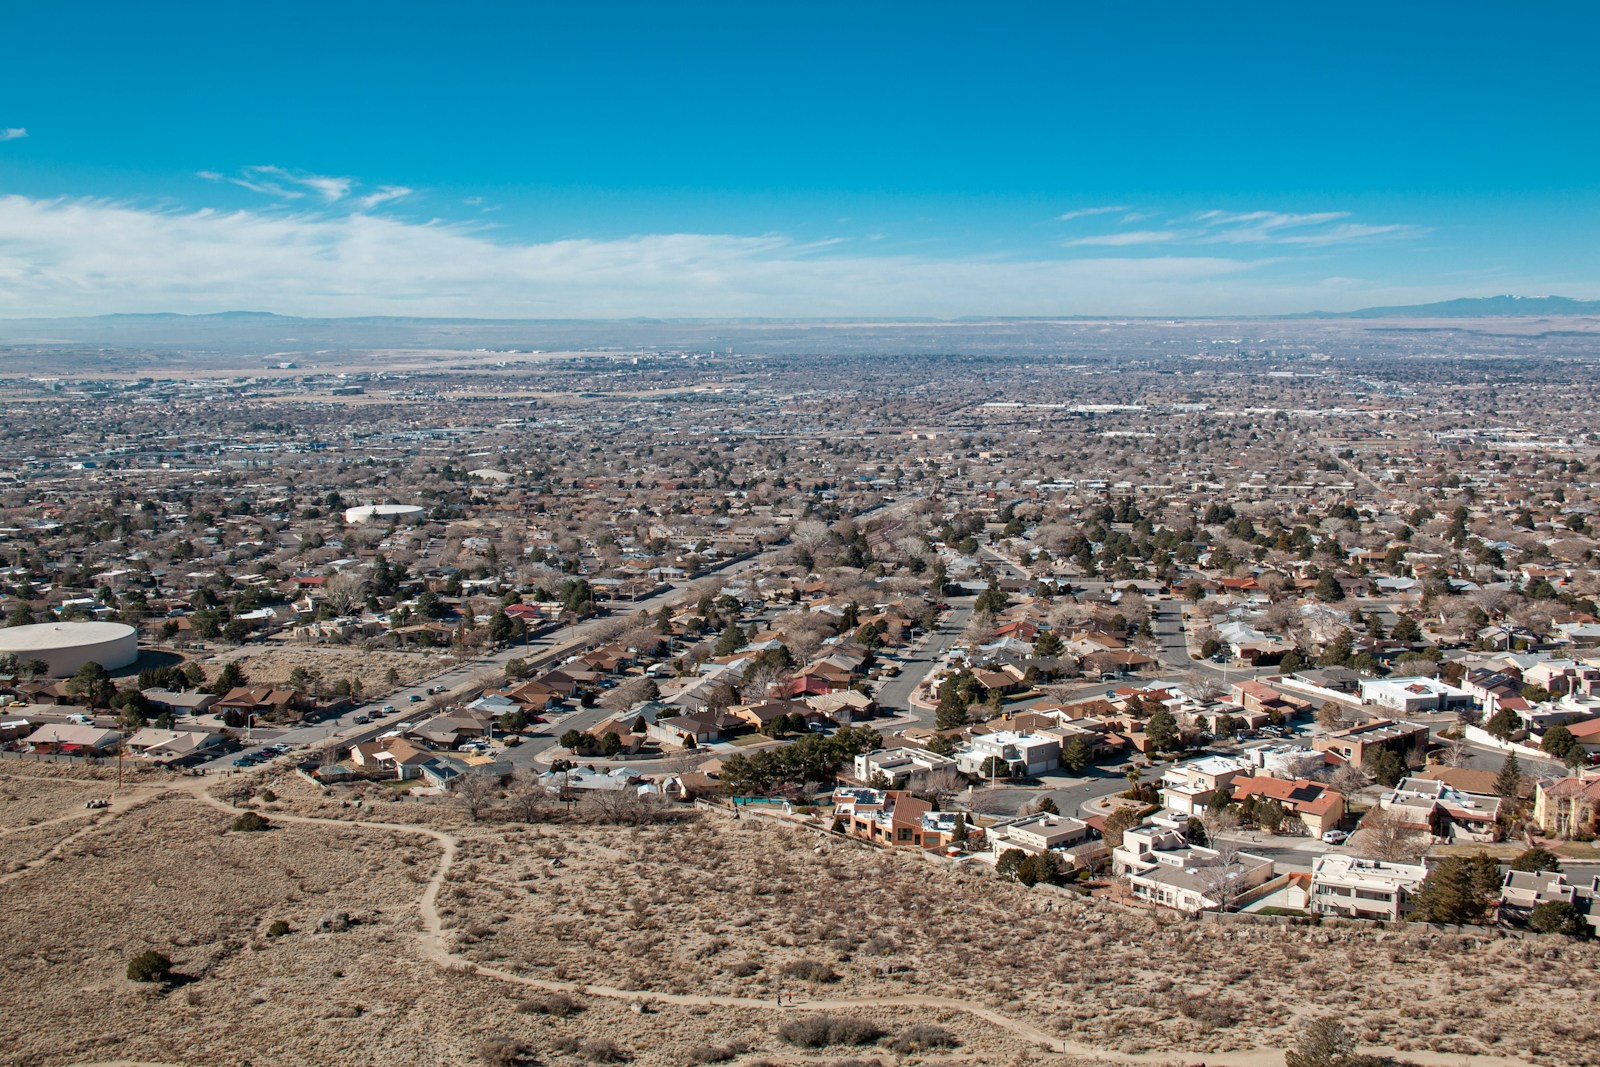
- Change in annual avg. fall temperatures, 1970-2024: +4.3°F
- Baseline avg. fall temperature, 1991-2020: 58.4°F
- Average fall temperature in 2024: 61.5°F (3.1°F warmer than baseline avg.)
- Average fall temperature in 1970: 55.4°F (2.9°F cooler than baseline avg.)
- Local population: 562,488
18. Boise, Idaho

- Change in annual avg. fall temperatures, 1970-2024: +4.4°F
- Baseline avg. fall temperature, 1991-2020: 53.9°F
- Average fall temperature in 2024: 55.7°F (1.7°F warmer than baseline avg.)
- Average fall temperature in 1970: 50.7°F (3.3°F cooler than baseline avg.)
- Local population: 235,701
17. New Orleans, Louisiana

- Change in annual avg. fall temperatures, 1970-2024: +4.4°F
- Baseline avg. fall temperature, 1991-2020: 71.5°F
- Average fall temperature in 2024: 75.2°F (3.7°F warmer than baseline avg.)
- Average fall temperature in 1970: 68.9°F (2.6°F cooler than baseline avg.)
- Local population: 376,035
16. Toledo, Ohio

- Change in annual avg. fall temperatures, 1970-2024: +4.4°F
- Baseline avg. fall temperature, 1991-2020: 54.2°F
- Average fall temperature in 2024: 56.8°F (2.7°F warmer than baseline avg.)
- Average fall temperature in 1970: 54.5°F (0.3°F warmer than baseline avg.)
- Local population: 268,461
15. Sioux Falls, South Dakota

- Change in annual avg. fall temperatures, 1970-2024: +4.4°F
- Baseline avg. fall temperature, 1991-2020: 49.5°F
- Average fall temperature in 2024: 54.1°F (4.6°F warmer than baseline avg.)
- Average fall temperature in 1970: 47.6°F (1.9°F cooler than baseline avg.)
- Local population: 197,642
14. Fargo, North Dakota
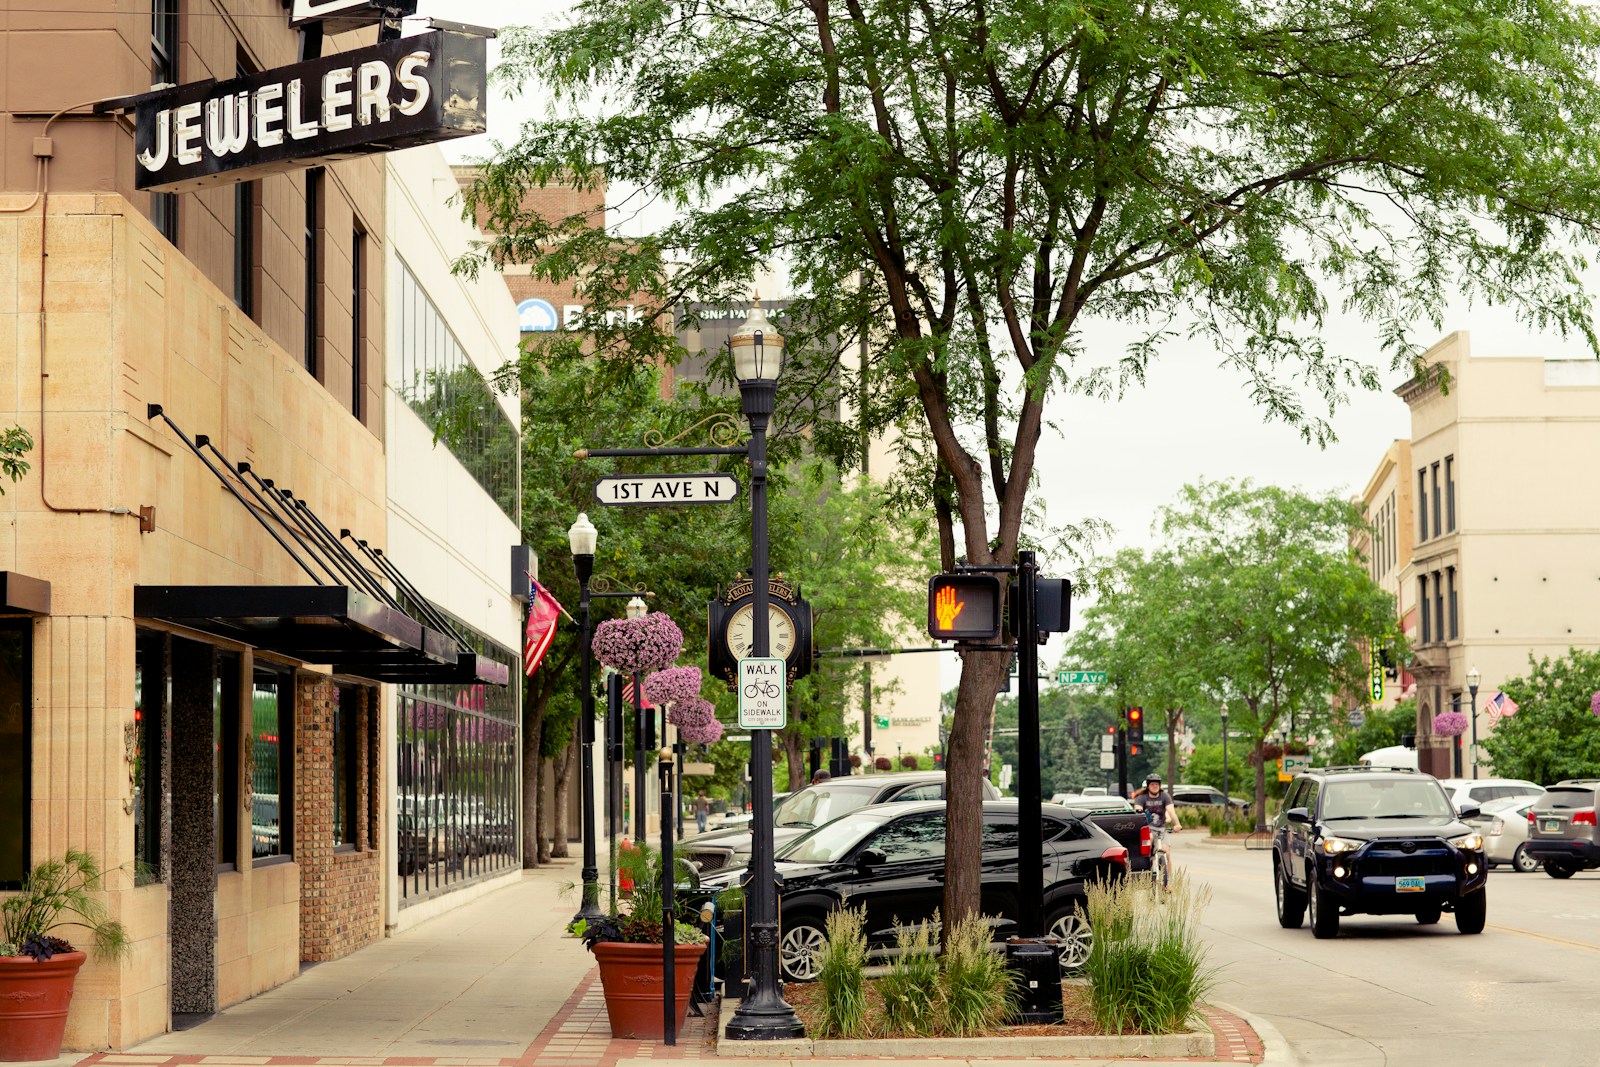
- Change in annual avg. fall temperatures, 1970-2024: +4.6°F
- Baseline avg. fall temperature, 1991-2020: 46.8°F
- Average fall temperature in 2024: 50.9°F (4.1°F warmer than baseline avg.)
- Average fall temperature in 1970: 46.0°F (0.8°F cooler than baseline avg.)
- Local population: 129,064
13. Erie, Pennsylvania

- Change in annual avg. fall temperatures, 1970-2024: +4.6°F
- Baseline avg. fall temperature, 1991-2020: 54.0°F
- Average fall temperature in 2024: 58.0°F (4.0°F warmer than baseline avg.)
- Average fall temperature in 1970: 54.1°F (0.1°F warmer than baseline avg.)
- Local population: 94,156
12. Fresno, California
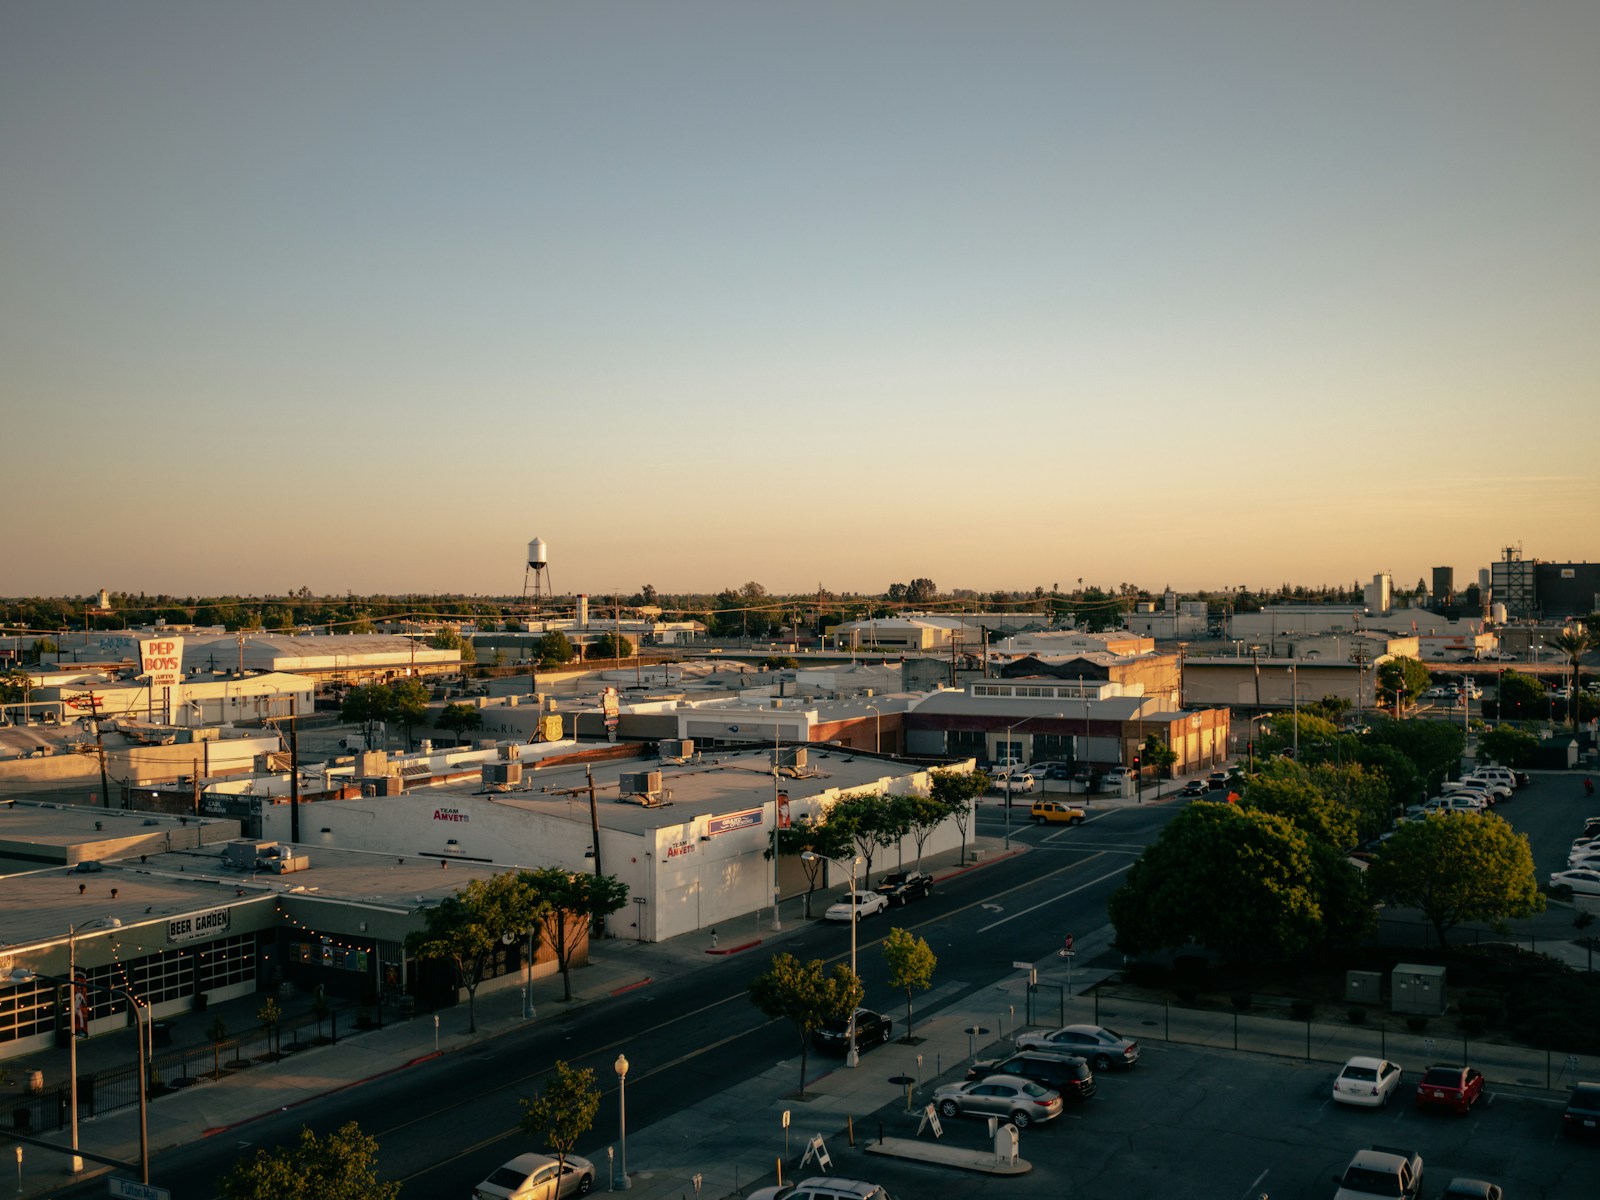
- Change in annual avg. fall temperatures, 1970-2024: +4.7°F
- Baseline avg. fall temperature, 1991-2020: 66.5°F
- Average fall temperature in 2024: 69.1°F (2.6°F warmer than baseline avg.)
- Average fall temperature in 1970: 64.2°F (2.3°F cooler than baseline avg.)
- Local population: 543,615
11. Colorado Springs, Colorado
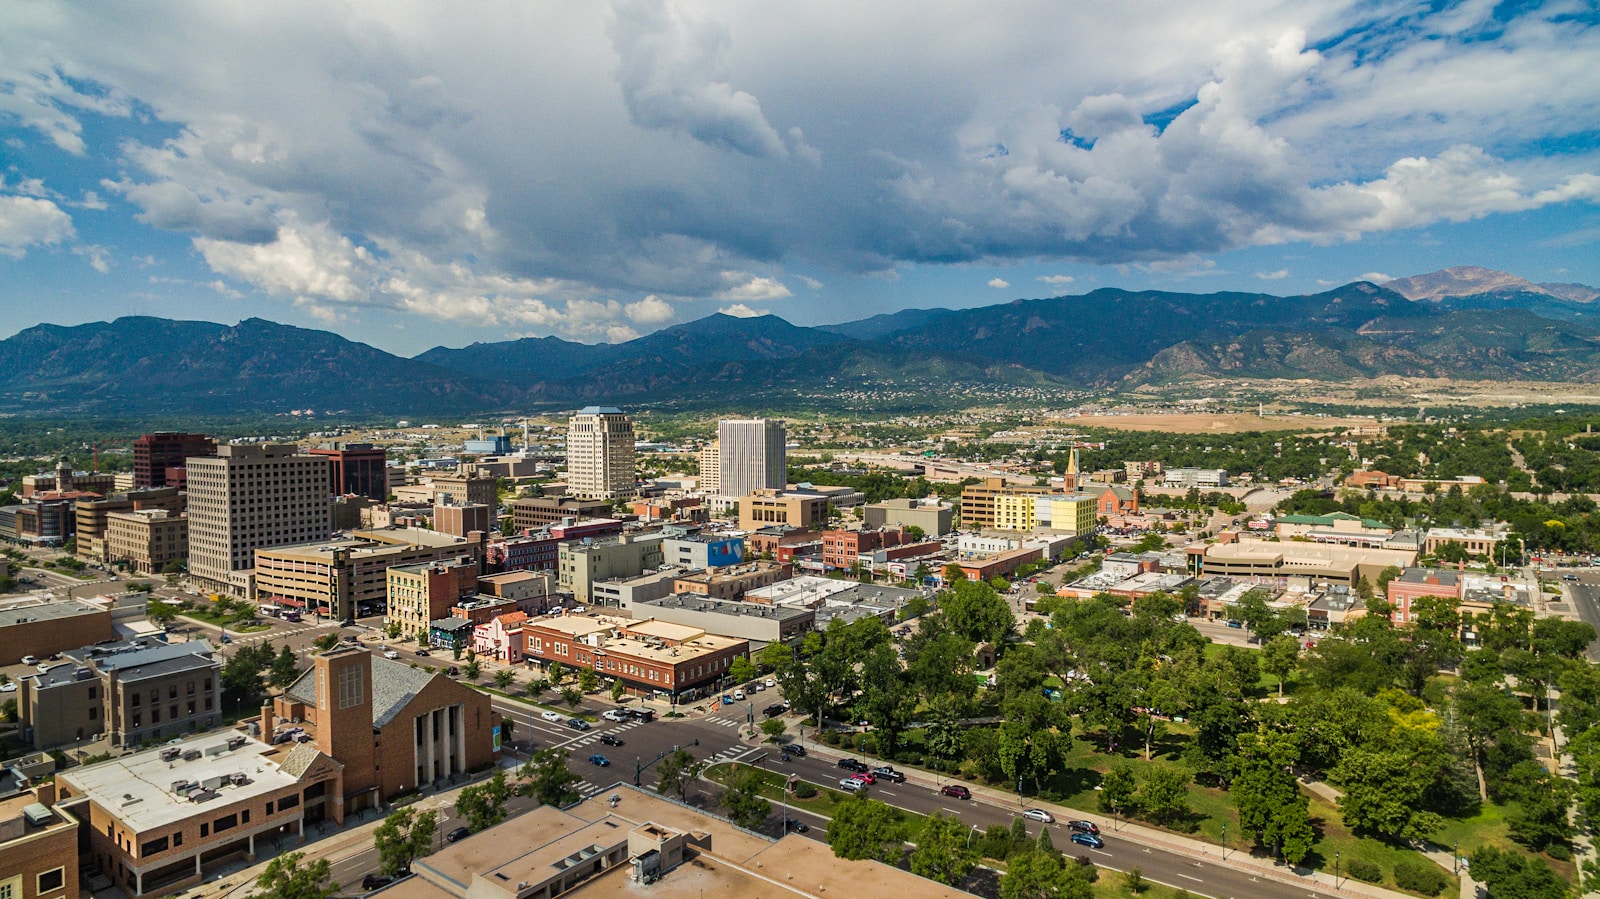
- Change in annual avg. fall temperatures, 1970-2024: +4.7°F
- Baseline avg. fall temperature, 1991-2020: 50.7°F
- Average fall temperature in 2024: 54.2°F (3.5°F warmer than baseline avg.)
- Average fall temperature in 1970: 47.1°F (3.7°F cooler than baseline avg.)
- Local population: 483,099
10. Milwaukee, Wisconsin

- Change in annual avg. fall temperatures, 1970-2024: +4.7°F
- Baseline avg. fall temperature, 1991-2020: 53.5°F
- Average fall temperature in 2024: 57.6°F (4.1°F warmer than baseline avg.)
- Average fall temperature in 1970: 53.0°F (0.5°F cooler than baseline avg.)
- Local population: 569,756
9. Duluth, Minnesota

- Change in annual avg. fall temperatures, 1970-2024: +4.9°F
- Baseline avg. fall temperature, 1991-2020: 43.7°F
- Average fall temperature in 2024: 49.7°F (6.0°F warmer than baseline avg.)
- Average fall temperature in 1970: 42.3°F (1.4°F cooler than baseline avg.)
- Local population: 86,863
8. Minneapolis, Minnesota

- Change in annual avg. fall temperatures, 1970-2024: +5.2°F
- Baseline avg. fall temperature, 1991-2020: 49.3°F
- Average fall temperature in 2024: 55.5°F (6.2°F warmer than baseline avg.)
- Average fall temperature in 1970: 48.1°F (1.2°F cooler than baseline avg.)
- Local population: 426,845
7. Burlington, Vermont

- Change in annual avg. fall temperatures, 1970-2024: +5.2°F
- Baseline avg. fall temperature, 1991-2020: 50.7°F
- Average fall temperature in 2024: 53.7°F (3.0°F warmer than baseline avg.)
- Average fall temperature in 1970: 53.1°F (2.4°F warmer than baseline avg.)
- Local population: 44,649
6. Helena, Montana
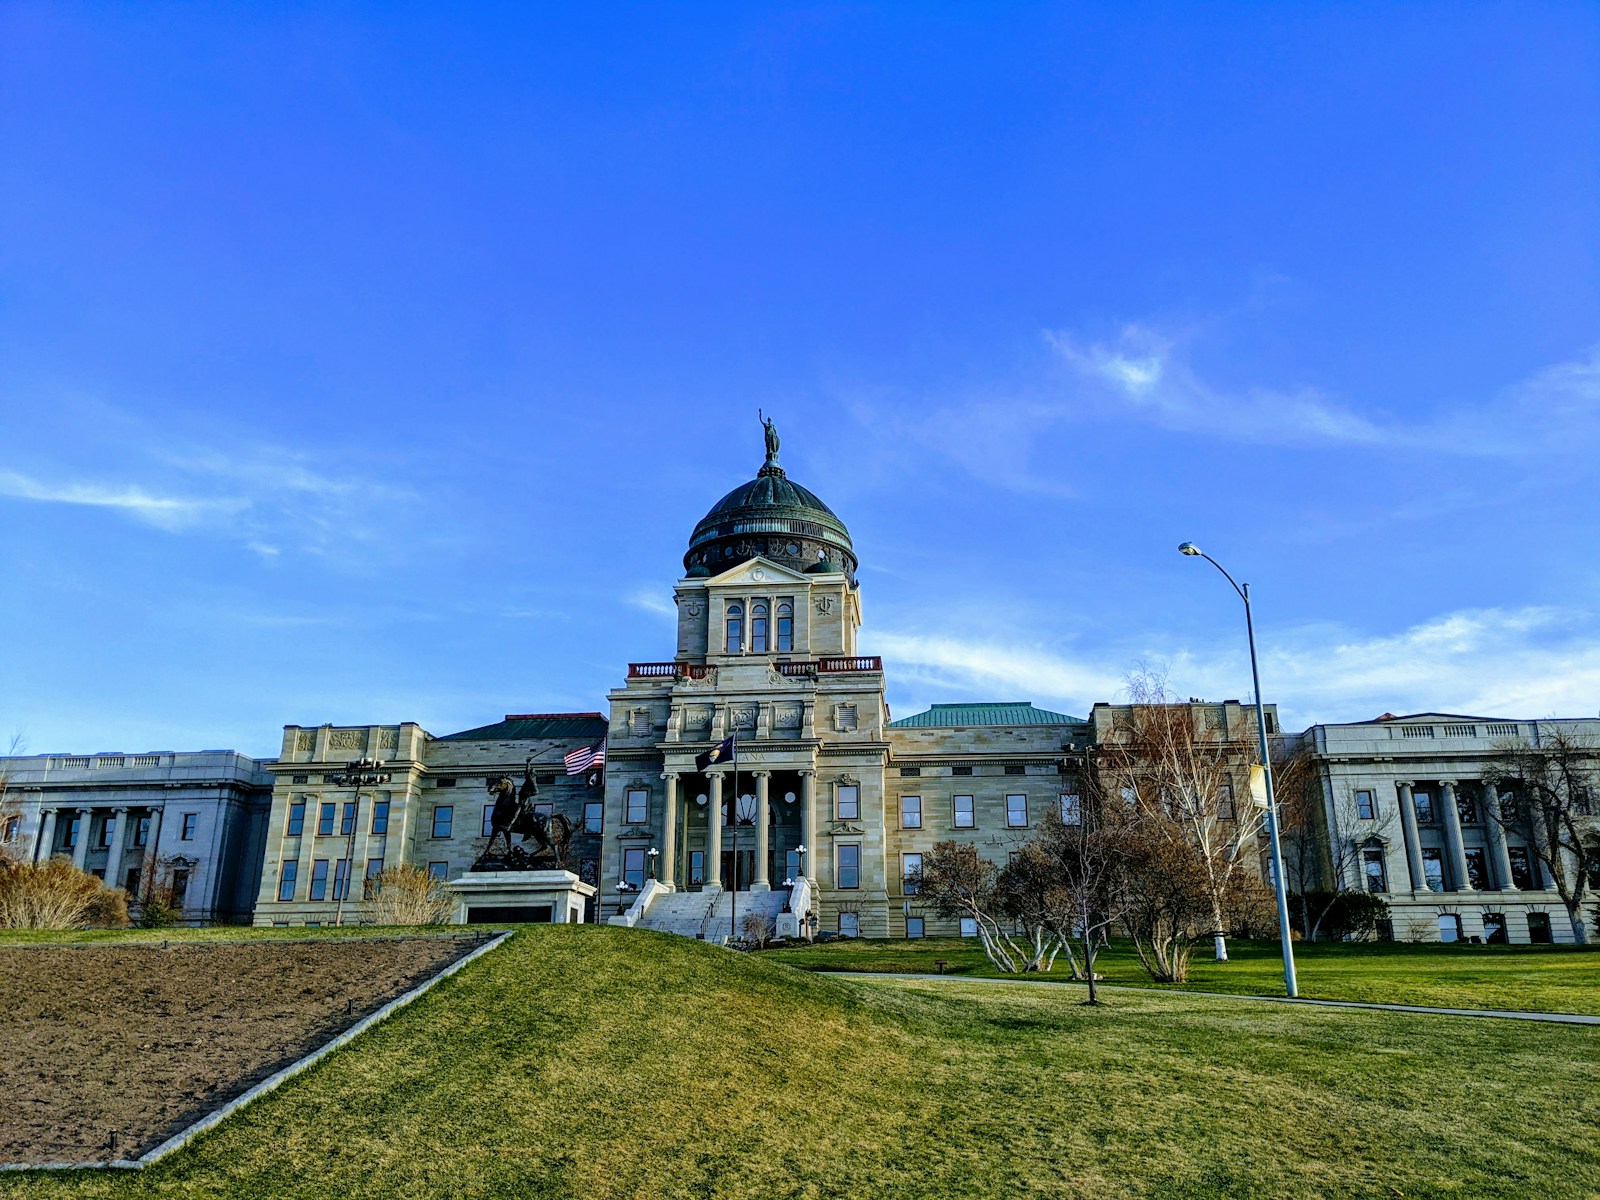
- Change in annual avg. fall temperatures, 1970-2024: +5.4°F
- Baseline avg. fall temperature, 1991-2020: 46.7°F
- Average fall temperature in 2024: 50.5°F (3.8°F warmer than baseline avg.)
- Average fall temperature in 1970: 43.3°F (3.3°F cooler than baseline avg.)
- Local population: 33,126
5. Phoenix, Arizona

- Change in annual avg. fall temperatures, 1970-2024: +5.7°F
- Baseline avg. fall temperature, 1991-2020: 78.6°F
- Average fall temperature in 2024: 81.1°F (2.4°F warmer than baseline avg.)
- Average fall temperature in 1970: 73.8°F (4.8°F cooler than baseline avg.)
- Local population: 1,624,832
4. Tucson, Arizona

- Change in annual avg. fall temperatures, 1970-2024: +5.8°F
- Baseline avg. fall temperature, 1991-2020: 72.6°F
- Average fall temperature in 2024: 75.0°F (2.4°F warmer than baseline avg.)
- Average fall temperature in 1970: 69.1°F (3.4°F cooler than baseline avg.)
- Local population: 543,348
3. Las Vegas, Nevada

- Change in annual avg. fall temperatures, 1970-2024: +6.2°F
- Baseline avg. fall temperature, 1991-2020: 70.2°F
- Average fall temperature in 2024: 72.5°F (2.3°F warmer than baseline avg.)
- Average fall temperature in 1970: 66.6°F (3.6°F cooler than baseline avg.)
- Local population: 650,873
2. El Paso, Texas
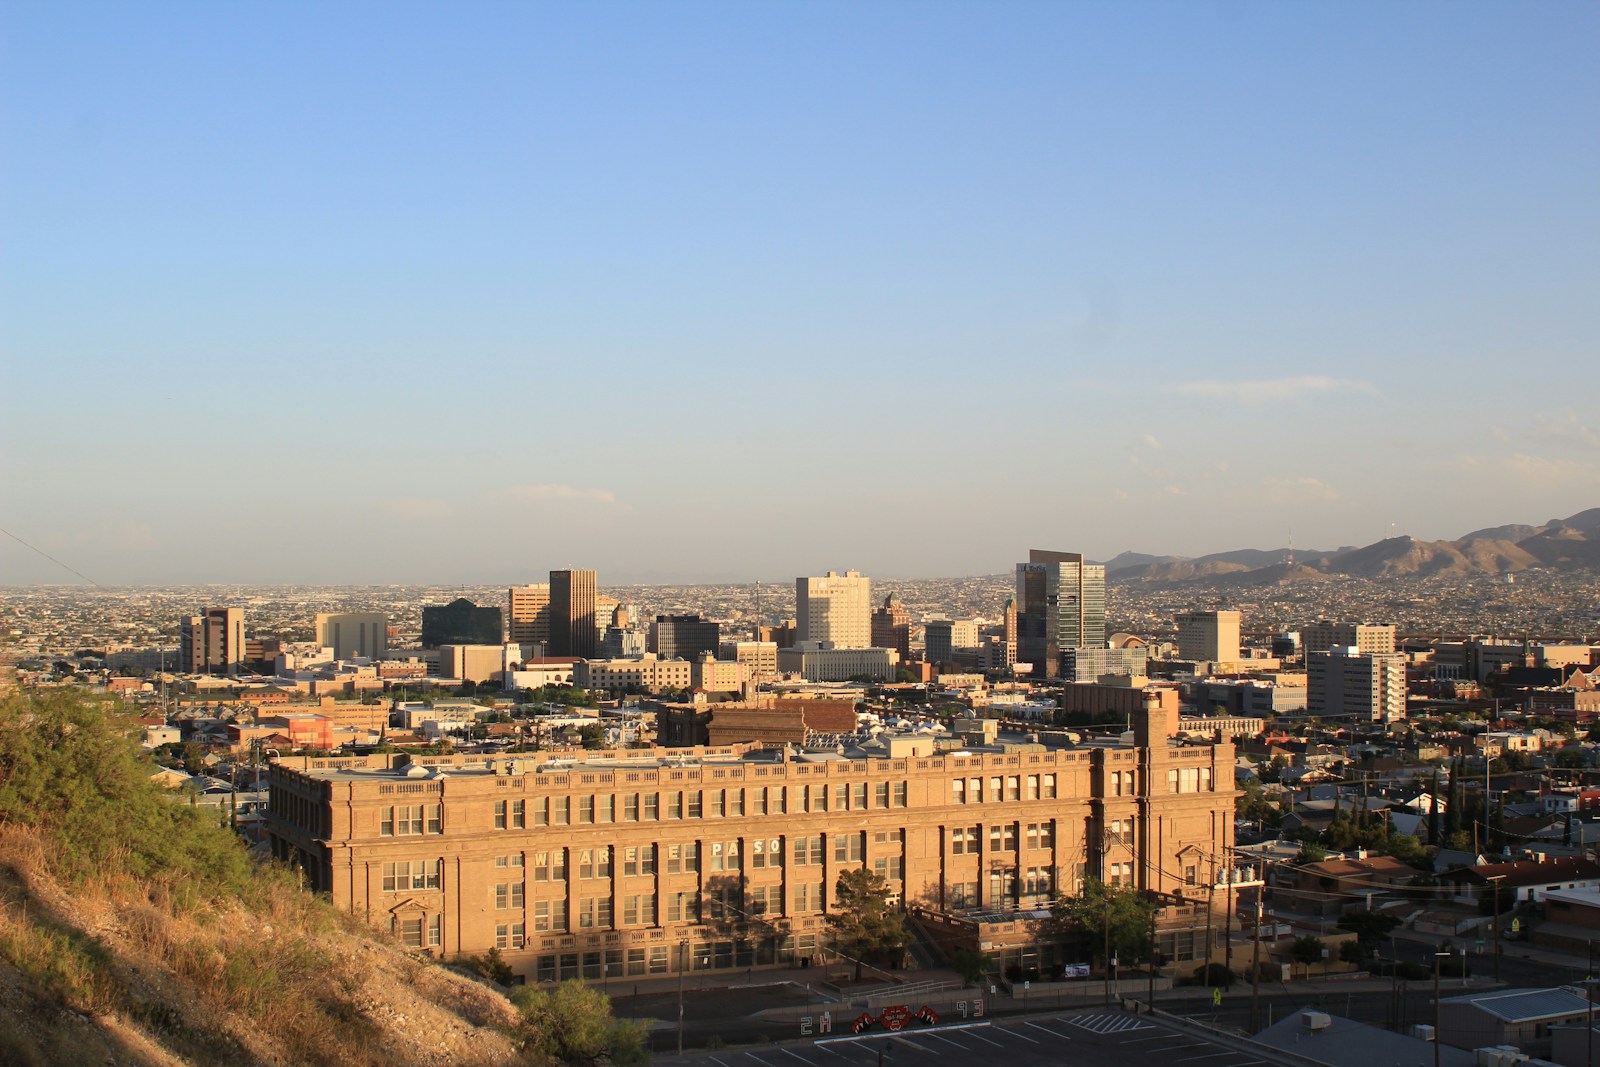
- Change in annual avg. fall temperatures, 1970-2024: +6.5°F
- Baseline avg. fall temperature, 1991-2020: 66.4°F
- Average fall temperature in 2024: 69.4°F (2.9°F warmer than baseline avg.)
- Average fall temperature in 1970: 63.3°F (3.1°F cooler than baseline avg.)
- Local population: 678,147
1. Reno, Nevada
- Change in annual avg. fall temperatures, 1970-2024: +7.7°F
- Baseline avg. fall temperature, 1991-2020: 55.1°F
- Average fall temperature in 2024: 55.9°F (0.8°F warmer than baseline avg.)
- Average fall temperature in 1970: 53.5°F (1.6°F cooler than baseline avg.)
- Local population: 268,959
Sponsor
Find a Vetted Financial Advisor
- Finding a fiduciary financial advisor doesn't have to be hard. SmartAsset's free tool matches you with up to 3 financial advisors that serve your area in 5 minutes.
- Each advisor has been vetted by SmartAsset and is held to a fiduciary standard to act in your best interests. Get on the path toward achieving your financial goals!
More from ClimateCrisis 247
- It Will Still Be 100°F In These 11 Cities This Weekend
- Powerful Storms to Drench Miami, Other Cities Under Flood Watch This Weekend
- Being Poor in These Cities Means Far Greater Exposure to Air Pollution
- Miami, Los Angeles, Other Climate Disaster Zones Americans Are Fleeing