
Cities Where It Now Freezes Much Less In The Fall Than the Past
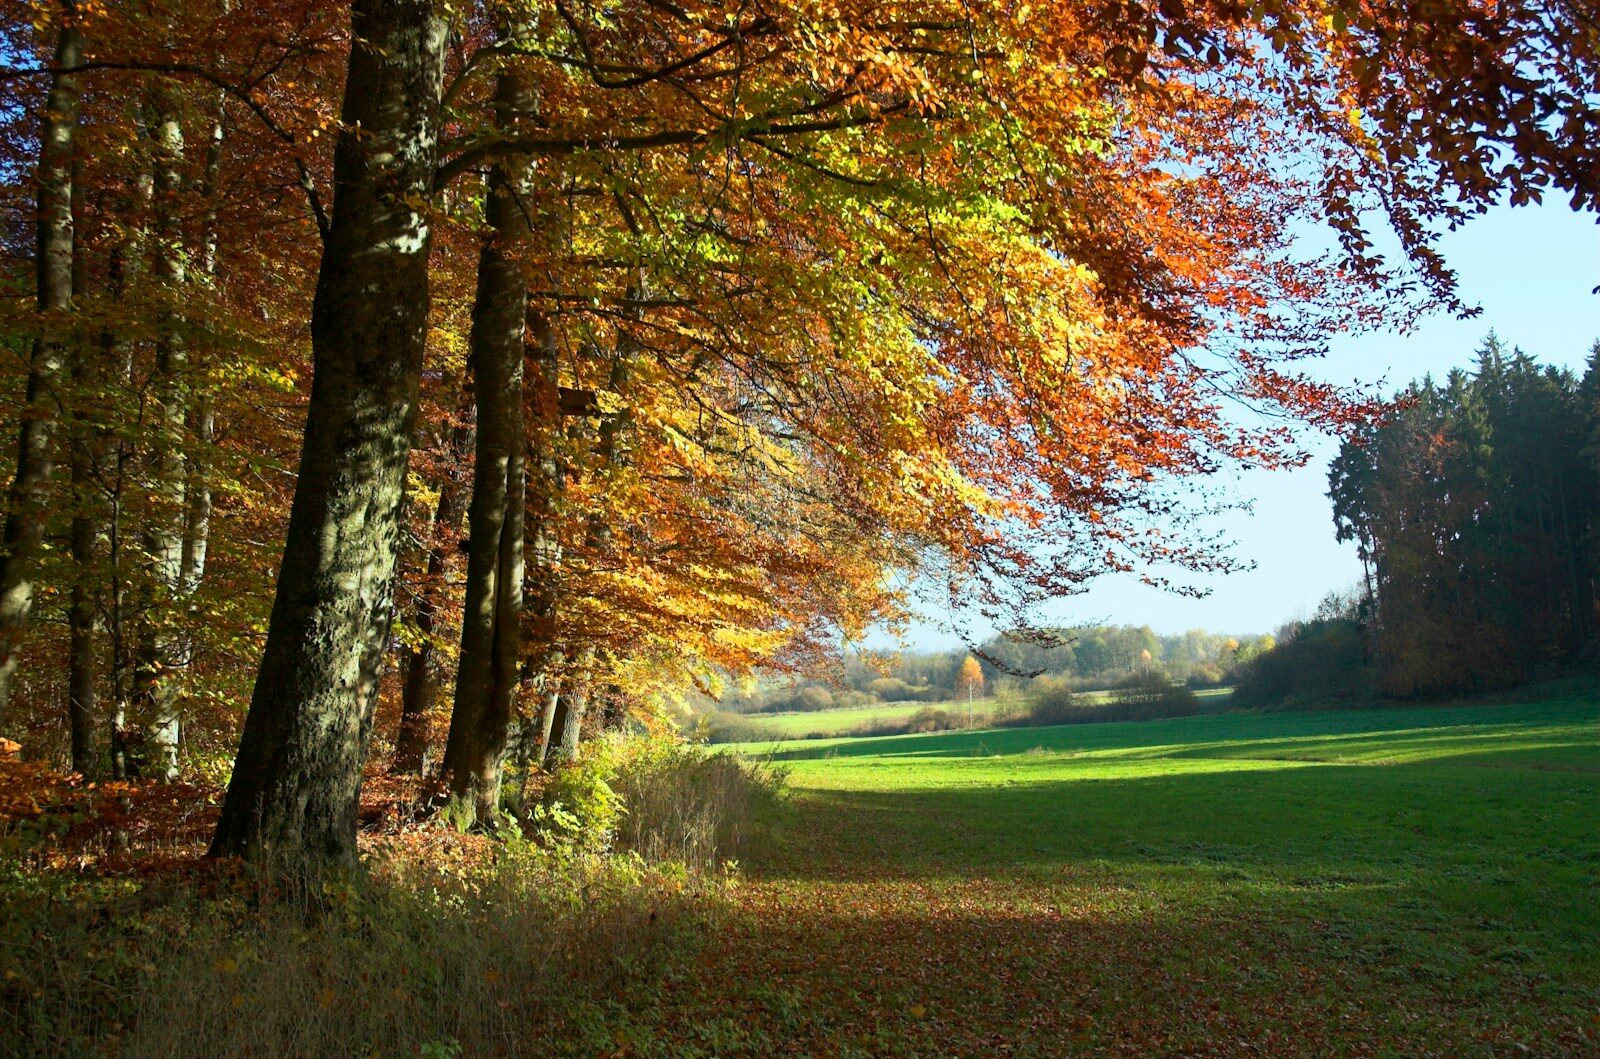
Throughout the meteorological fall, which lasts from the beginning of September until the end of November, the sun falls lower in the sky, the days become shorter, and temperatures drop. A season of transition between summer and winter, fall typically brings freezing weather in much of the United States. In many parts of the country, the first fall frost arrives around mid-October, and at higher latitudes and elevations, freezing temperatures can come as early as September. But in the era of climate change, such hallmarks of the fall season are disappearing.
In major cities across the country, fall days where the mercury hits 32°F or lower are becoming less and less common. A recent report from the non-profit research and advocacy group Climate Central analyzed historical fall weather trends in 202 U.S. cities. The report found that the number of days in the fall season with minimum temperatures of 32°F or lower declined in 88% of U.S. cities between 1970 and 2025, shortening the fall freeze season by an average of 11 days. In a handful of places, the warming trend has been far more pronounced, as the fall-freeze season is now at least three weeks shorter than it was 55 years ago.
Using data from Climate Central, Climate Crisis 247 identified the cities where the fall season is warming the fastest. We ranked all cities included in the Climate Central report on the change in the number of fall days with freezing temperatures between 1970 and 2025. A full methodology is available here. Only the 10 cities with the largest change are listed. Supplemental data on local fall temperature norms and temperatures by year are from the National Oceanic and Atmospheric Administration, and population figures are five-year estimates from the U.S. Census Bureau’s 2024 American Community Survey.
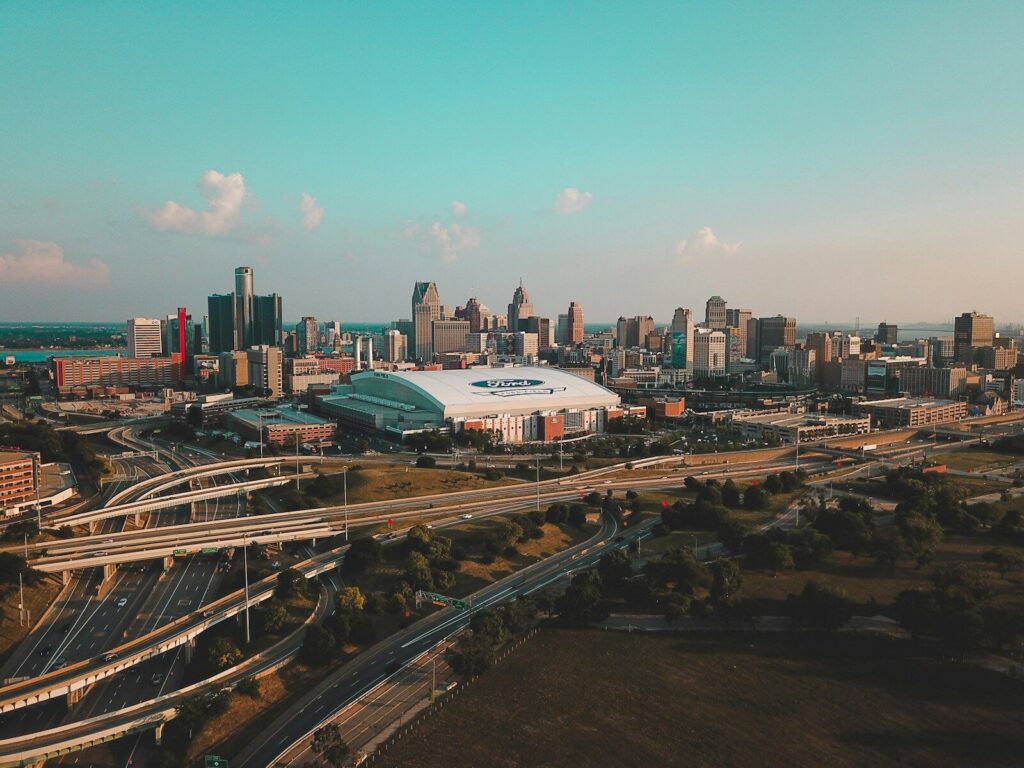
10. Detroit, MI
- Change in freeze-free days during fall season, 1970-2025: +22 days
- Average daily temperature in the fall season by year: 55.5°F in 2025; 54.4°F in 1970
- Average daily low in the fall season by year: 25°F in 2025; 18°F in 1970
- Local fall weather norms, 30-year avg. (1991-2020): 53.1°F avg. temp.; 44.5°F avg. low; 1.9 inches of snow
- Local population: 638,530
9. Minneapolis • St. Paul, MN
- Change in freeze-free days during fall season, 1970-2025: +22 days
- Average daily temperature in the fall season by year: 53.7°F in 2025; 47.8°F in 1970
- Average daily low in the fall season by year: 10°F in 2025; 3°F in 1970
- Local fall weather norms, 30-year avg. (1991-2020): 49.3°F avg. temp.; 40.9°F avg. low; 7.6 inches of snow
- Local population: 734,530
8. Jefferson City, MO
- Change in freeze-free days during fall season, 1970-2025: +22 days
- Average daily temperature in the fall season by year: 61.3°F in 2025; 57.4°F in 1970
- Average daily low in the fall season by year: 22°F in 2025; 13°F in 1970
- Local fall weather norms, 30-year avg. (1991-2020): 57.0°F avg. temp.; 46.2°F avg. low; 0.2 inches of snow
- Local population: 42,488
7. Albany, NY
- Change in freeze-free days during fall season, 1970-2025: +22 days
- Average daily temperature in the fall season by year: 51.7°F in 2025; 52.7°F in 1970
- Average daily low in the fall season by year: 21°F in 2025; 12°F in 1970
- Local fall weather norms, 30-year avg. (1991-2020): 51.8°F avg. temp.; 41.8°F avg. low; 2.9 inches of snow
- Local population: 100,492
6. Medford, OR
- Change in freeze-free days during fall season, 1970-2025: +22 days
- Average daily temperature in the fall season by year: 57.8°F in 2025; 54.4°F in 1970
- Average daily low in the fall season by year: 27°F in 2025; 26°F in 1970
- Local fall weather norms, 30-year avg. (1991-2020): 56.4°F avg. temp.; 43.2°F avg. low; 0.1 inches of snow
- Local population: 86,315
5. Richmond, VA
- Change in freeze-free days during fall season, 1970-2025: +23 days
- Average daily temperature in the fall season by year: 60.1°F in 2025; 62.5°F in 1970
- Average daily low in the fall season by year: 22°F in 2025; 14°F in 1970
- Local fall weather norms, 30-year avg. (1991-2020): 60.2°F avg. temp.; 49.6°F avg. low; 0 inches of snow
- Local population: 229,359
4. Boise, ID
- Change in freeze-free days during fall season, 1970-2025: +24 days
- Average daily temperature in the fall season by year: 56.6°F in 2025; 49.5°F in 1970
- Average daily low in the fall season by year: 26°F in 2025; 22°F in 1970
- Local fall weather norms, 30-year avg. (1991-2020): 53.3°F avg. temp.; 42.0°F avg. low; 2.1 inches of snow
- Local population: 237,242
3. Tupelo, MS
- Change in freeze-free days during fall season, 1970-2025: +24 days
- Average daily temperature in the fall season by year: 65.3°F in 2025; 62.9°F in 1970
- Average daily low in the fall season by year: 23°F in 2025; 11°F in 1970
- Local fall weather norms, 30-year avg. (1991-2020): 64.3°F avg. temp.; 52.8°F avg. low; 0 inches of snow
- Local population: 37,791
2. Reno, NV
- Change in freeze-free days during fall season, 1970-2025: +26 days
- Average daily temperature in the fall season by year: 57.3°F in 2025; 50.2°F in 1970
- Average daily low in the fall season by year: 27°F in 2025; 15°F in 1970
- Local fall weather norms, 30-year avg. (1991-2020): 55.5°F avg. temp.; 42.8°F avg. low; 2 inches of snow
- Local population: 273,212
1. Toledo, OH
- Change in freeze-free days during fall season, 1970-2025: +28 days
- Average daily temperature in the fall season by year: 54.3°F in 2025; 52.7°F in 1970
- Average daily low in the fall season by year: 21°F in 2025; 13°F in 1970
- Local fall weather norms, 30-year avg. (1991-2020): 54.6°F avg. temp.; 44.6°F avg. low; 1.8 inches of snow
- Local population: 267,463
More from ClimateCrisis 247
- Six American Cities Facing Billion Dollar Flood Losses
- Tips on How Americans Can Save 25% On Gas
- Summer 2026 Ended with Freezing Temperatures in These 10 States
- By 2100, US Cities Where 100 Degree Temperatures Will Hit Daily in Summer





