
20 Airports Where Climate Change Is Causing More Delays
 https://climate-crisis-247-bucket.nyc3.cdn.digitaloceanspaces.com/wp-content/uploads/2025/09/07201740/2833379-150x150.png
Climate change is having an increasing effect on air travel. Hotter air, shifting wind patterns, and increasing storm activity complicate the takeoff and landing processes, while rising seas and shrinking coastlines subject coastal airports to more frequent flooding.
Hot property? From Maui to Malibu, These Affluent Enclaves Are Becoming Wildfire Hotspots
Whence the next pandemic? Cities Where the Next Pandemic Is Most Likely to Break Out
Weather-related flight delays have increased in tandem with climate change, with some smaller airports reporting double-digit growth in weather-related delay activity. A closer look at data from the Bureau of Transportation Statistics reveals the airports where weather-related delays have increased the most since 2018.
To determine the airports where extreme weather is causing more delay activity, Climate Crisis 247 reviewed data on airport departures from the U.S. Bureau of Transportation Statistics. Airports were ranked based on the percentage-point change in weather-related departure delay activity as a share of all departure delay activity from 2018 to 2024. Delay activity is measured in total minutes of flight delay and is reported by cause by airline carriers. Only airports with at least 4,000 departing flights in 2024 were considered. Data on 2024 flights is through September 2024.
20. San Diego International (San Diego, CA)
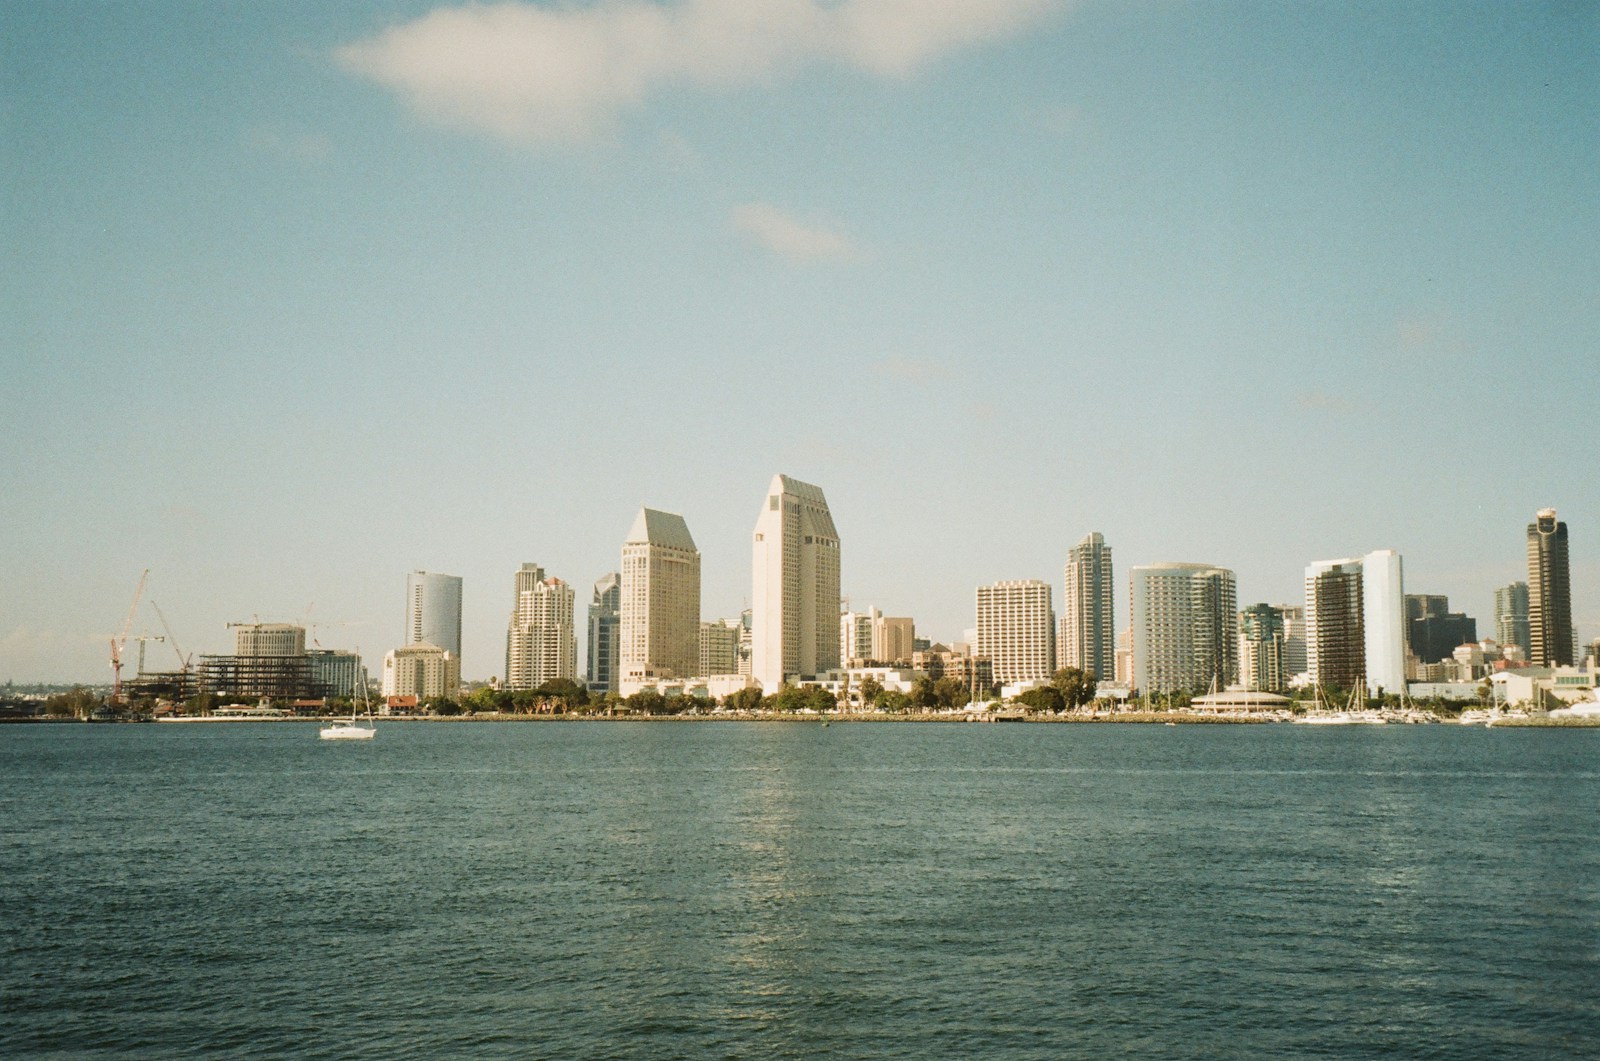
- Weather-related delays, 2024: 3.0% of all delays (+1.7 ppts from 2018)
- Weather-related delays, 2018: 1.4% of all delays
- All departing flights that are delayed: 17.3%
19. Glacier Park International (Kalispell, MT)

- Weather-related delays, 2024: 5.8% of all delays (+1.7 ppts from 2018)
- Weather-related delays, 2018: 4.1% of all delays
- All departing flights that are delayed: 12.6%
18. Louis Armstrong New Orleans International (New Orleans, LA)

- Weather-related delays, 2024: 5.3% of all delays (+1.7 ppts from 2018)
- Weather-related delays, 2018: 3.5% of all delays
- All departing flights that are delayed: 19.3%
17. Cherry Capital (Traverse City, MI)

- Weather-related delays, 2024: 8.1% of all delays (+2.0 ppts from 2018)
- Weather-related delays, 2018: 6.1% of all delays
- All departing flights that are delayed: 16.2%
16. Northwest Florida Beaches International (Panama City, FL)

- Weather-related delays, 2024: 5.4% of all delays (+2.1 ppts from 2018)
- Weather-related delays, 2018: 3.2% of all delays
- All departing flights that are delayed: 16.1%
15. Charlotte Douglas International (Charlotte, NC)
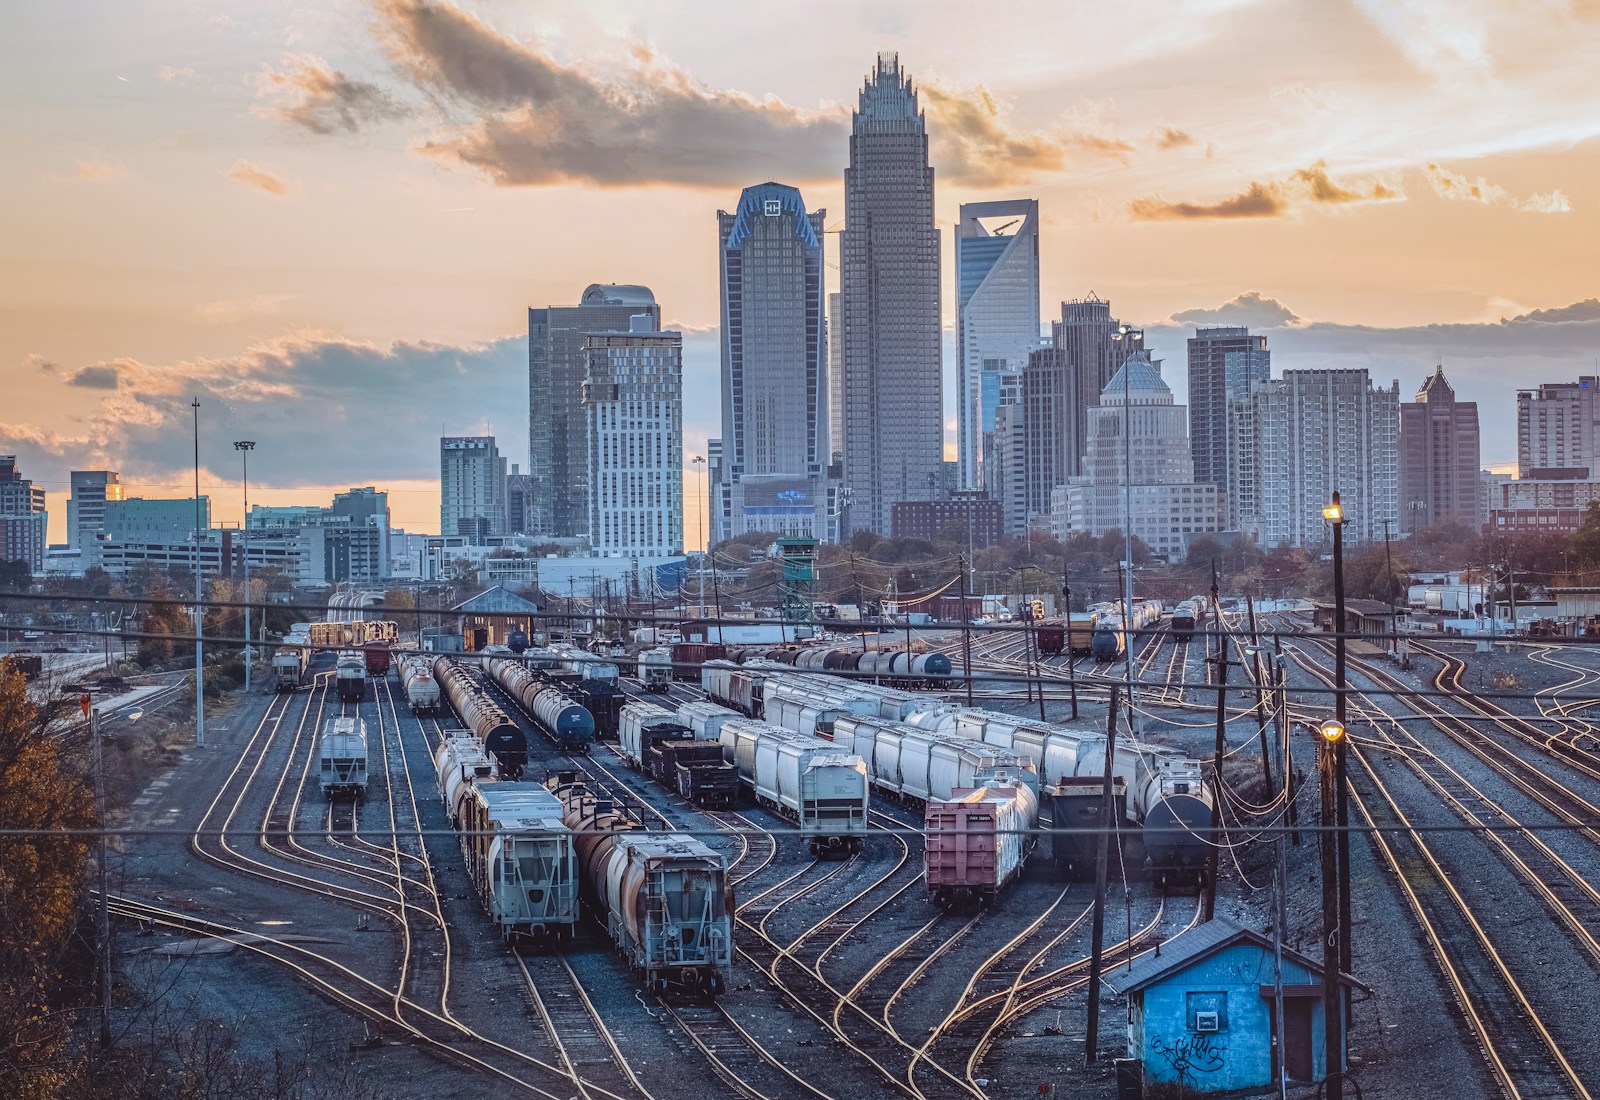
- Weather-related delays, 2024: 8.6% of all delays (+2.2 ppts from 2018)
- Weather-related delays, 2018: 6.5% of all delays
- All departing flights that are delayed: 18.9%
14. Fort Wayne International (Fort Wayne, IN)

- Weather-related delays, 2024: 7.7% of all delays (+2.2 ppts from 2018)
- Weather-related delays, 2018: 5.6% of all delays
- All departing flights that are delayed: 17.0%
13. St Pete Clearwater International (St. Petersburg, FL)
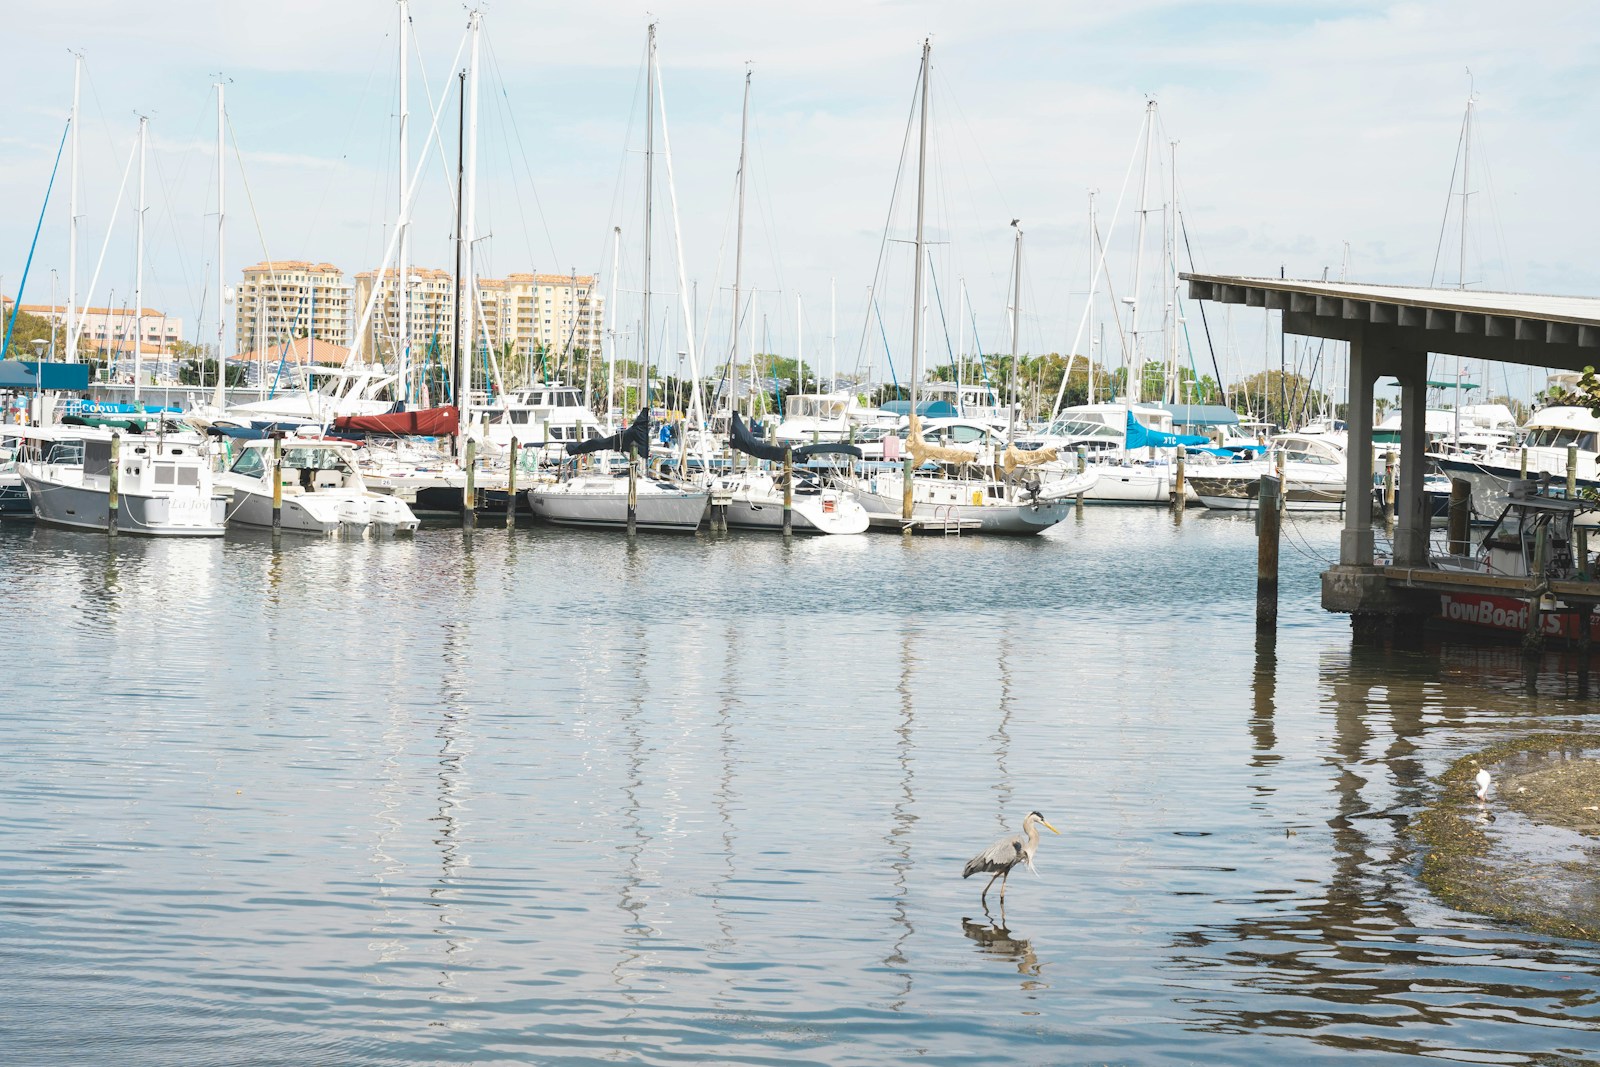
- Weather-related delays, 2024: 15.4% of all delays (+2.3 ppts from 2018)
- Weather-related delays, 2018: 13.1% of all delays
- All departing flights that are delayed: 15.3%
12. Pensacola International (Pensacola, FL)
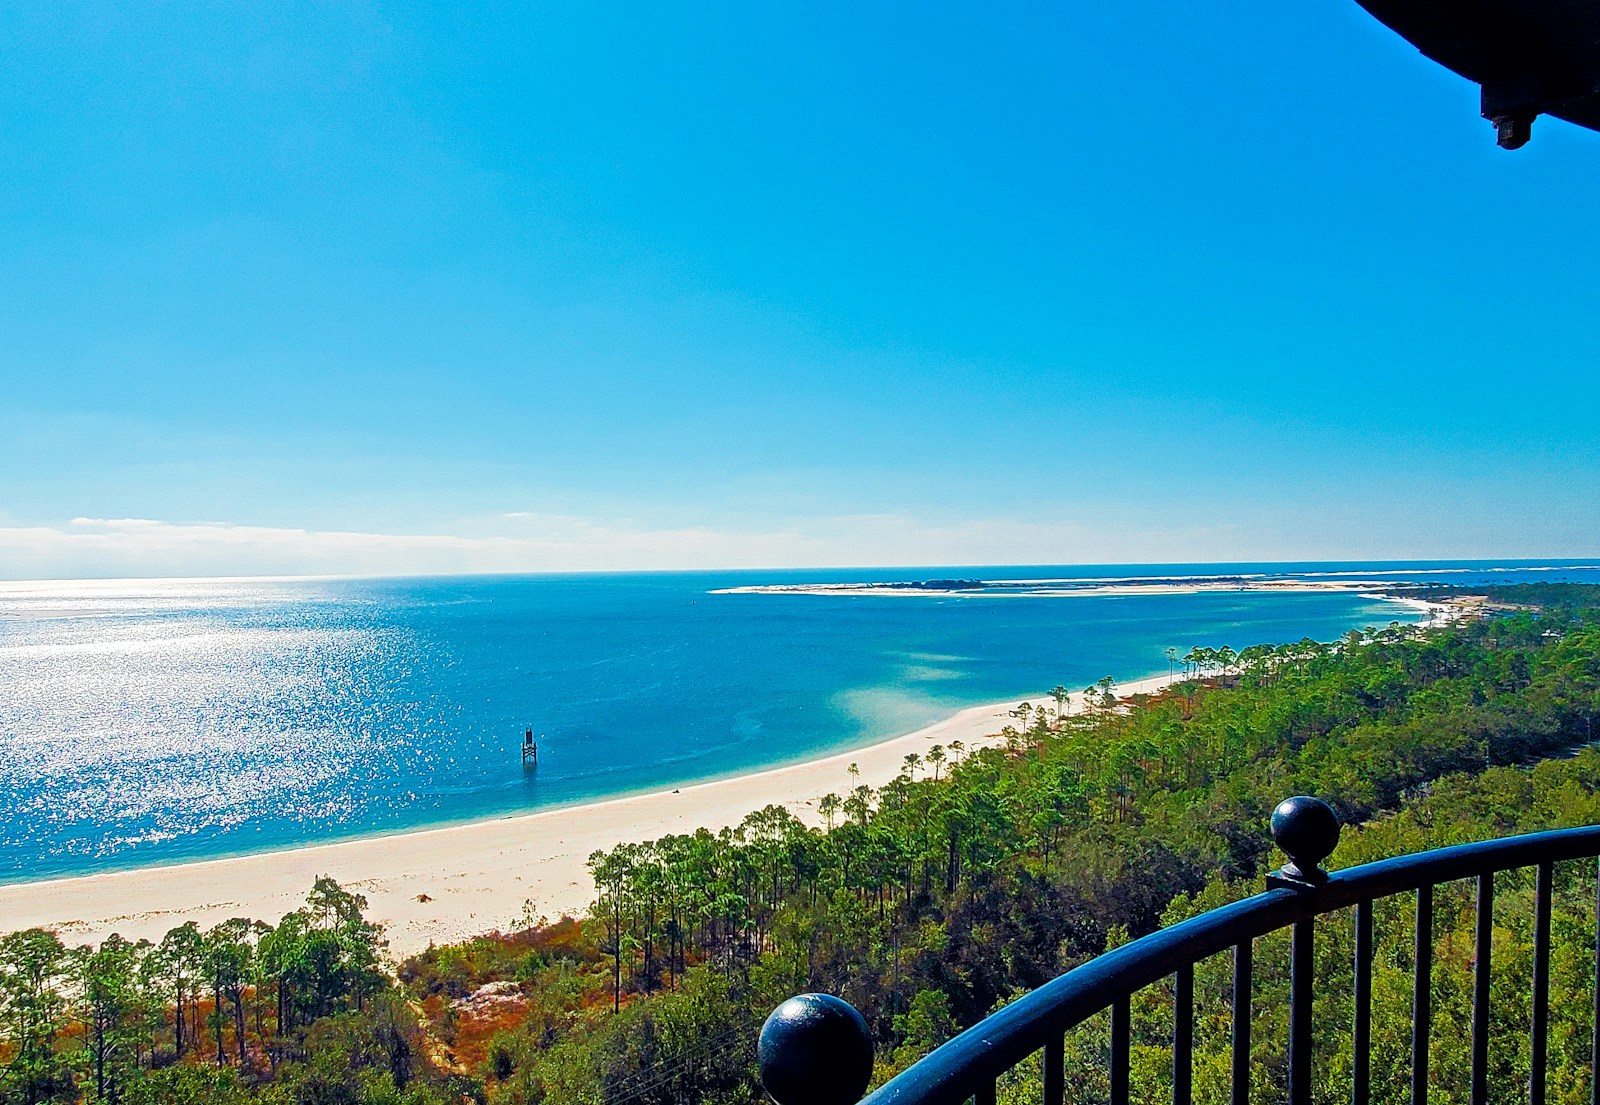
- Weather-related delays, 2024: 6.7% of all delays (+2.4 ppts from 2018)
- Weather-related delays, 2018: 4.3% of all delays
- All departing flights that are delayed: 14.3%
11. Portland International (Portland, OR)
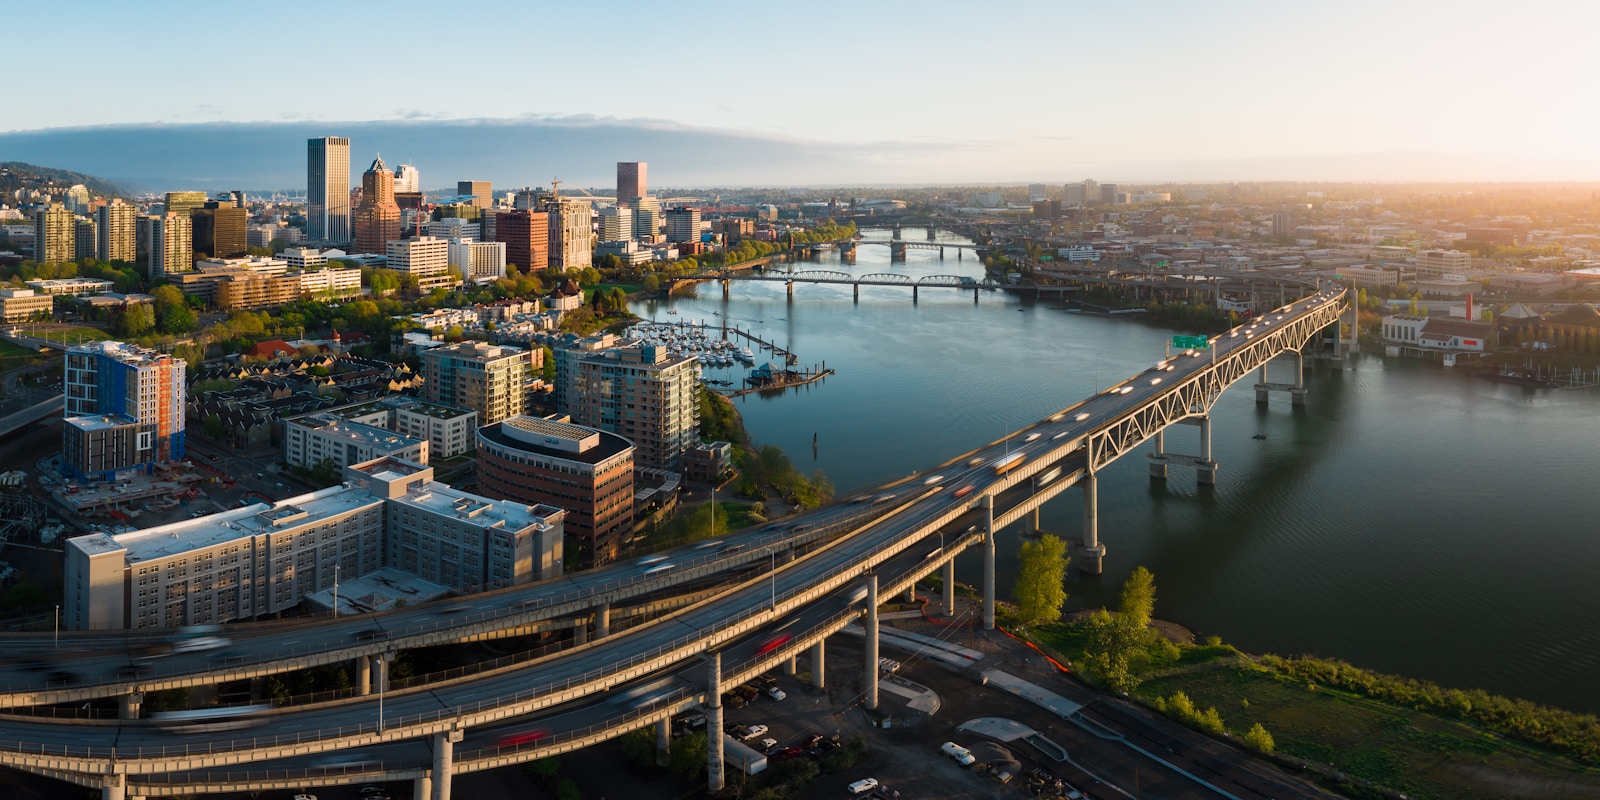
- Weather-related delays, 2024: 4.4% of all delays (+2.8 ppts from 2018)
- Weather-related delays, 2018: 1.6% of all delays
- All departing flights that are delayed: 12.6%
10. Austin - Bergstrom International (Austin, TX)
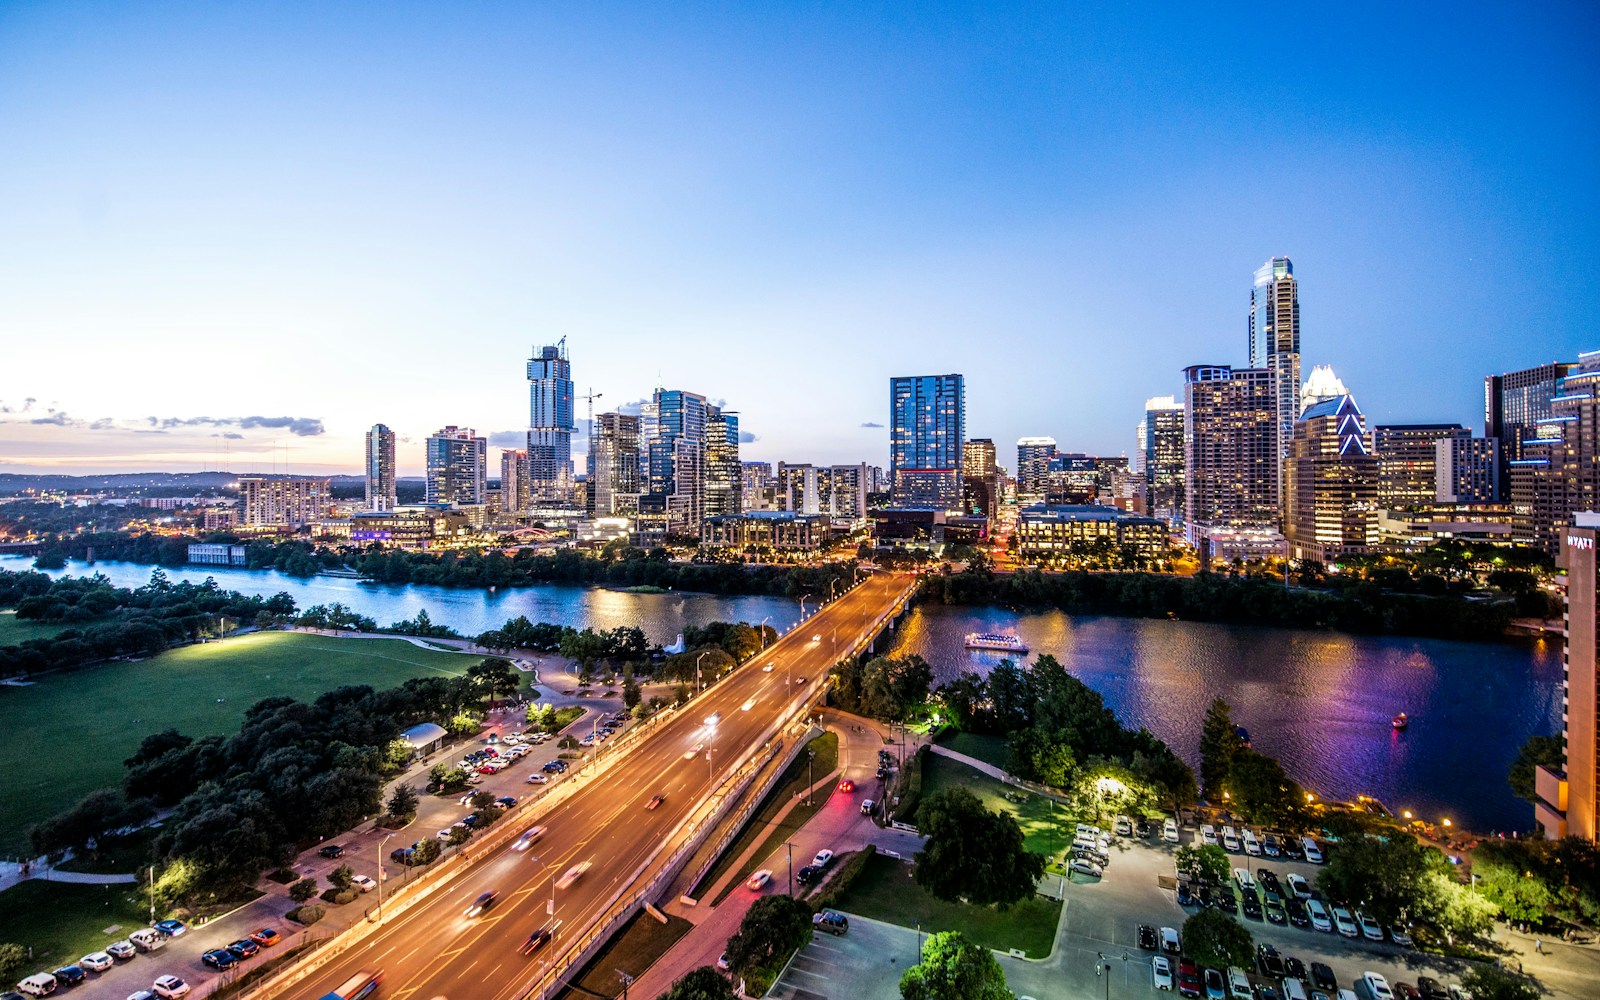
- Weather-related delays, 2024: 5.7% of all delays (+3.3 ppts from 2018)
- Weather-related delays, 2018: 2.4% of all delays
- All departing flights that are delayed: 17.8%
9. Tallahassee International (Tallahassee, FL)

- Weather-related delays, 2024: 7.2% of all delays (+3.4 ppts from 2018)
- Weather-related delays, 2018: 3.8% of all delays
- All departing flights that are delayed: 14.0%
8. Huntsville International-Carl T Jones Field (Huntsville, AL)
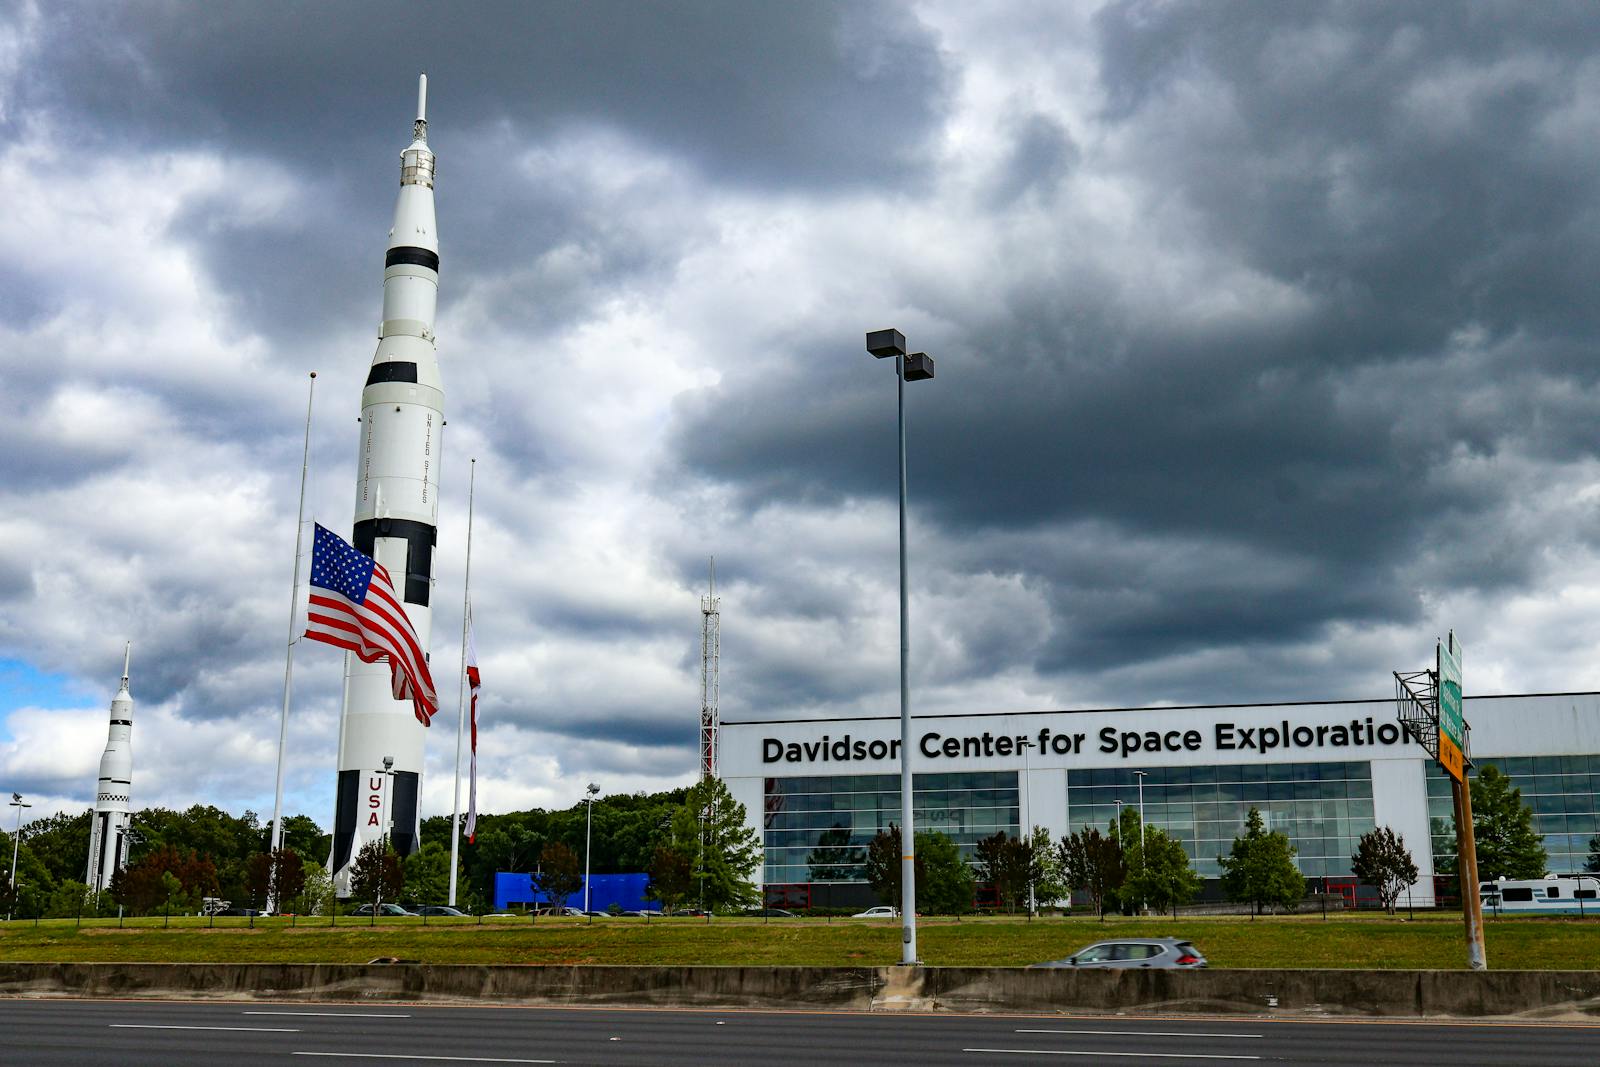
- Weather-related delays, 2024: 8.7% of all delays (+5.6 ppts from 2018)
- Weather-related delays, 2018: 3.1% of all delays
- All departing flights that are delayed: 14.9%
7. Missoula Montana (Missoula, MT)

- Weather-related delays, 2024: 8.9% of all delays (+6.0 ppts from 2018)
- Weather-related delays, 2018: 2.9% of all delays
- All departing flights that are delayed: 13.8%
6. Bill and Hillary Clinton Nat Adams Field (Little Rock, AR)
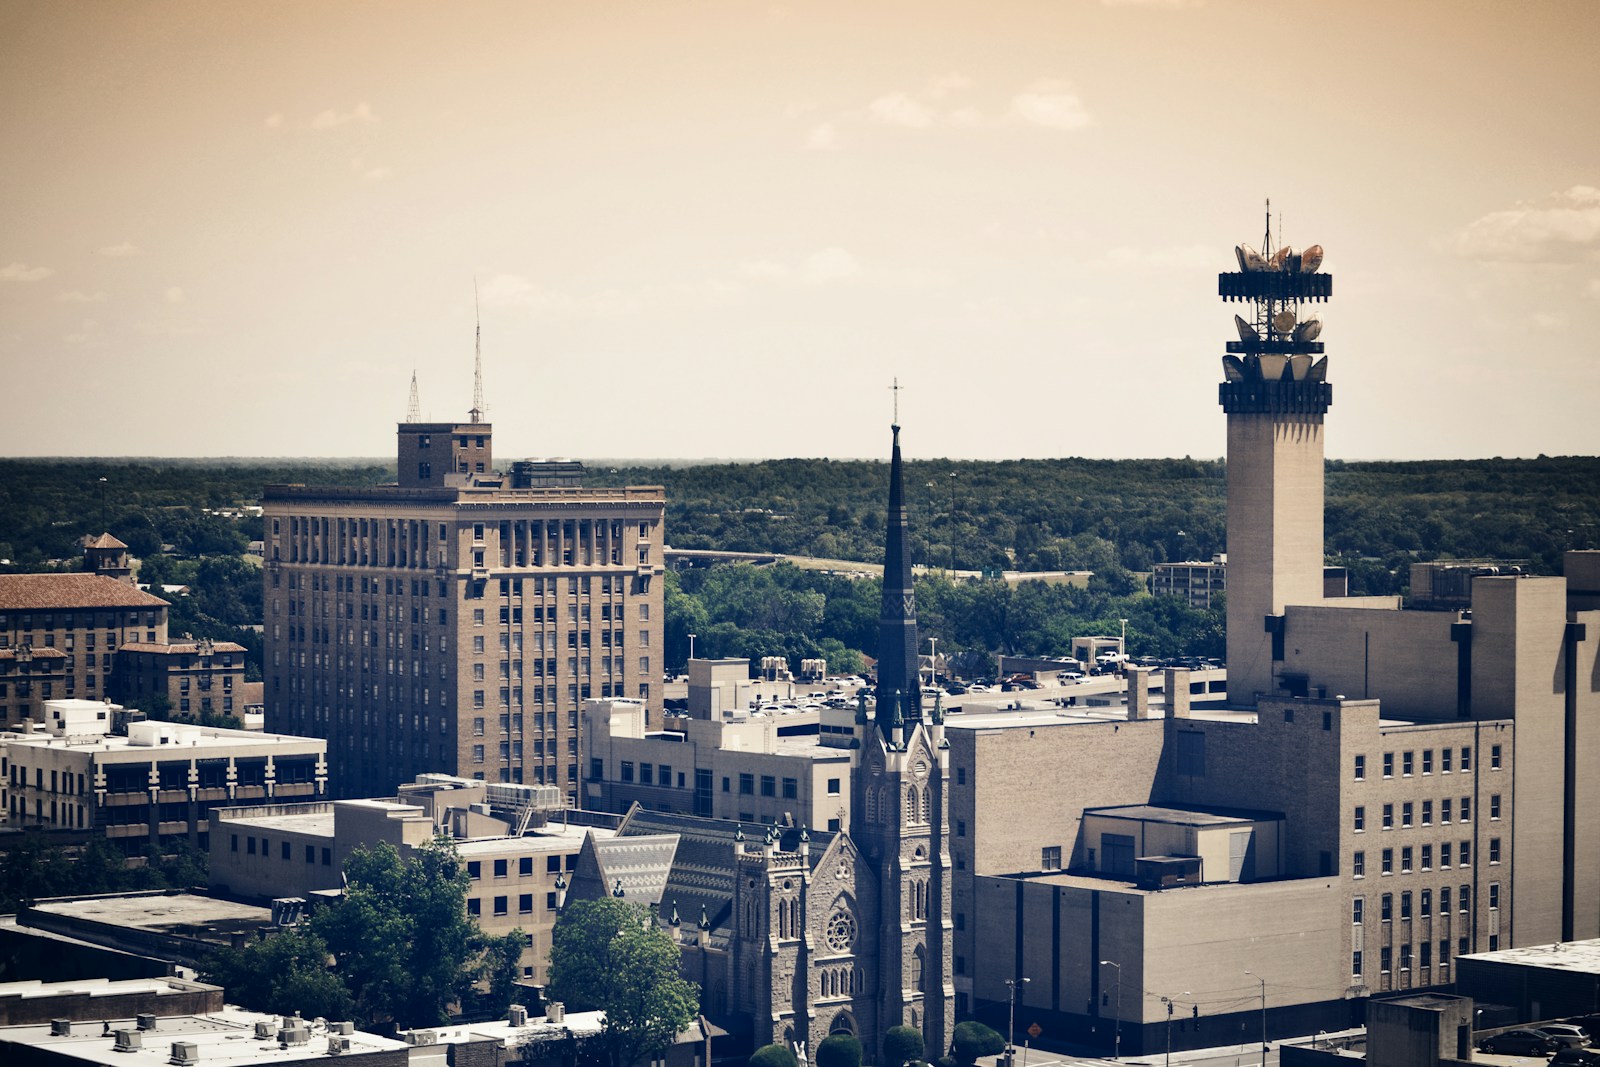
- Weather-related delays, 2024: 10.4% of all delays (+6.2 ppts from 2018)
- Weather-related delays, 2018: 4.2% of all delays
- All departing flights that are delayed: 15.1%
5. Springfield-Branson National (Springfield, MO)

- Weather-related delays, 2024: 13.1% of all delays (+6.3 ppts from 2018)
- Weather-related delays, 2018: 6.8% of all delays
- All departing flights that are delayed: 17.2%
4. Appleton International (Appleton, WI)

- Weather-related delays, 2024: 13.7% of all delays (+7.2 ppts from 2018)
- Weather-related delays, 2018: 6.6% of all delays
- All departing flights that are delayed: 14.4%
3. Eppley Airfield (Omaha, NE)
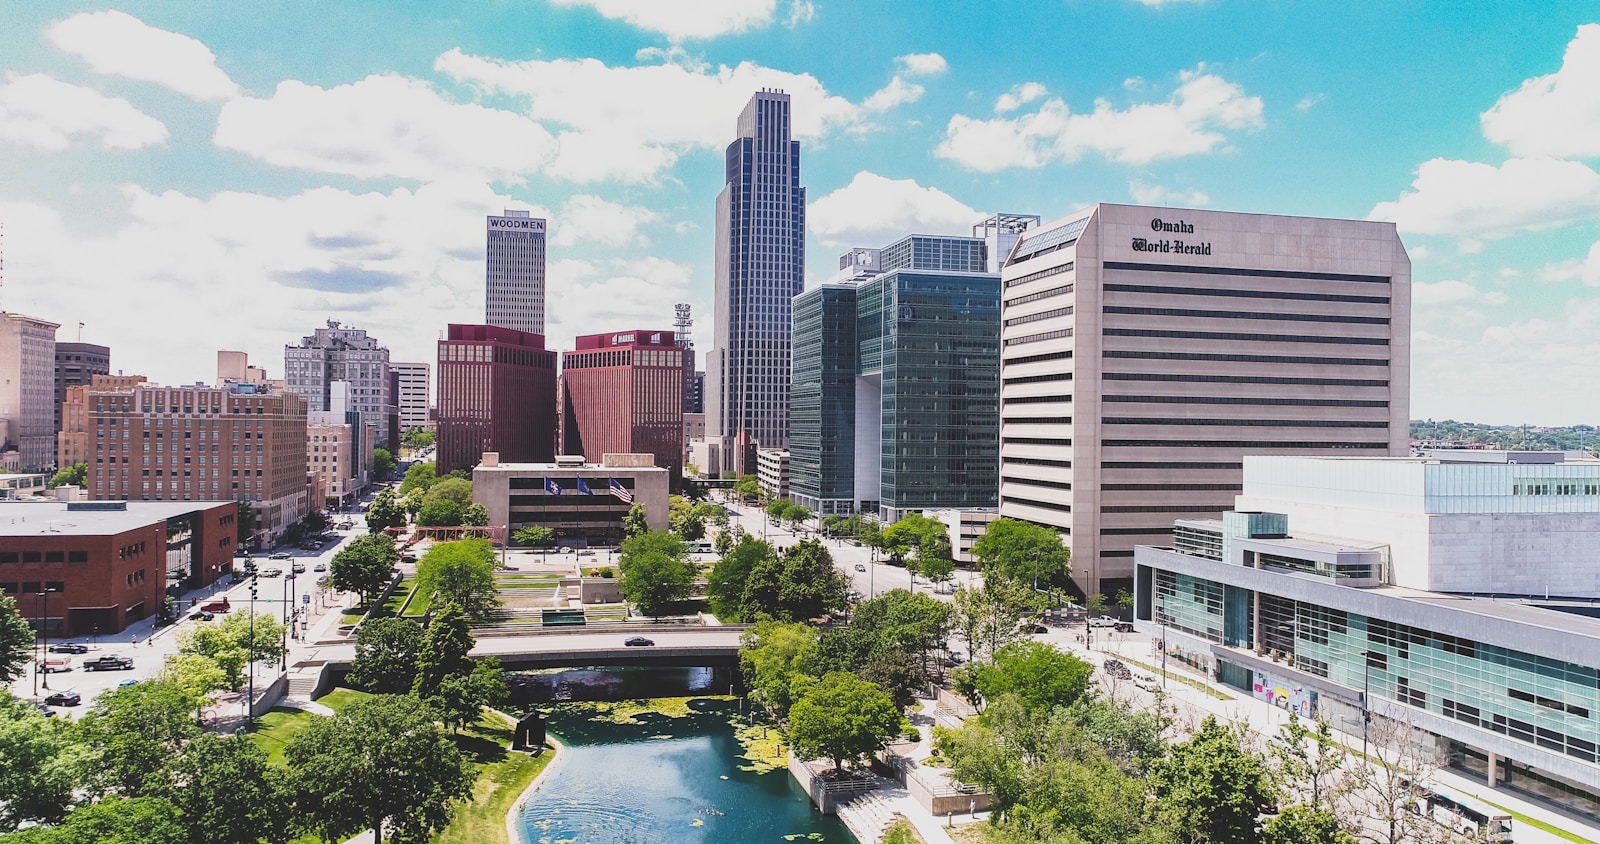
- Weather-related delays, 2024: 10.8% of all delays (+7.4 ppts from 2018)
- Weather-related delays, 2018: 3.4% of all delays
- All departing flights that are delayed: 14.8%
2. Roberts Field (Bend/Redmond, OR)

- Weather-related delays, 2024: 16.5% of all delays (+11.1 ppts from 2018)
- Weather-related delays, 2018: 5.4% of all delays
- All departing flights that are delayed: 14.5%
1. Aspen Pitkin County Sardy Field (Aspen, CO)

- Weather-related delays, 2024: 25.9% of all delays (+19.0 ppts from 2018)
- Weather-related delays, 2018: 6.9% of all delays
- All departing flights that are delayed: 19.6%