Air Quality Drops In These 25 Cities Amidst Record-Breaking Temperatures
 https://climate-crisis-247-bucket.nyc3.cdn.digitaloceanspaces.com/wp-content/uploads/2024/10/08002413/266558-150x150.jpg
This week, much of the United States experienced what is being described as a “second summer.” Temperatures in some cities are more than 20°F above historical normals for October, with weeks of no rain and little rain forecast for the near future.
Going green? The 25 Best Cities For Sustainable Construction
Worst hurricane ever? How Helene And Milton Rank Among The Fastest Wind Speeds Ever Recorded
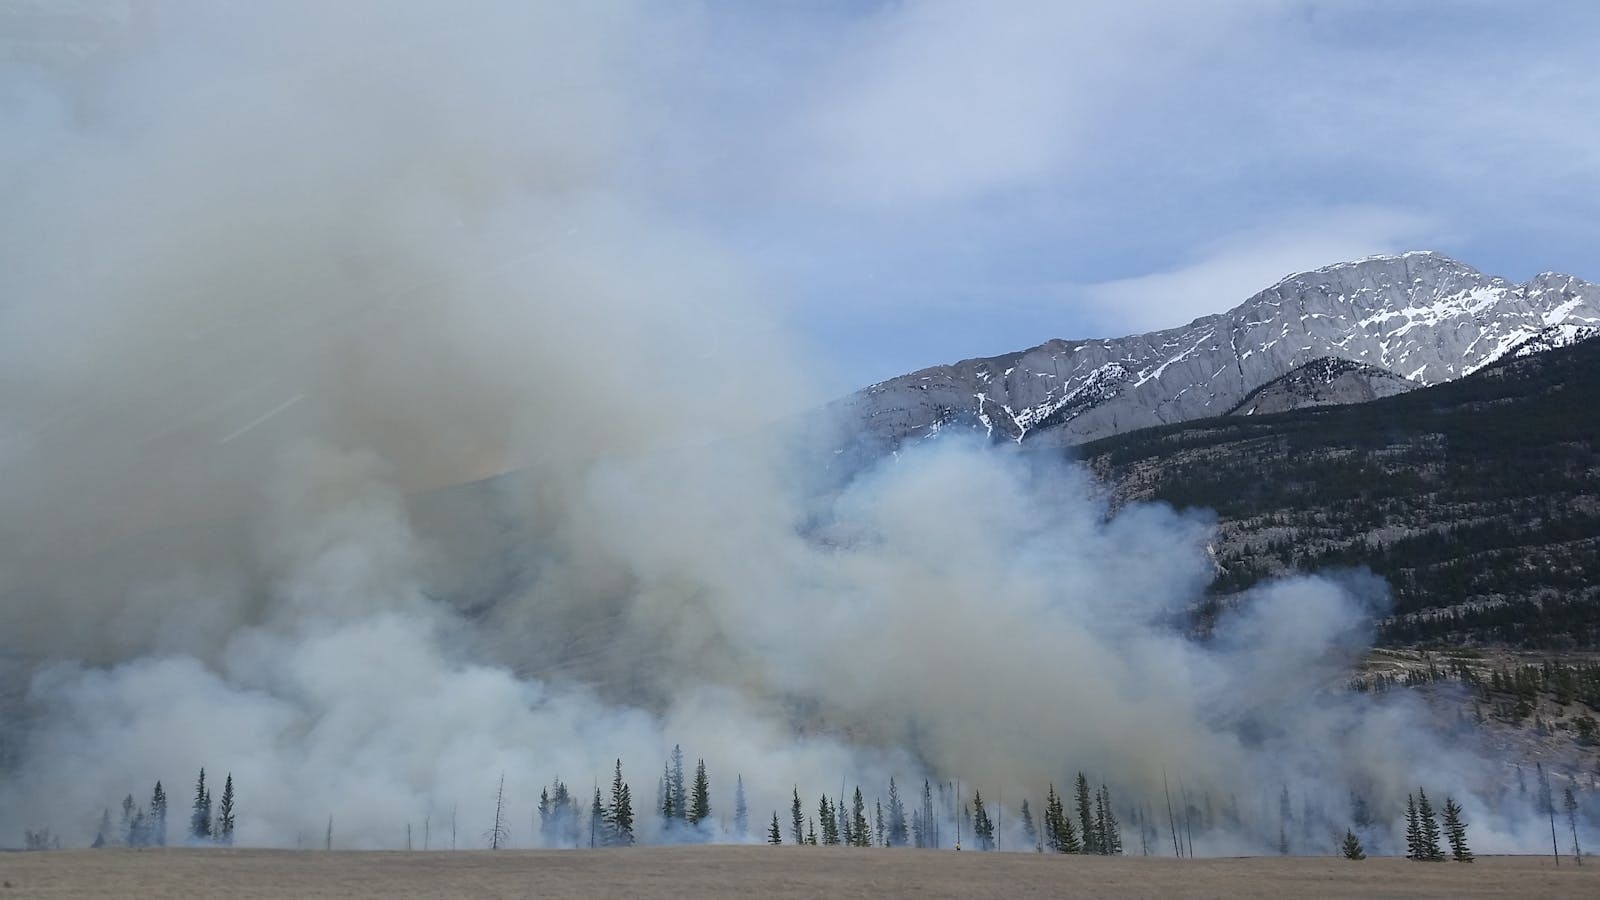
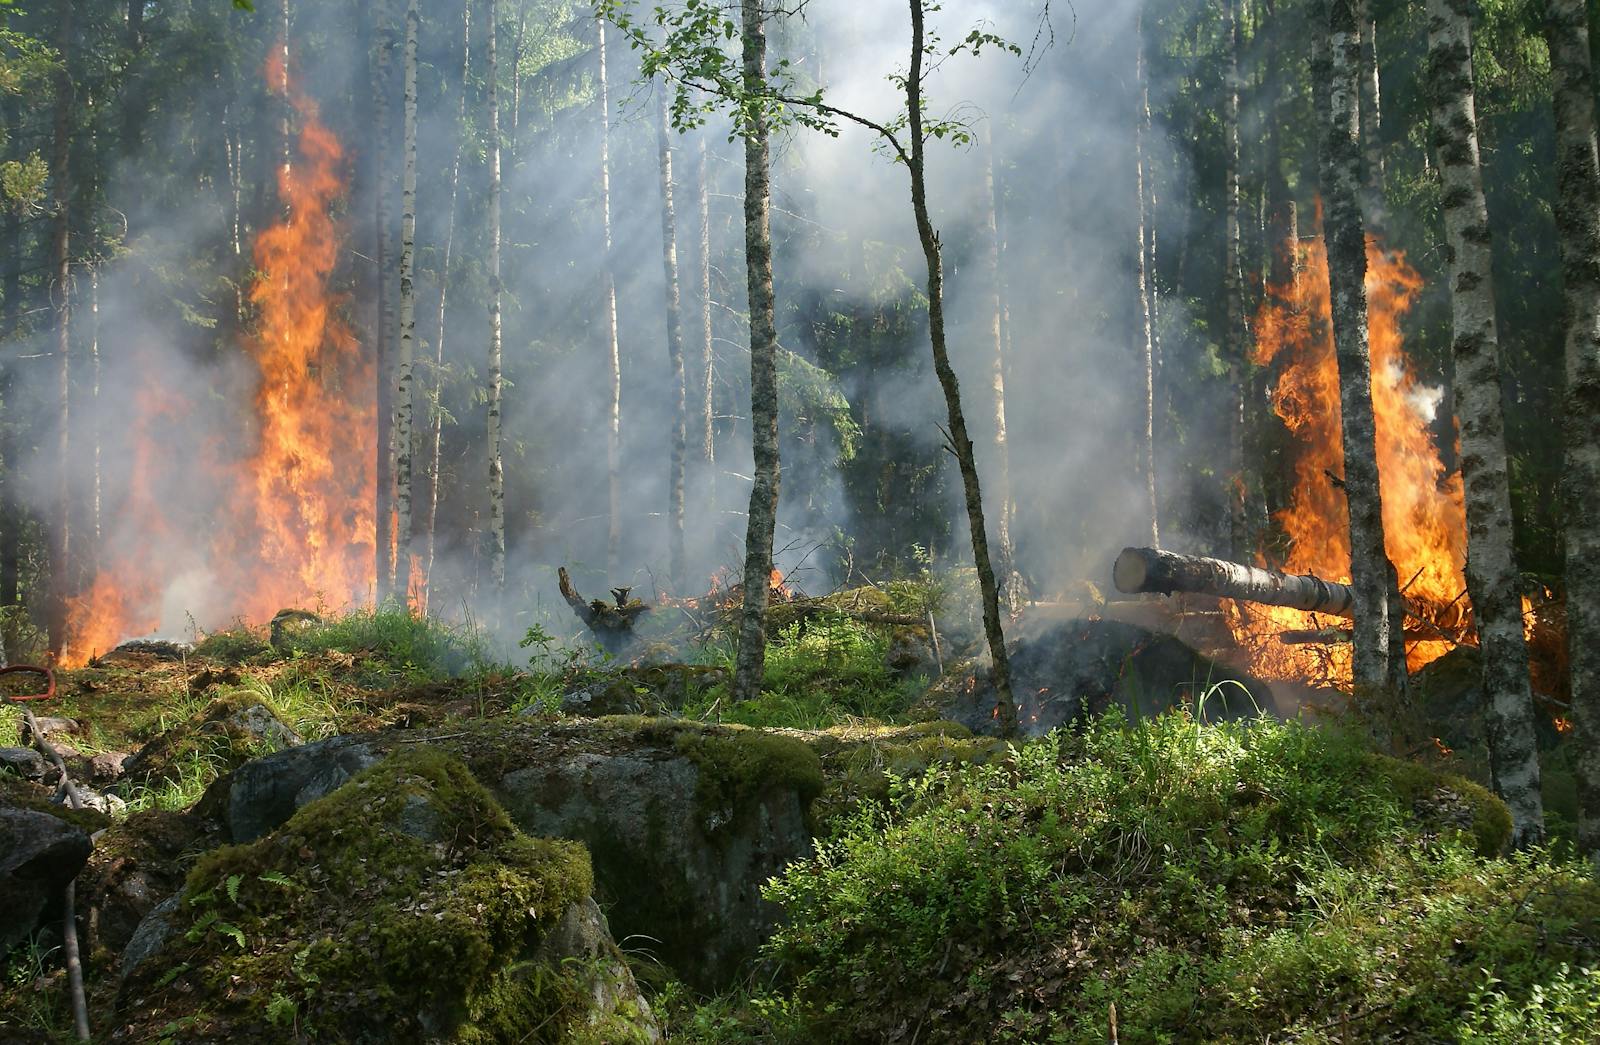
While warm, dry weather may come as a welcome respite from the cold front that swept through the central and eastern U.S. earlier this month, the unseasonable, out-of-place conditions are having dangerous impacts on air quality. Compounding with worsening ground-level ozone, increased wildfire and drought activity are also contributing to above-average particulate matter concentrations, prompting the National Weather Service to issue air quality warnings in several counties. A look at air pollutant readings, wildfire activity maps, and smoke forecasts reveals major cities through the central United States where air quality is abnormally poor right now.
To determine the cities where air quality is abnormally bad right now, Climate Crisis 247 developed an index based on station-level carbon monoxide, ozone, PM2.5, PM10, and sulfur dioxide readings from the U.S. Environmental Protection Agency. County seats were ranked based on the combined, normalized concentrations of CO, O3, PM2.5, PM10, and SO2 on October 21, 2024. Daily measurement data is from the EPA AirNow system and was aggregated from stations to counties using Voronoi tessellation. Historical normals are based on annual averages for 2019 to 2023 . Only county seats with at least 25,000 residents that overlap the National Weather Service Smoke Forecast smoke boundaries as of October 23, 2024 were included. Data is at the county level.
25. Galesburg, IL (Knox County)
- PM2.5 concentration: 12.6 µg/m³ (46.7% above normal)
- PM10 concentration: 35.2 µg/m³ (113.2% above normal)
- Ozone concentration: 53.0 ppb (23.9% above normal)
- Total population: 29,923
24. Alexandria, LA (Rapides Parish)

- PM2.5 concentration: 12.0 µg/m³ (31.1% above normal)
- PM10 concentration: 19.5 µg/m³ (74.0% above normal)
- Ozone concentration: 56.8 ppb (49.4% above normal)
- Total population: 45,133
23. Jackson, MS (Hinds County)

- PM2.5 concentration: 13.1 µg/m³ (32.3% above normal)
- PM10 concentration: 19.5 µg/m³ (74.0% above normal)
- Ozone concentration: 56.0 ppb (44.4% above normal)
- Total population: 153,271
22. St. Charles, MO (St. Charles County)

- PM2.5 concentration: 13.9 µg/m³ (80.8% above normal)
- PM10 concentration: 16.1 µg/m³ (112.3% above normal)
- Ozone concentration: 60.3 ppb (40.7% above normal)
- Total population: 70,687
21. Lafayette, LA (Lafayette Parish)
- PM2.5 concentration: 12.7 µg/m³ (59.3% above normal)
- PM10 concentration: 19.5 µg/m³ (74.0% above normal)
- Ozone concentration: 57.9 ppb (52.0% above normal)
- Total population: 121,706
20. Toms River, NJ (Ocean County)

- PM2.5 concentration: 13.9 µg/m³ (110.7% above normal)
- PM10 concentration: 20.0 µg/m³ (89.6% above normal)
- Ozone concentration: 55.8 ppb (34.7% above normal)
- Total population: 92,827
19. Birmingham, AL (Jefferson County)

- PM2.5 concentration: 14.3 µg/m³ (58.6% above normal)
- PM10 concentration: 22.5 µg/m³ (73.0% above normal)
- Ozone concentration: 51.1 ppb (25.2% above normal)
- Total population: 200,431
18. Corsicana, TX (Navarro County)

- PM2.5 concentration: 10.0 µg/m³ (16.1% above normal)
- PM10 concentration: 23.1 µg/m³ (24.3% above normal)
- Ozone concentration: 63.2 ppb (50.9% above normal)
- Total population: 25,107
17. Oklahoma City, OK (Oklahoma County)

- PM2.5 concentration: 10.2 µg/m³ (4.8% above normal)
- PM10 concentration: 21.8 µg/m³ (69.8% above normal)
- Ozone concentration: 65.1 ppb (42.9% above normal)
- Total population: 681,088
16. Brandon, MS (Rankin County)

- PM2.5 concentration: 15.9 µg/m³ (55.5% above normal)
- PM10 concentration: 19.5 µg/m³ (74.0% above normal)
- Ozone concentration: 56.0 ppb (44.4% above normal)
- Total population: 25,142
15. Rock Island, IL (Rock Island County)

- PM2.5 concentration: 11.2 µg/m³ (25.0% above normal)
- PM10 concentration: 35.2 µg/m³ (113.2% above normal)
- Ozone concentration: 57.5 ppb (44.8% above normal)
- Total population: 37,264
14. Conway, AR (Faulkner County)

- PM2.5 concentration: 21.8 µg/m³ (125.5% above normal)
- PM10 concentration: 14.3 µg/m³ (102.9% above normal)
- Ozone concentration: 56.0 ppb (41.4% above normal)
- Total population: 65,159
13. Pine Bluff, AR (Jefferson County)

- PM2.5 concentration: 16.9 µg/m³ (69.7% above normal)
- PM10 concentration: 19.4 µg/m³ (75.6% above normal)
- Ozone concentration: 55.6 ppb (40.0% above normal)
- Total population: 41,172
12. Davenport, IA (Scott County)

- PM2.5 concentration: 12.0 µg/m³ (28.3% above normal)
- PM10 concentration: 35.2 µg/m³ (113.2% above normal)
- Ozone concentration: 58.3 ppb (49.0% above normal)
- Total population: 101,448
11. Little Rock, AR (Pulaski County)

- PM2.5 concentration: 19.4 µg/m³ (98.0% above normal)
- PM10 concentration: 15.5 µg/m³ (89.0% above normal)
- Ozone concentration: 56.0 ppb (41.4% above normal)
- Total population: 202,218
10. Shawnee, OK (Pottawatomie County)

- PM2.5 concentration: 11.2 µg/m³ (13.4% above normal)
- PM10 concentration: 21.8 µg/m³ (90.3% above normal)
- Ozone concentration: 67.0 ppb (49.5% above normal)
- Total population: 31,391
9. Houston, TX (Harris County)

- PM2.5 concentration: 11.9 µg/m³ (22.4% above normal)
- PM10 concentration: 23.1 µg/m³ (21.4% above normal)
- Ozone concentration: 65.8 ppb (78.6% above normal)
- Total population: 2,296,253
8. Bryan, TX (Brazos County)

- PM2.5 concentration: N/A
- PM10 concentration: 23.1 µg/m³ (21.4% above normal)
- Ozone concentration: 79.6 ppb (104.2% above normal)
- Total population: 84,820
7. Norman, OK (Cleveland County)

- PM2.5 concentration: 11.4 µg/m³ (15.3% above normal)
- PM10 concentration: N/A
- Ozone concentration: 65.6 ppb (45.3% above normal)
- Total population: 127,701
6. Decatur, IL (Macon County)
- PM2.5 concentration: 13.5 µg/m³ (53.5% above normal)
- PM10 concentration: 30.1 µg/m³ (278.4% above normal)
- Ozone concentration: 53.0 ppb (22.6% above normal)
- Total population: 70,975
5. Huntsville, TX (Walker County)

- PM2.5 concentration: 12.0 µg/m³ (20.2% above normal)
- PM10 concentration: 23.1 µg/m³ (21.4% above normal)
- Ozone concentration: 74.0 ppb (80.2% above normal)
- Total population: 46,202
4. Springfield, IL (Sangamon County)

- PM2.5 concentration: 12.8 µg/m³ (57.4% above normal)
- PM10 concentration: 30.1 µg/m³ (278.4% above normal)
- Ozone concentration: 56.2 ppb (32.1% above normal)
- Total population: 114,214
3. Conroe, TX (Montgomery County)

- PM2.5 concentration: 12.2 µg/m³ (22.5% above normal)
- PM10 concentration: 23.1 µg/m³ (21.4% above normal)
- Ozone concentration: 75.4 ppb (87.3% above normal)
- Total population: 92,475
2. Belleville, IL (St. Clair County)

- PM2.5 concentration: 13.9 µg/m³ (60.2% above normal)
- PM10 concentration: 29.9 µg/m³ (275.1% above normal)
- Ozone concentration: 58.0 ppb (34.7% above normal)
- Total population: 42,155
1. Edwardsville, IL (Madison County)
- PM2.5 concentration: 20.3 µg/m³ (126.7% above normal)
- PM10 concentration: 29.8 µg/m³ (273.6% above normal)
- Ozone concentration: 61.6 ppb (41.9% above normal)
- Total population: 26,622