
Miami and LA Lead These Other Regions For the Greatest Risk of Power Outage As Demand Soars
 https://climate-crisis-247-bucket.nyc3.cdn.digitaloceanspaces.com/wp-content/uploads/2025/09/07202019/County-Level-Power-System-Vulnerability-Index-Scores-150x150.png
Demand for electricity is surging in the United States. Data centers, artificial intelligence, mass electrification of vehicles and buildings, and resurgent domestic manufacturing are placing unprecedented demand on the U.S. electric grid, straining already-stressed systems and raising the risk of blackouts in populated areas.
Hot property? From Maui to Malibu, These Affluent Enclaves Are Becoming Wildfire Hotspots
Whence the next pandemic? Cities Where the Next Pandemic Is Most Likely to Break Out
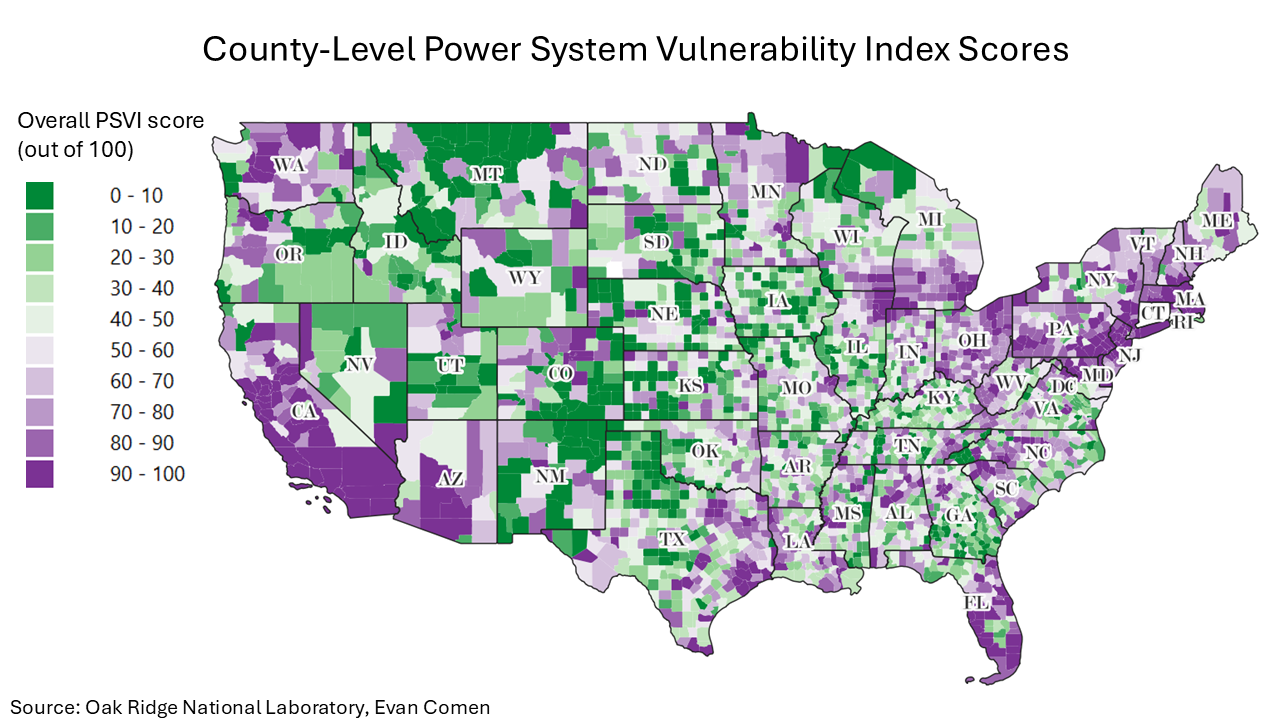
In a recent paper, researchers at Texas A&M University and Oak Ridge National Laboratory measured power system vulnerability at the county level. Measuring outage frequency, intensity, and duration, researchers developed the Power System Vulnerability Index, ranking more than 3,000 counties based on historical data. While many Rust Belt counties – where aging infrastructure reduces grid reliability – rank high, the counties with the worst PSVI scores are in disaster-prone areas like Florida and California, where wildfires and hurricanes frequently prompt power outages. A closer look at the data reveals the counties with the greatest power vulnerability.
To determine the counties with the greatest risk of power system failure, Climate Crisis 247 reviewed data from Texas A&M University and Oak Ridge National Laboratory. Counties were ranked by Power System Vulnerability Index Score, based on data from 2014 to 2023. Supplemental data on the percentage of Medicare beneficiaries using electricity dependent durable medical and assistive equipment are from the U.S. Department of Health & Human Service.
25. Mecklenburg County, NC

- Overall PSVI score: 99.2/100
- Average annual customer-hours of power outage: 2.0 per resident
- Medicare beneficiaries using electricity dependent DME: 3.6%
- Total population: 1,130,906
- County seat: Charlotte
24. Dallas County, TX

- Overall PSVI score: 99.2/100
- Average annual customer-hours of power outage: 3.6 per resident
- Medicare beneficiaries using electricity dependent DME: 3.7%
- Total population: 2,603,816
- County seat: Dallas
23. Sonoma County, CA

- Overall PSVI score: 99.3/100
- Average annual customer-hours of power outage: 3.6 per resident
- Medicare beneficiaries using electricity dependent DME: 3.0%
- Total population: 485,642
- County seat: Santa Rosa
22. Maricopa County, AZ

- Overall PSVI score: 99.3/100
- Average annual customer-hours of power outage: 0.7 per resident
- Medicare beneficiaries using electricity dependent DME: 4.0%
- Total population: 4,491,987
- County seat: Phoenix
21. Ventura County, CA
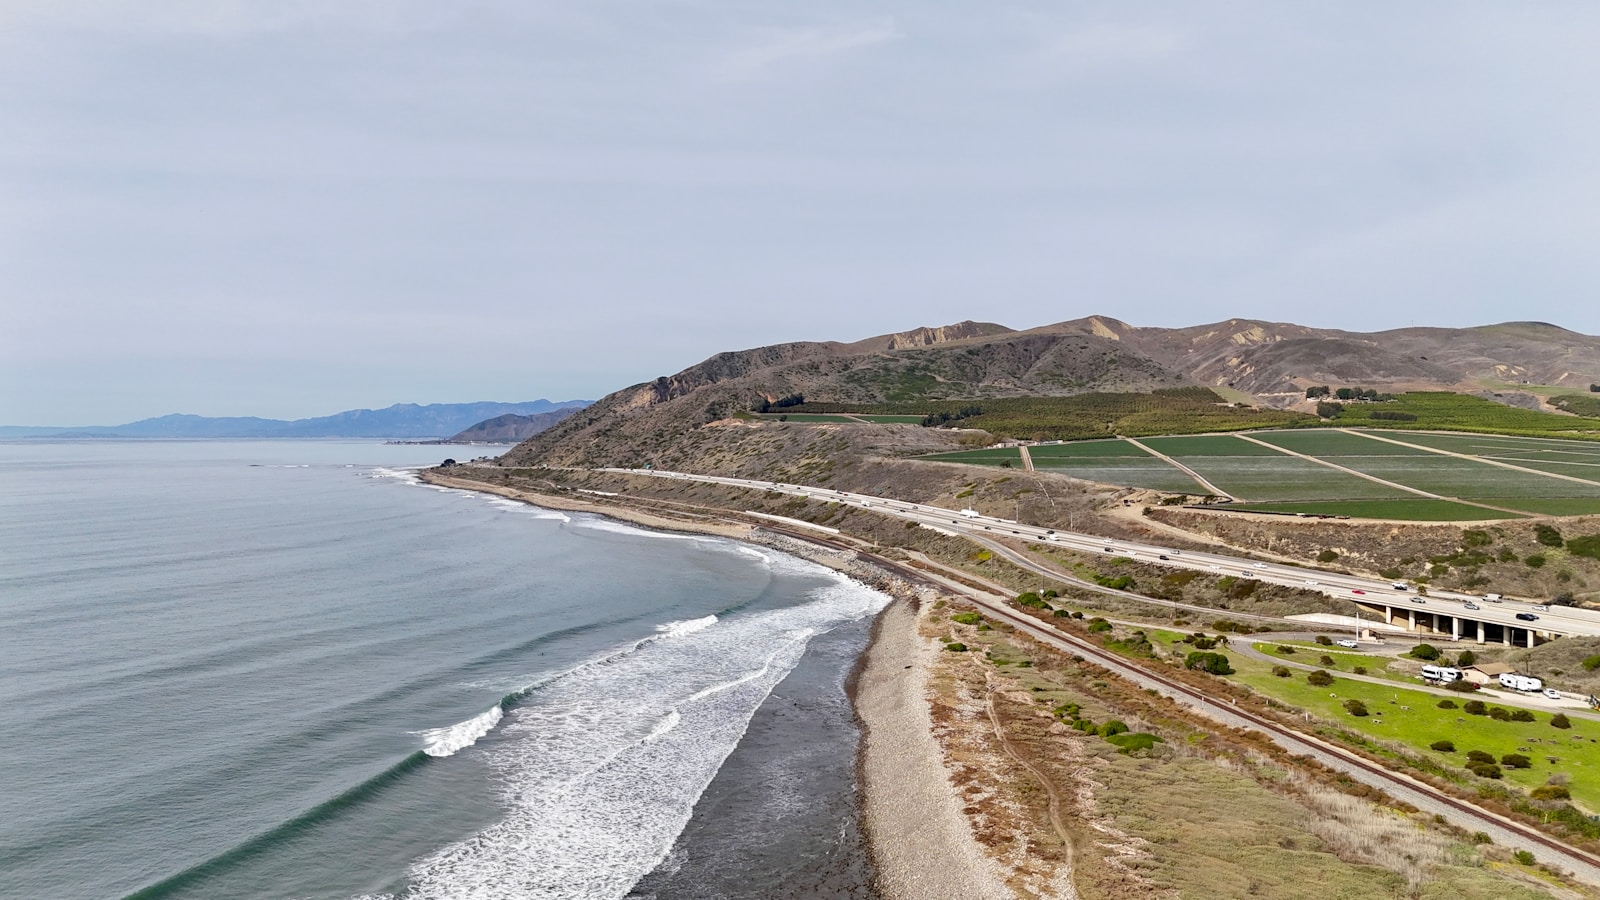
- Overall PSVI score: 99.3/100
- Average annual customer-hours of power outage: 3.1 per resident
- Medicare beneficiaries using electricity dependent DME: 3.4%
- Total population: 838,259
- County seat: Ventura
20. King County, WA

- Overall PSVI score: 99.4/100
- Average annual customer-hours of power outage: 2.6 per resident
- Medicare beneficiaries using electricity dependent DME: 2.5%
- Total population: 2,262,713
- County seat: Seattle
19. Franklin County, OH

- Overall PSVI score: 99.4/100
- Average annual customer-hours of power outage: 2.2 per resident
- Medicare beneficiaries using electricity dependent DME: 4.6%
- Total population: 1,321,635
- County seat: Columbus
18. Santa Clara County, CA

- Overall PSVI score: 99.4/100
- Average annual customer-hours of power outage: 2.6 per resident
- Medicare beneficiaries using electricity dependent DME: 2.7%
- Total population: 1,903,297
- County seat: San Jose
17. Hillsborough County, FL

- Overall PSVI score: 99.5/100
- Average annual customer-hours of power outage: 2.6 per resident
- Medicare beneficiaries using electricity dependent DME: 4.3%
- Total population: 1,489,634
- County seat: Tampa
16. Shelby County, TN

- Overall PSVI score: 99.5/100
- Average annual customer-hours of power outage: 13.4 per resident
- Medicare beneficiaries using electricity dependent DME: 4.2%
- Total population: 922,195
- County seat: Memphis
15. Palm Beach County, FL

- Overall PSVI score: 99.5/100
- Average annual customer-hours of power outage: 1.1 per resident
- Medicare beneficiaries using electricity dependent DME: 2.8%
- Total population: 1,507,453
- County seat: West Palm Beach
14. San Diego County, CA

- Overall PSVI score: 99.6/100
- Average annual customer-hours of power outage: 1.1 per resident
- Medicare beneficiaries using electricity dependent DME: 2.8%
- Total population: 3,282,782
- County seat: San Diego
13. Duval County, FL
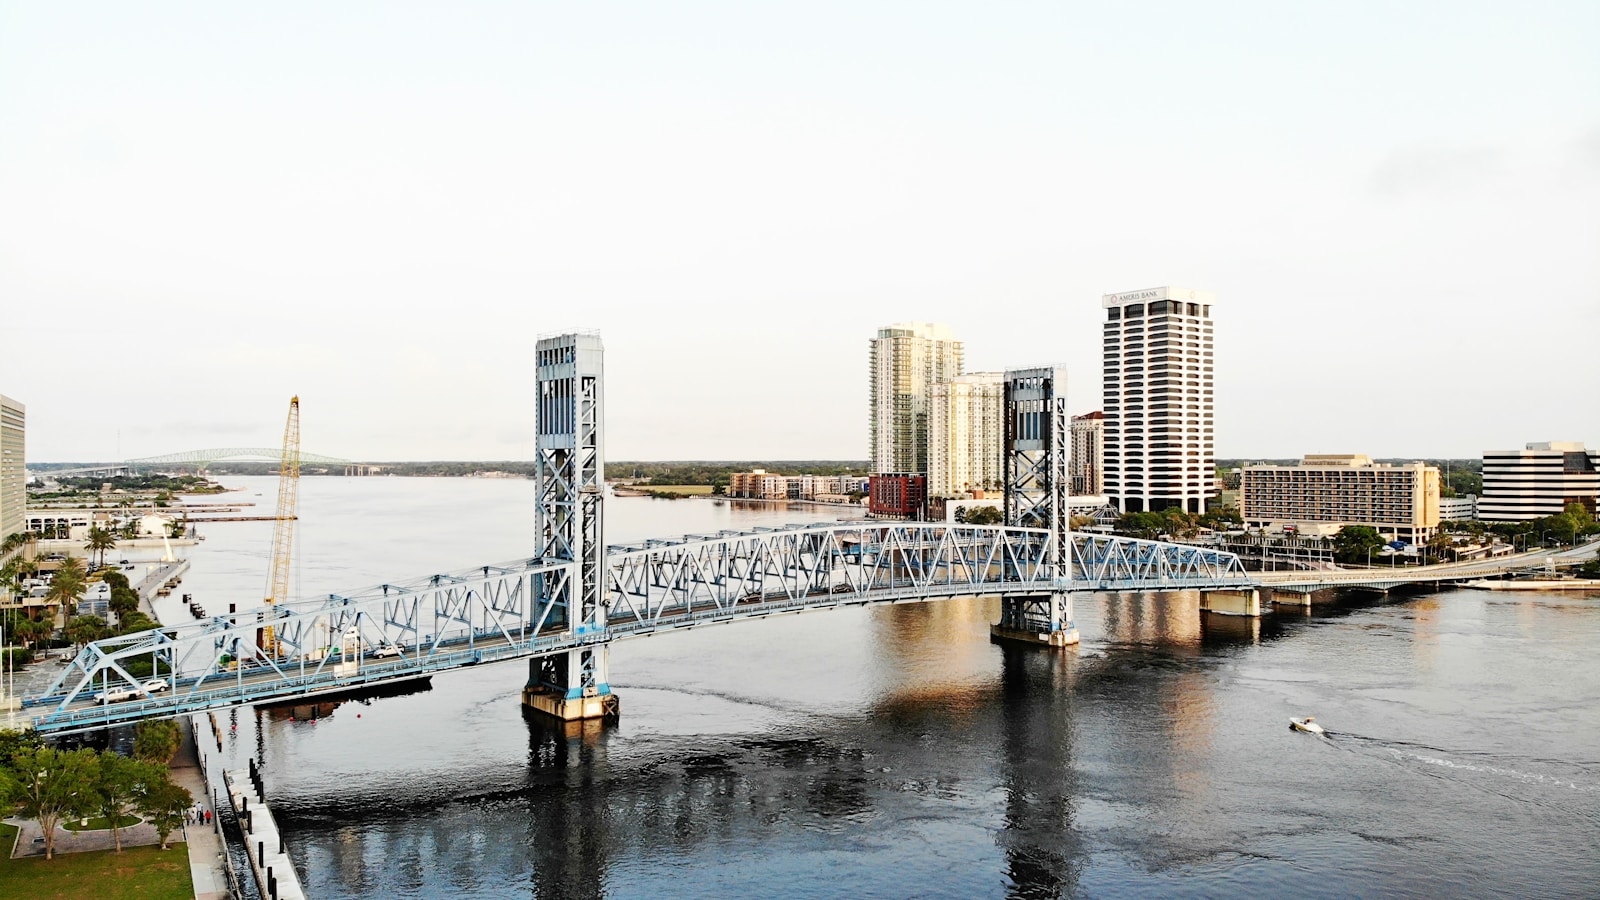
- Overall PSVI score: 99.6/100
- Average annual customer-hours of power outage: 1.0 per resident
- Medicare beneficiaries using electricity dependent DME: 4.6%
- Total population: 1,007,189
- County seat: Jacksonville
12. Oakland County, MI

- Overall PSVI score: 99.6/100
- Average annual customer-hours of power outage: 13.8 per resident
- Medicare beneficiaries using electricity dependent DME: 4.0%
- Total population: 1,272,294
- County seat: Pontiac
11. Riverside County, CA

- Overall PSVI score: 99.7/100
- Average annual customer-hours of power outage: 1.6 per resident
- Medicare beneficiaries using electricity dependent DME: 4.8%
- Total population: 2,449,909
- County seat: Riverside
10. Orange County, CA
- Overall PSVI score: 99.7/100
- Average annual customer-hours of power outage: 1.1 per resident
- Medicare beneficiaries using electricity dependent DME: 3.0%
- Total population: 3,164,063
- County seat: Santa Ana
9. San Bernardino County, CA

- Overall PSVI score: 99.7/100
- Average annual customer-hours of power outage: 2.4 per resident
- Medicare beneficiaries using electricity dependent DME: 5.2%
- Total population: 2,187,816
- County seat: San Bernardino
8. Broward County, FL
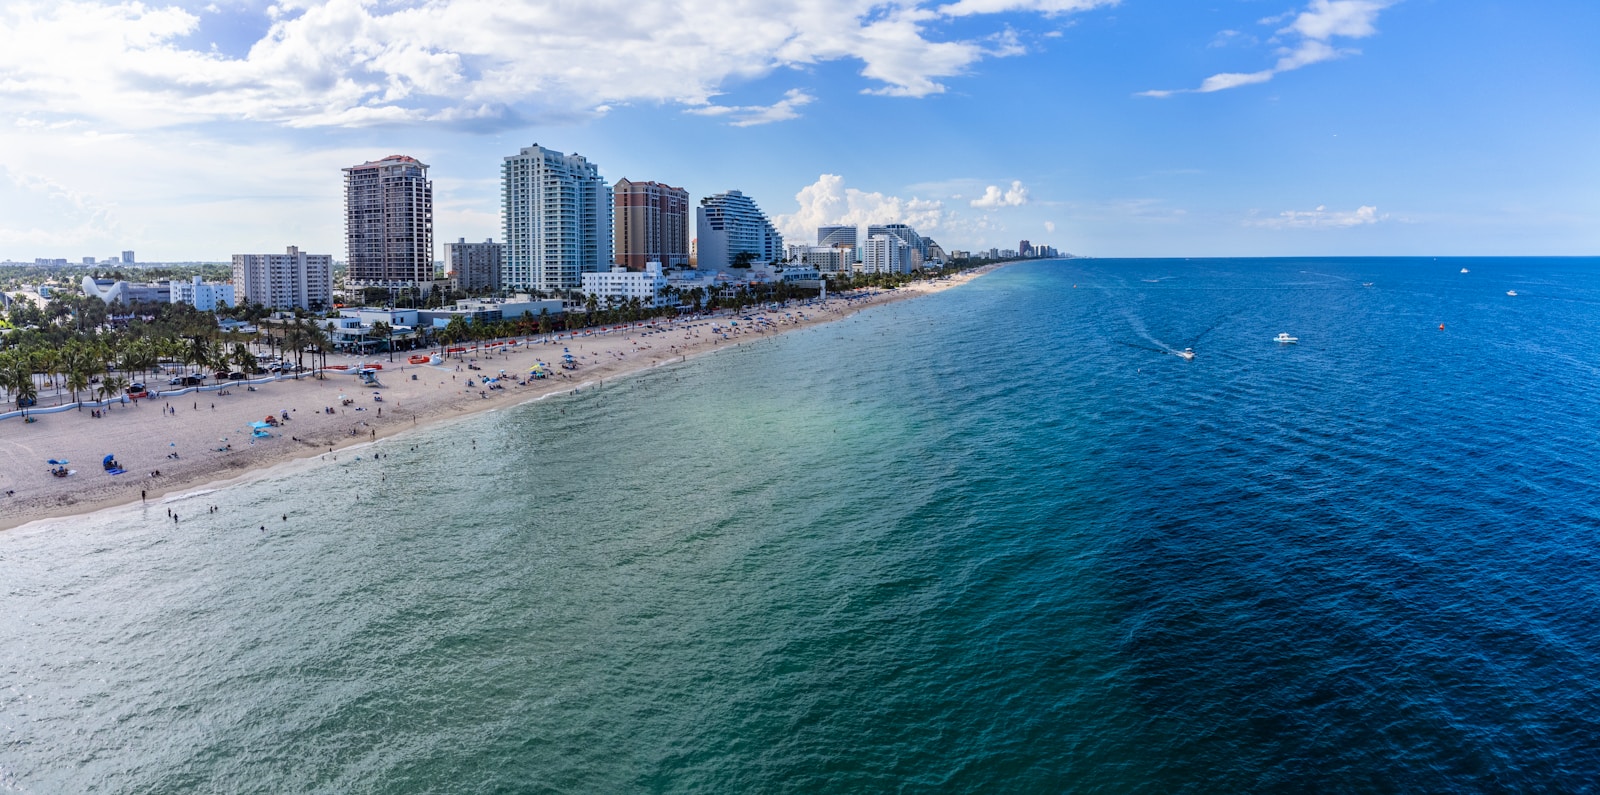
- Overall PSVI score: 99.8/100
- Average annual customer-hours of power outage: 1.0 per resident
- Medicare beneficiaries using electricity dependent DME: 3.3%
- Total population: 1,946,127
- County seat: Fort Lauderdale
7. Harris County, TX

- Overall PSVI score: 99.8/100
- Average annual customer-hours of power outage: 2.2 per resident
- Medicare beneficiaries using electricity dependent DME: 3.7%
- Total population: 4,758,579
- County seat: Houston
6. Wayne County, MI

- Overall PSVI score: 99.8/100
- Average annual customer-hours of power outage: 16.0 per resident
- Medicare beneficiaries using electricity dependent DME: 4.7%
- Total population: 1,773,767
- County seat: Detroit
5. Buena Vista city, VA
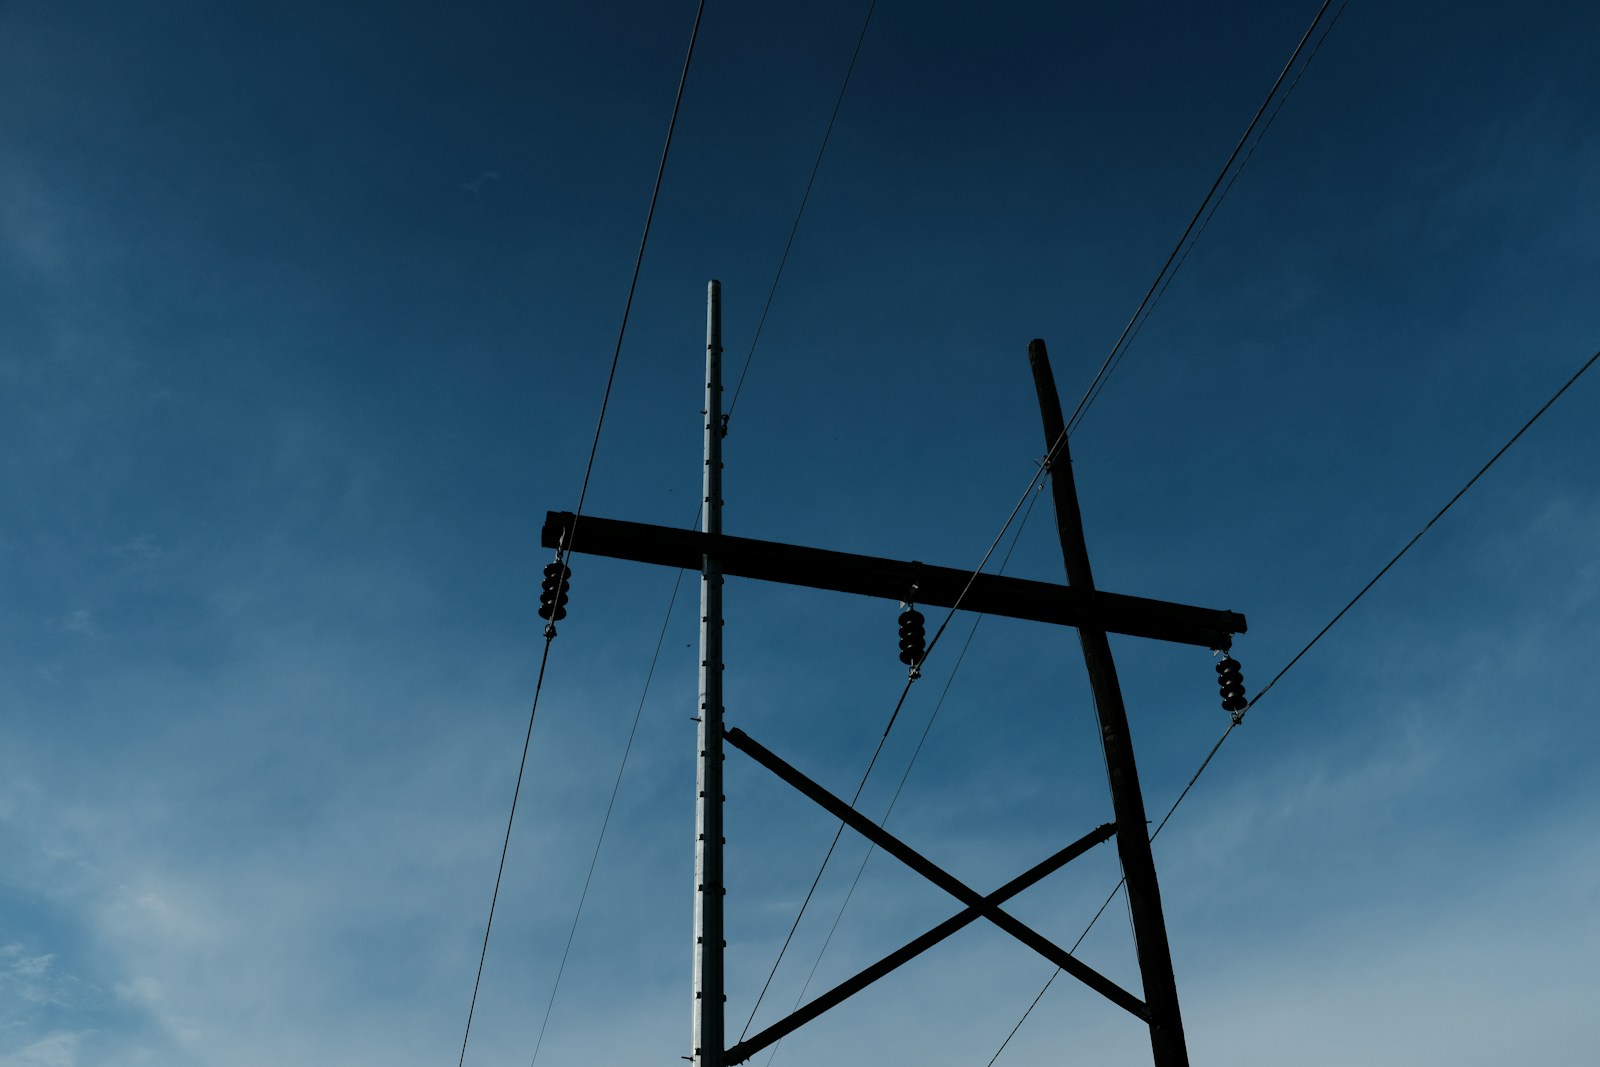
- Overall PSVI score: 99.9/100
- Average annual customer-hours of power outage: 1.2 per resident
- Medicare beneficiaries using electricity dependent DME: 6.4%
- Total population: 6,612
- County seat: Buena Vista
4. Niobrara County, WY
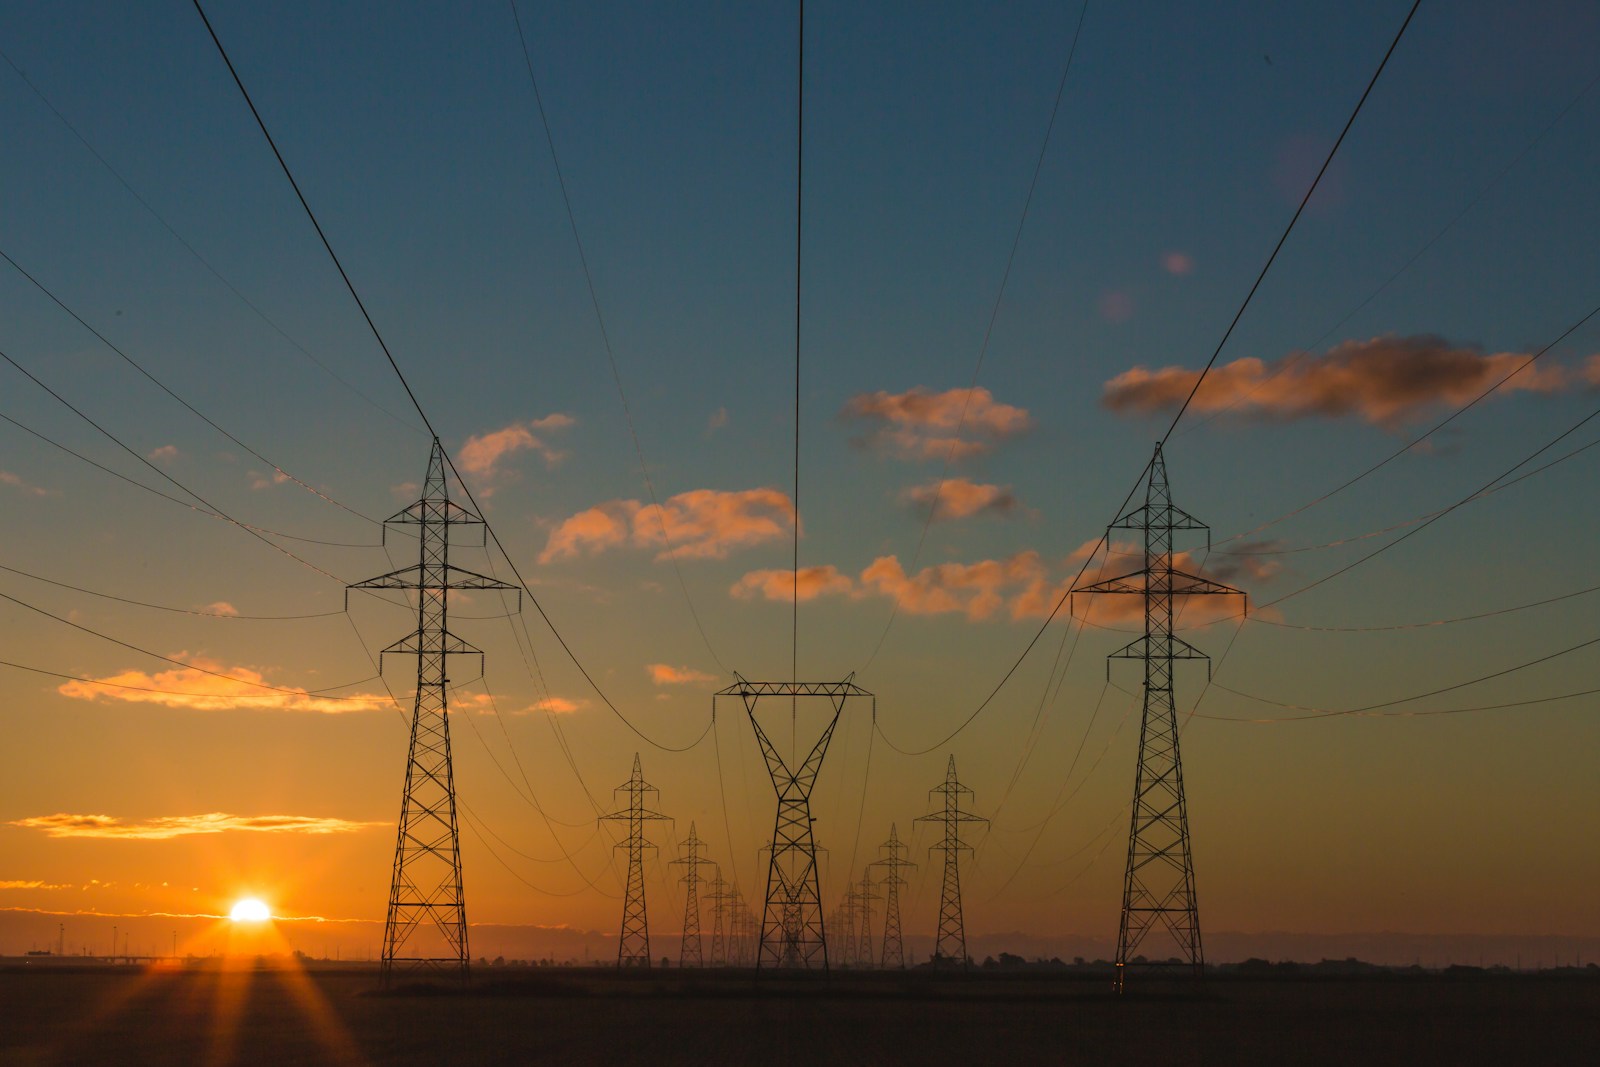
- Overall PSVI score: 99.9/100
- Average annual customer-hours of power outage: 0.0 per resident
- Medicare beneficiaries using electricity dependent DME: 15.4%
- Total population: 2,415
- County seat: Lusk
3. Waynesboro city, VA

- Overall PSVI score: 99.9/100
- Average annual customer-hours of power outage: 1.1 per resident
- Medicare beneficiaries using electricity dependent DME: 5.1%
- Total population: 22,574
- County seat: Waynesboro
2. Miami-Dade County, FL

- Overall PSVI score: 100.0/100
- Average annual customer-hours of power outage: 1.2 per resident
- Medicare beneficiaries using electricity dependent DME: 3.8%
- Total population: 2,685,296
- County seat: Miami
1. Los Angeles County, CA

- Overall PSVI score: 100.0/100
- Average annual customer-hours of power outage: 1.6 per resident
- Medicare beneficiaries using electricity dependent DME: 3.3%
- Total population: 9,848,406
- County seat: Los Angeles