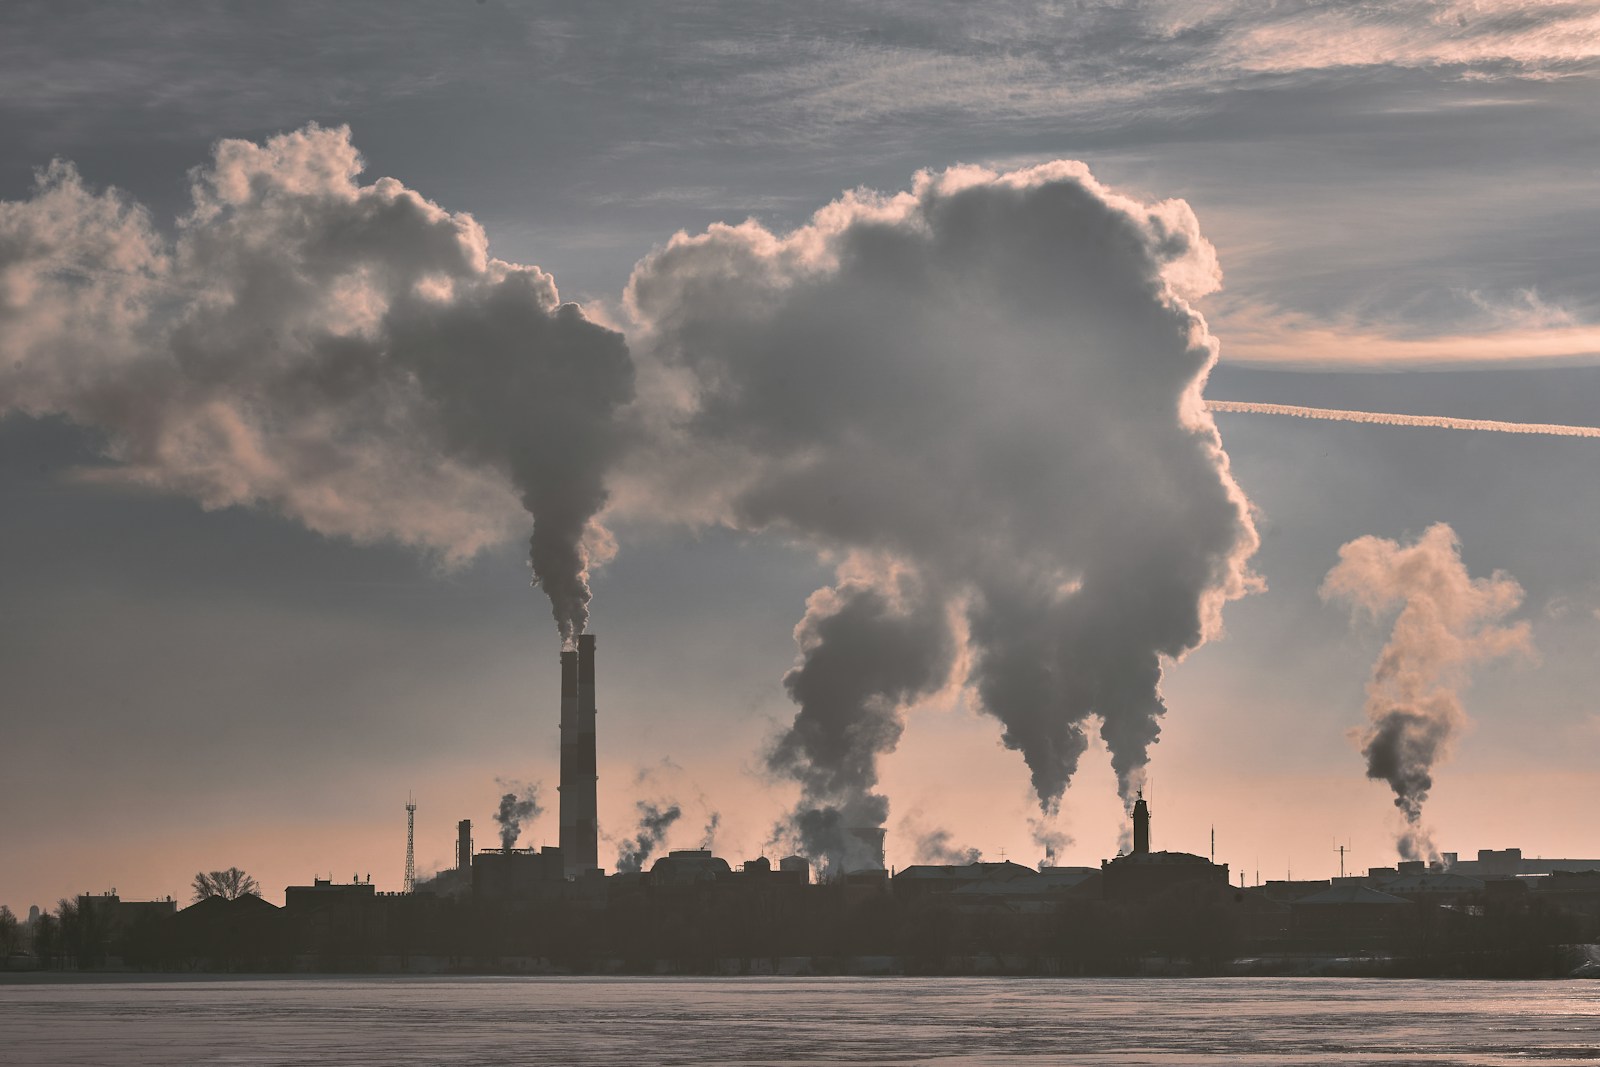
Being Poor in These Cities Means Far Greater Exposure to Air Pollution
 https://climate-crisis-247-bucket.nyc3.digitaloceanspaces.com/wp-content/uploads/2025/09/07203122/w3y2crfkvis-150x150.jpg
While air quality is typically measured at the city or county level, new tract-level data published by researchers at Harvard University and Boston University gives a more granular look at how air quality varies from neighborhood to neighborhood. Data shows that some residents of the same cities are far more exposed to air pollution than others, the difference equating to dozens of cigarettes smoked per year.
Hot property? From Maui to Malibu, These Affluent Enclaves Are Becoming Wildfire Hotspots
Whence the next pandemic? Cities Where the Next Pandemic Is Most Likely to Break Out
In almost every major city, poor communities – where congested highways, factories, and lack of green space drive pollution – face greater exposure to harmful fine particulate matter than wealthy neighborhoods. While some cities take efforts to reduce disparities in exposure through regulation and targeted investment, in a handful of cities inequities are stark, with an increase in income having a direct effect on pollution exposure. A closer look at the data reveals the cities where being poor could have the greatest effect on respiratory health.
To determine the cities with the worst air inequality, Climate Crisis 247 reviewed tract-level data on income and annual PM2.5 concentrations. Cities were ranked based on the inferred effect of an additional $10,000 in household income on PM2.5 exposure, measured as the slope between median household income and average annual PM2.5 concentration. Data on median household income is from the Census Bureau’s 2022 American Community Survey, while data on PM2.5 by census tract is from the Harvard Dataverse and is based on readings from 2019. Only cities with at least 50 overlapping tracts where the regression coefficient between income and PM2.5 was below -0.5 were considered. Annual PM2.5 concentrations were expressed in cigarettes smoked using a conversion factor of 22 µg/m3 per cigarette, based on a methodology developed in 2015 by researchers at Berkeley Earth.
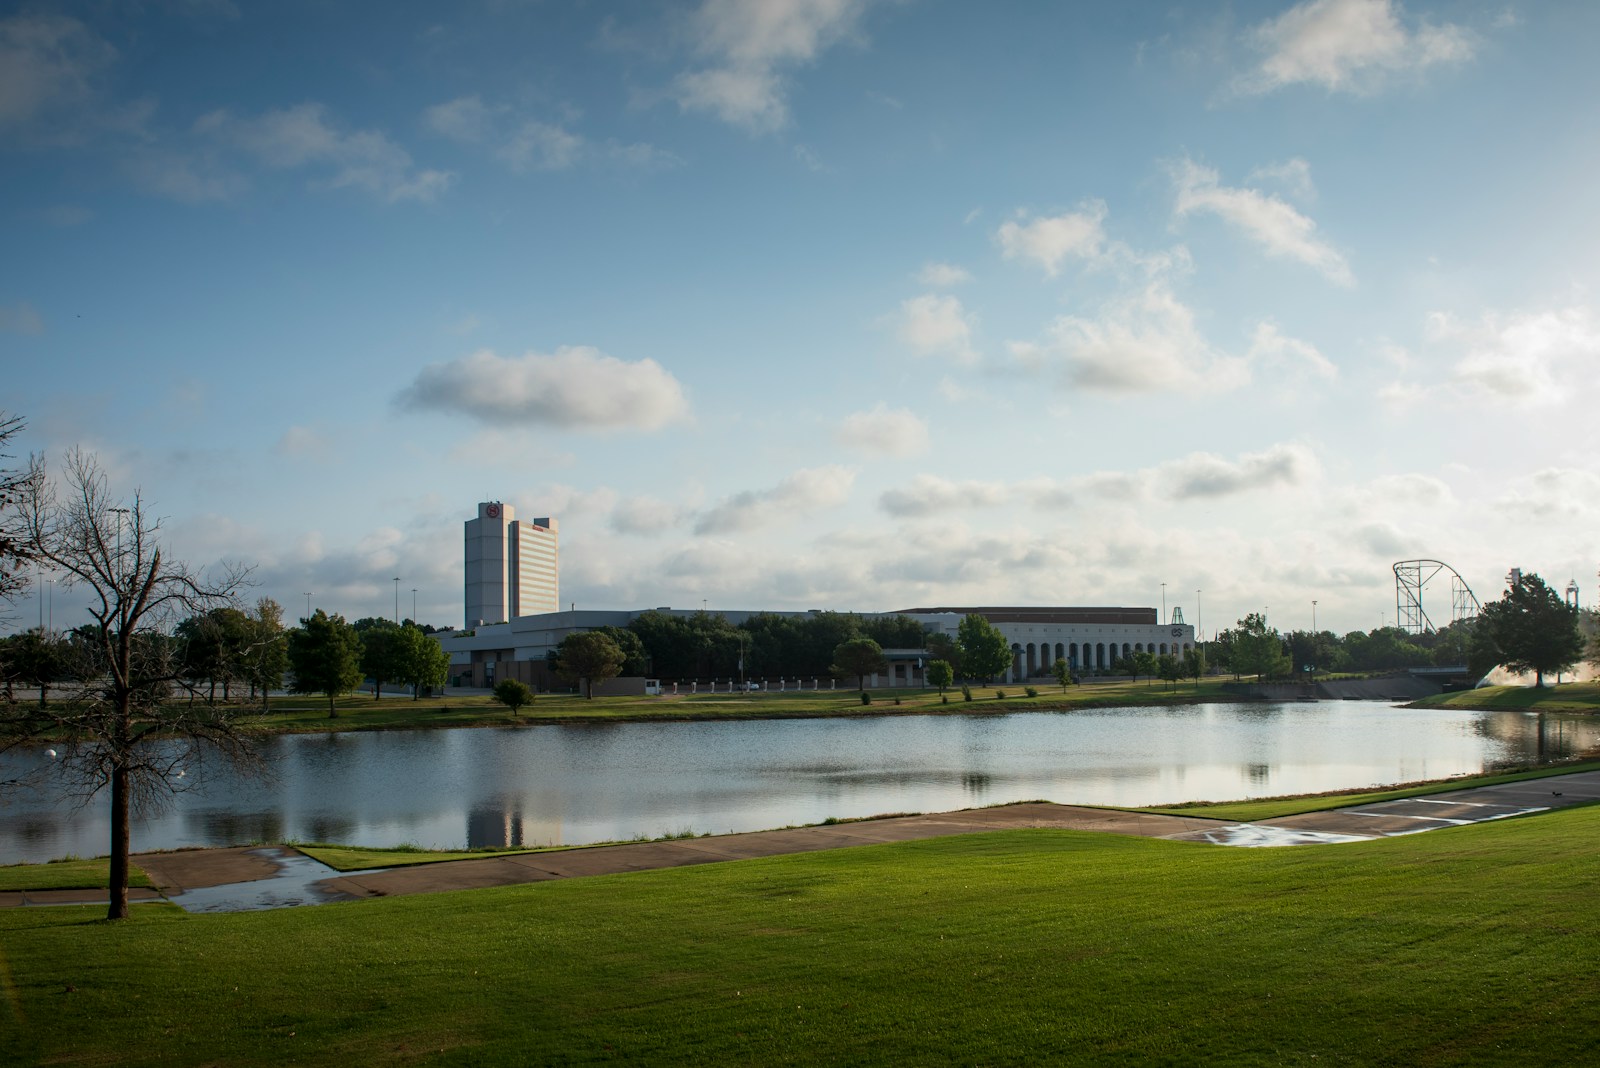
25. Oklahoma City, OK
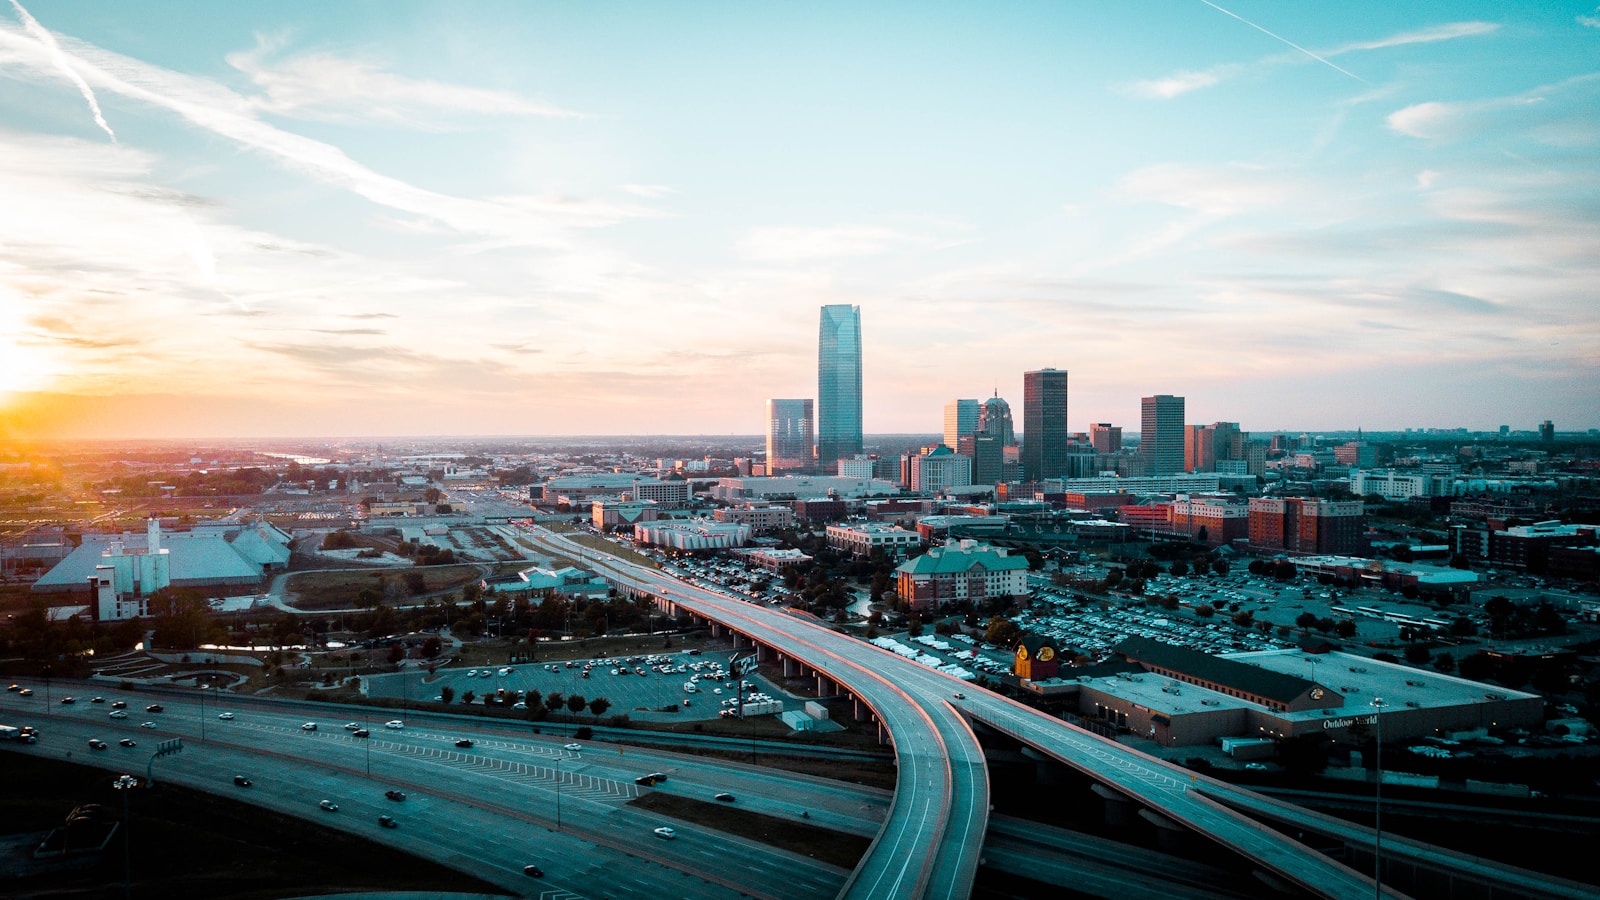
- Effect of -$10,000 income on PM2.5 concentration: +0.04 µg/m3 (+0.62 cigarettes a year)
- Average annual PM2.5 concentration: 4.18 µg/m3
- Median household income: $64,251
- Poverty rate: 15.0%
24. Sacramento, CA
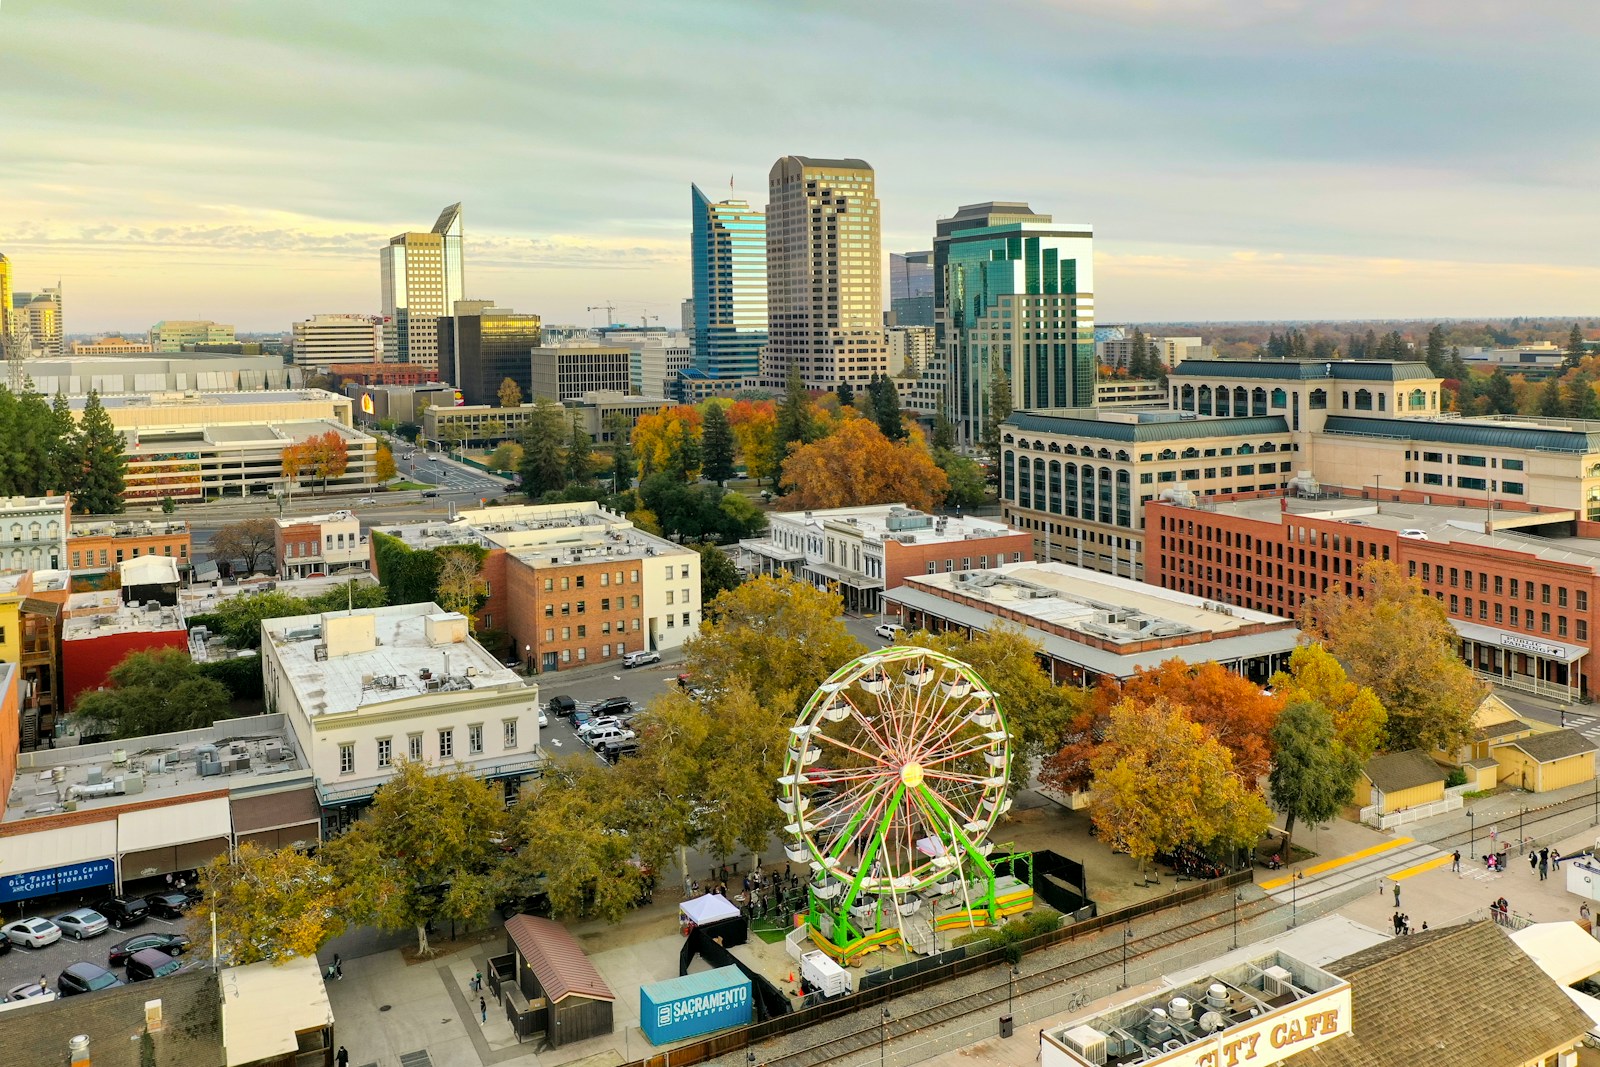
- Effect of -$10,000 income on PM2.5 concentration: +0.04 µg/m3 (+0.62 cigarettes a year)
- Average annual PM2.5 concentration: 4.25 µg/m3
- Median household income: $78,954
- Poverty rate: 14.8%
23. Louisville, KY
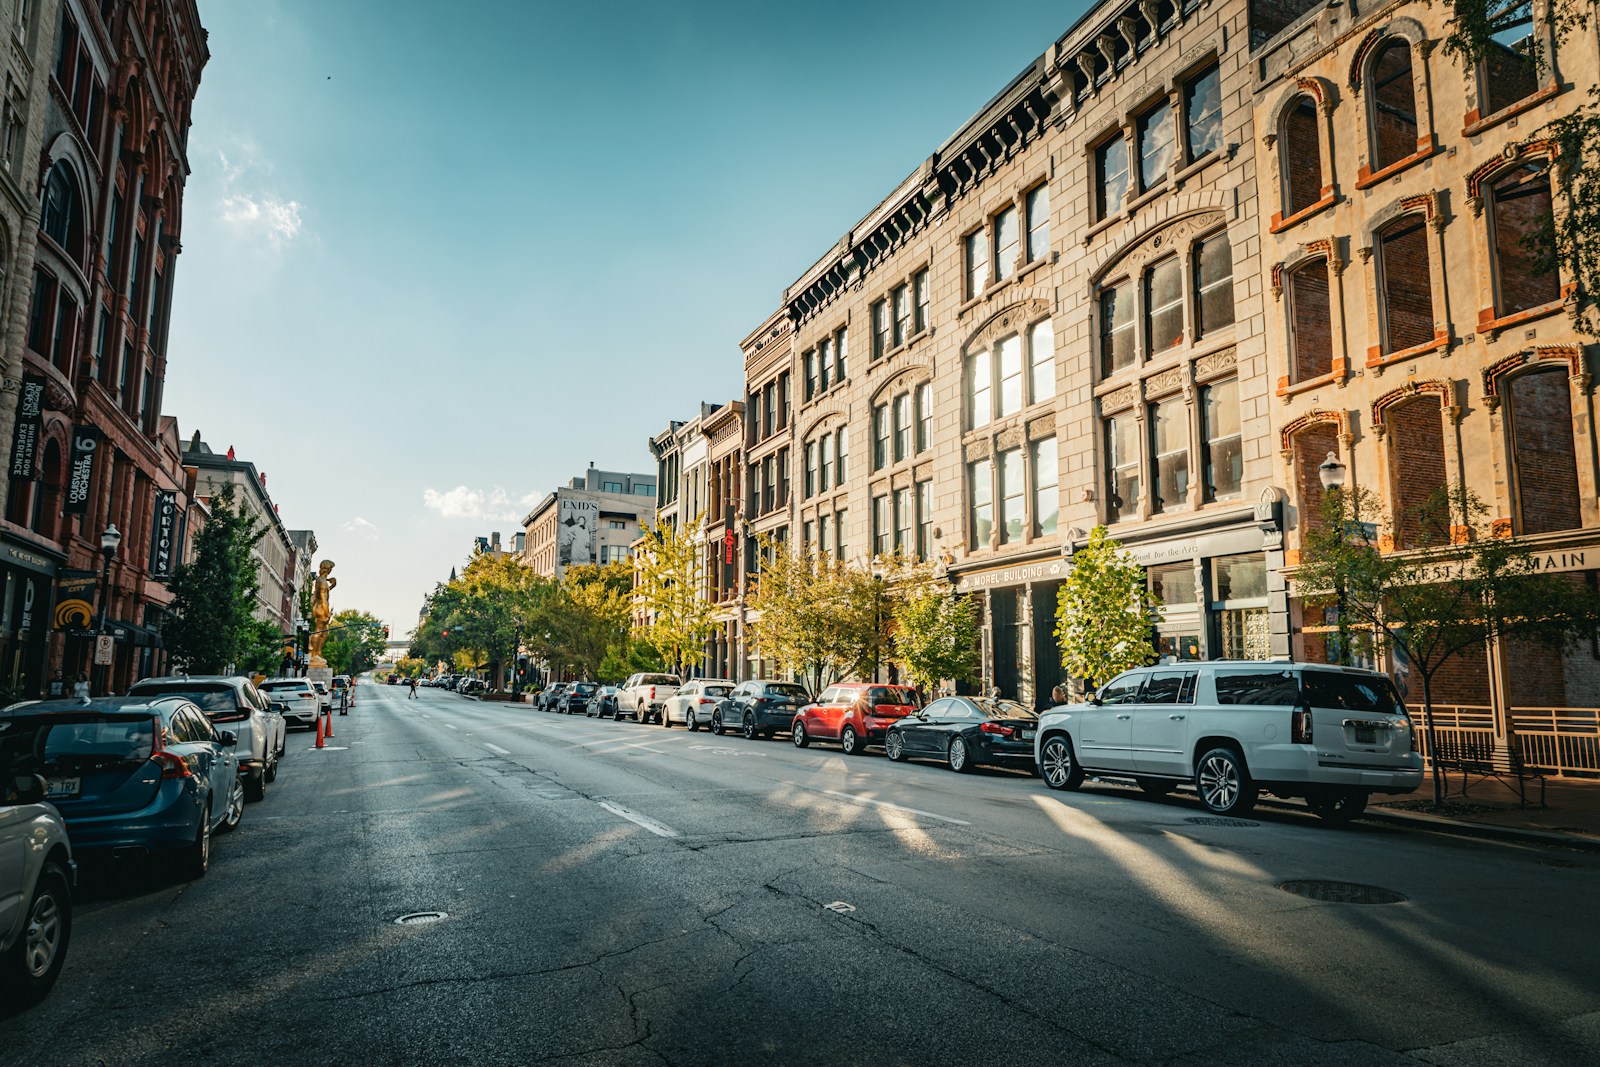
- Effect of -$10,000 income on PM2.5 concentration: +0.04 µg/m3 (+0.65 cigarettes a year)
- Average annual PM2.5 concentration: 4.57 µg/m3
- Median household income: $63,114
- Poverty rate: 15.6%
22. Arlington, TX
- Effect of -$10,000 income on PM2.5 concentration: +0.04 µg/m3 (+0.66 cigarettes a year)
- Average annual PM2.5 concentration: 4.88 µg/m3
- Median household income: $71,736
- Poverty rate: 13.0%
21. Lincoln, NE
- Effect of -$10,000 income on PM2.5 concentration: +0.04 µg/m3 (+0.66 cigarettes a year)
- Average annual PM2.5 concentration: 4.25 µg/m3
- Median household income: $67,846
- Poverty rate: 12.8%
20. San Antonio, TX
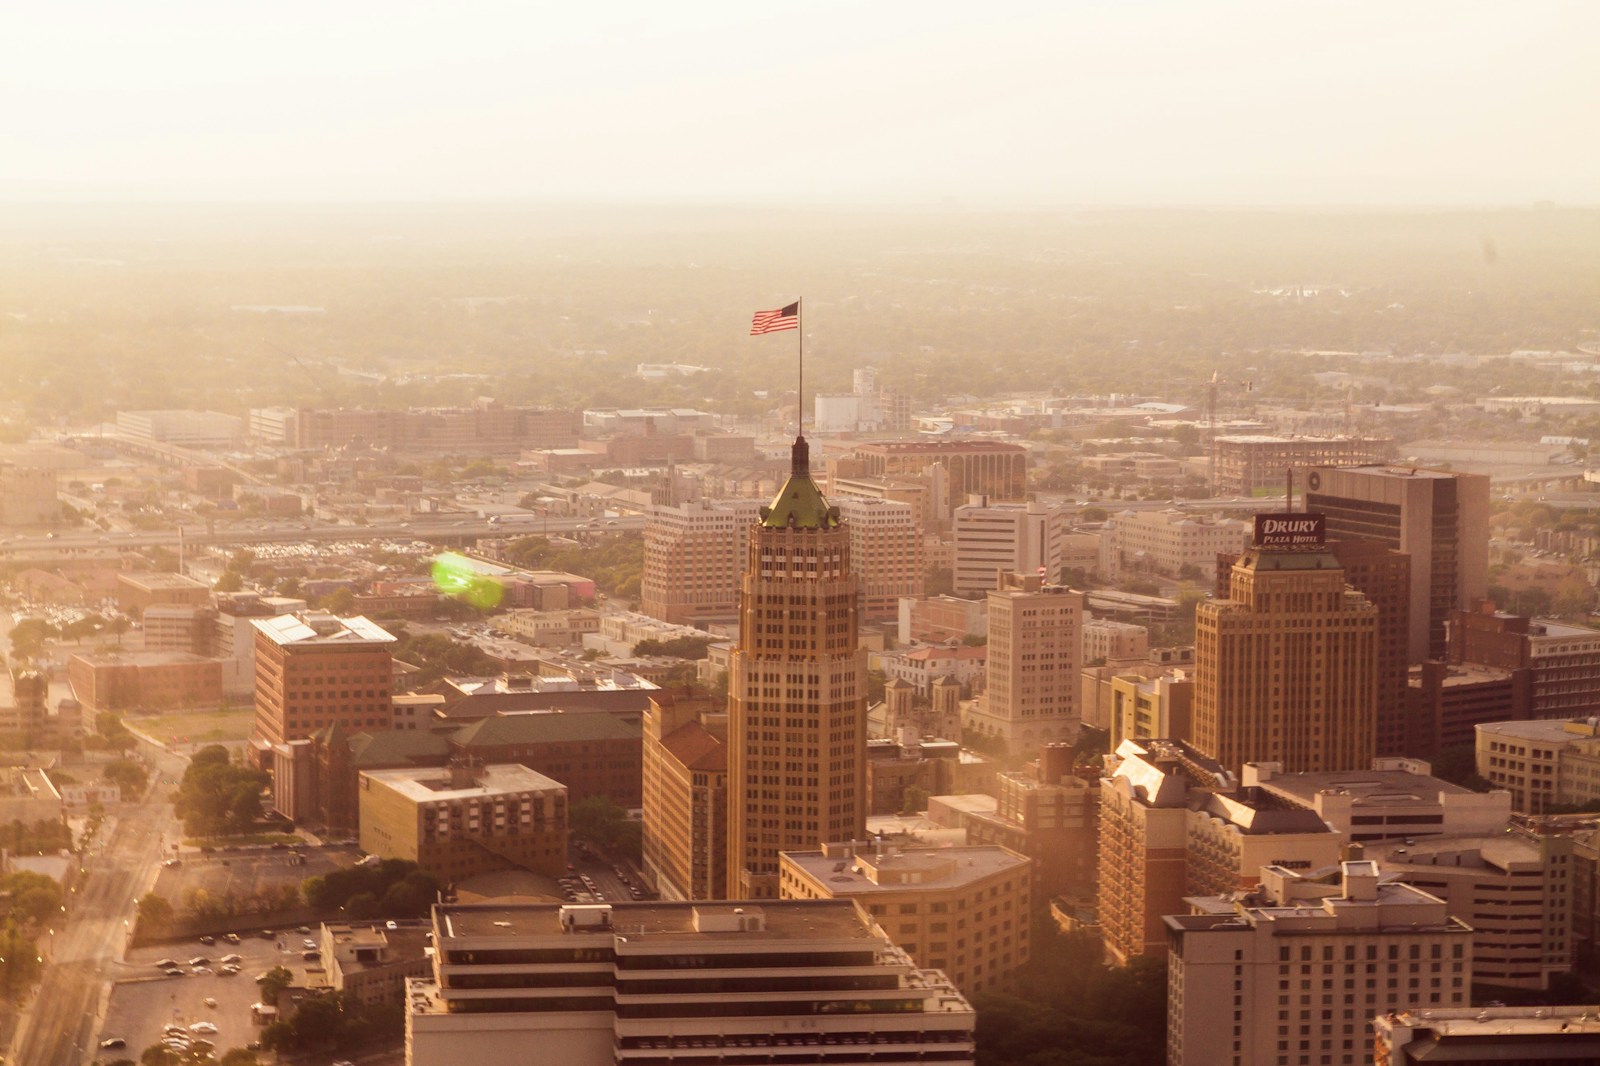
- Effect of -$10,000 income on PM2.5 concentration: +0.04 µg/m3 (+0.67 cigarettes a year)
- Average annual PM2.5 concentration: 4.89 µg/m3
- Median household income: $59,593
- Poverty rate: 17.7%
19. Minneapolis, MN
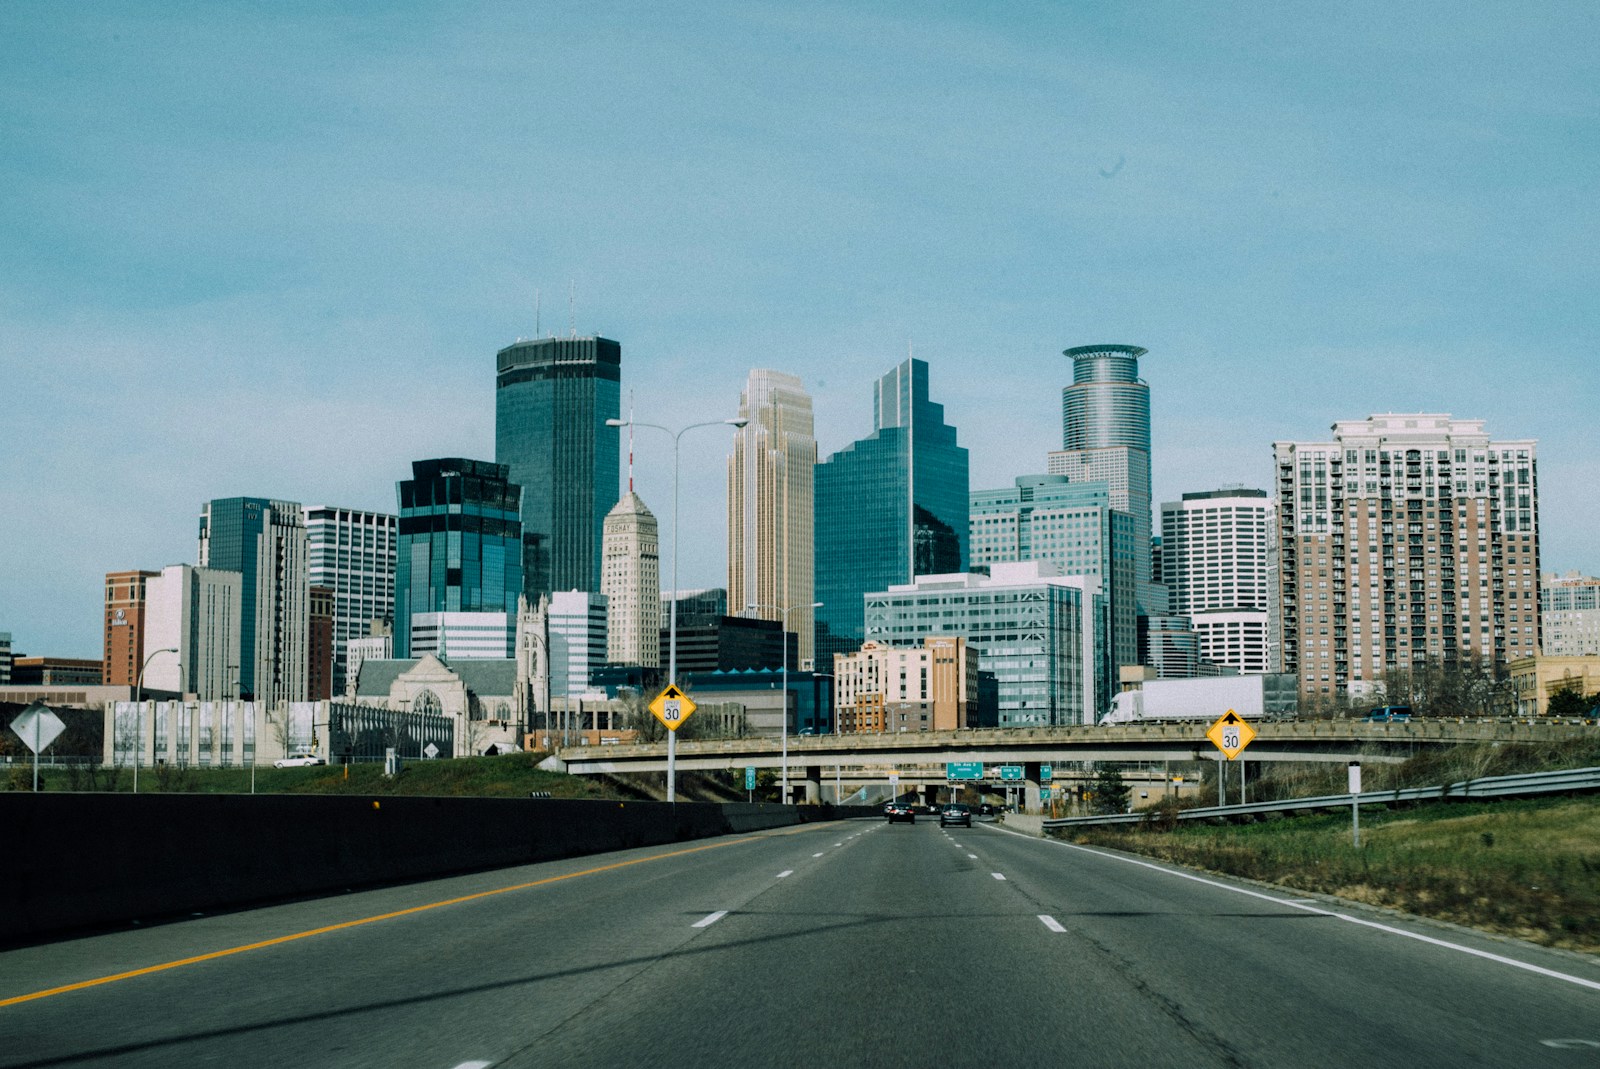
- Effect of -$10,000 income on PM2.5 concentration: +0.05 µg/m3 (+0.75 cigarettes a year)
- Average annual PM2.5 concentration: 4.87 µg/m3
- Median household income: $76,332
- Poverty rate: 16.8%
18. San Diego, CA

- Effect of -$10,000 income on PM2.5 concentration: +0.05 µg/m3 (+0.77 cigarettes a year)
- Average annual PM2.5 concentration: 4.19 µg/m3
- Median household income: $98,657
- Poverty rate: 11.4%
17. Fresno, CA
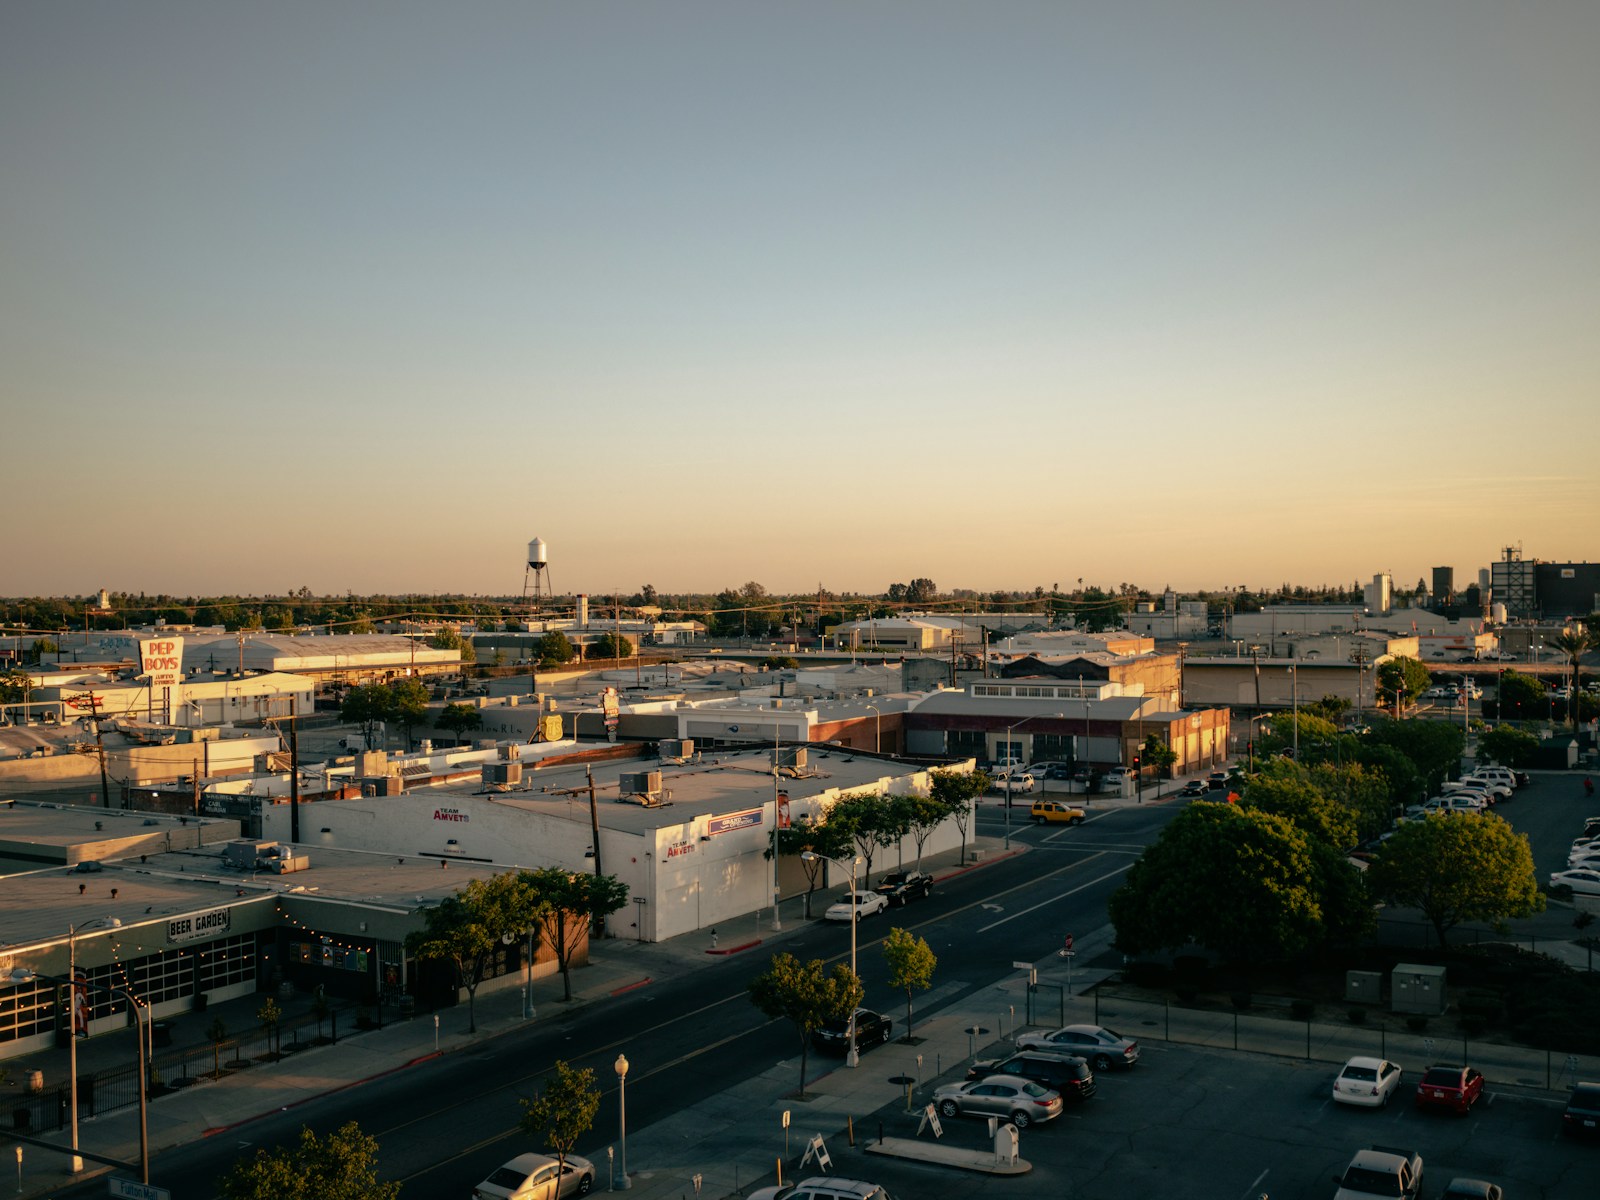
- Effect of -$10,000 income on PM2.5 concentration: +0.05 µg/m3 (+0.79 cigarettes a year)
- Average annual PM2.5 concentration: 5.14 µg/m3
- Median household income: $63,001
- Poverty rate: 22.1%
16. Paradise, NV
- Effect of -$10,000 income on PM2.5 concentration: +0.05 µg/m3 (+0.81 cigarettes a year)
- Average annual PM2.5 concentration: 3.98 µg/m3
- Median household income: $55,224
- Poverty rate: 16.8%
15. Colorado Springs, CO
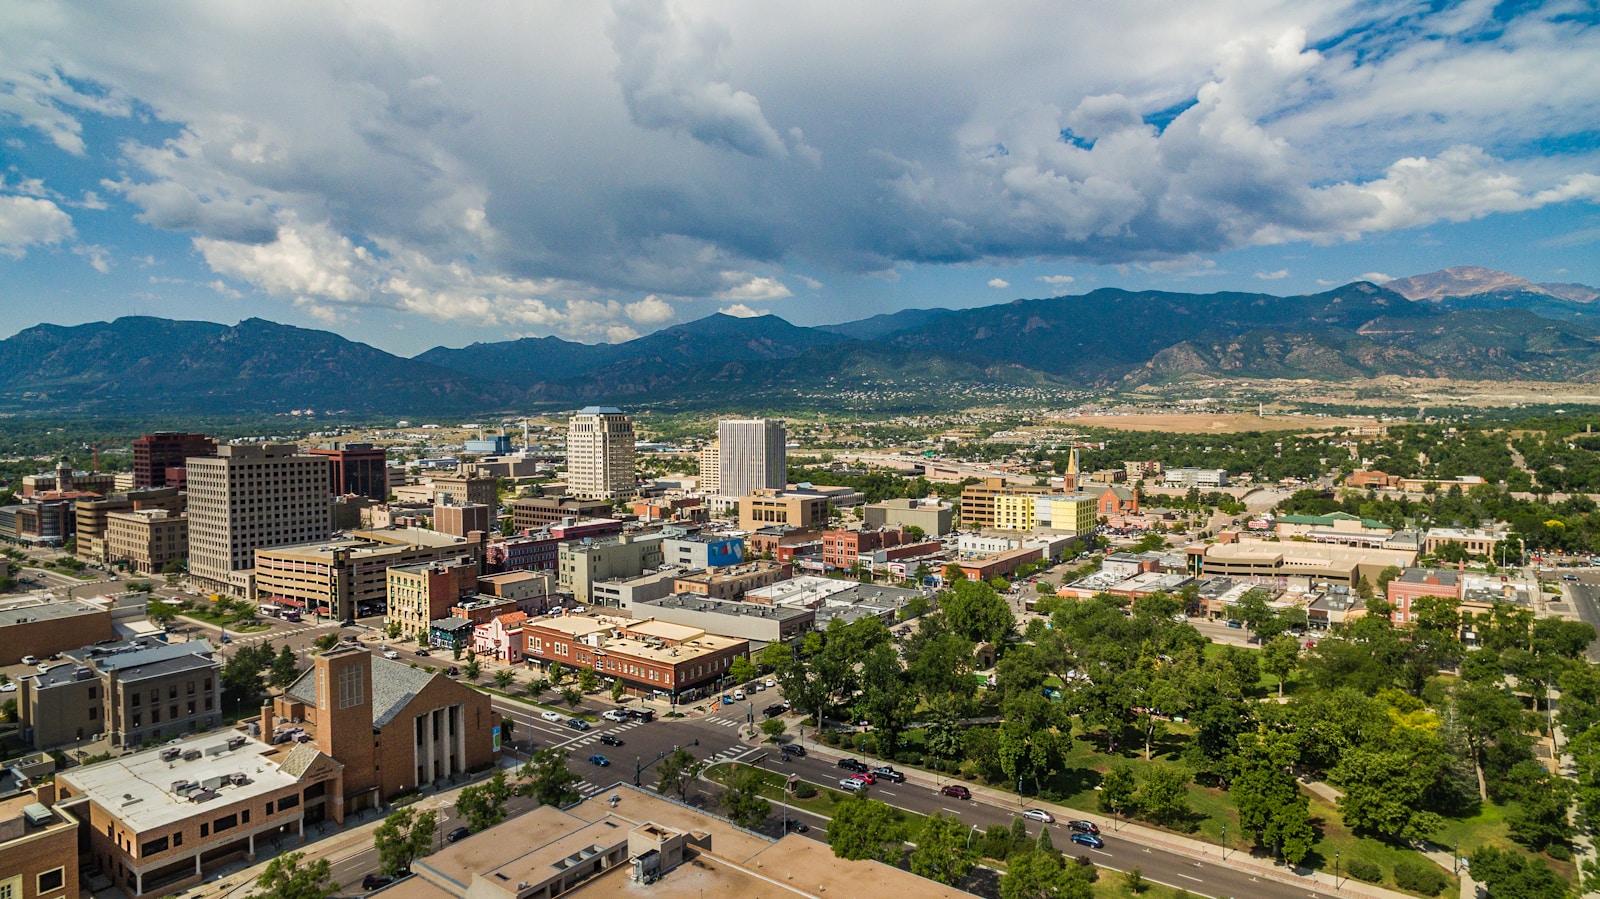
- Effect of -$10,000 income on PM2.5 concentration: +0.05 µg/m3 (+0.85 cigarettes a year)
- Average annual PM2.5 concentration: 3.71 µg/m3
- Median household income: $79,026
- Poverty rate: 10.4%
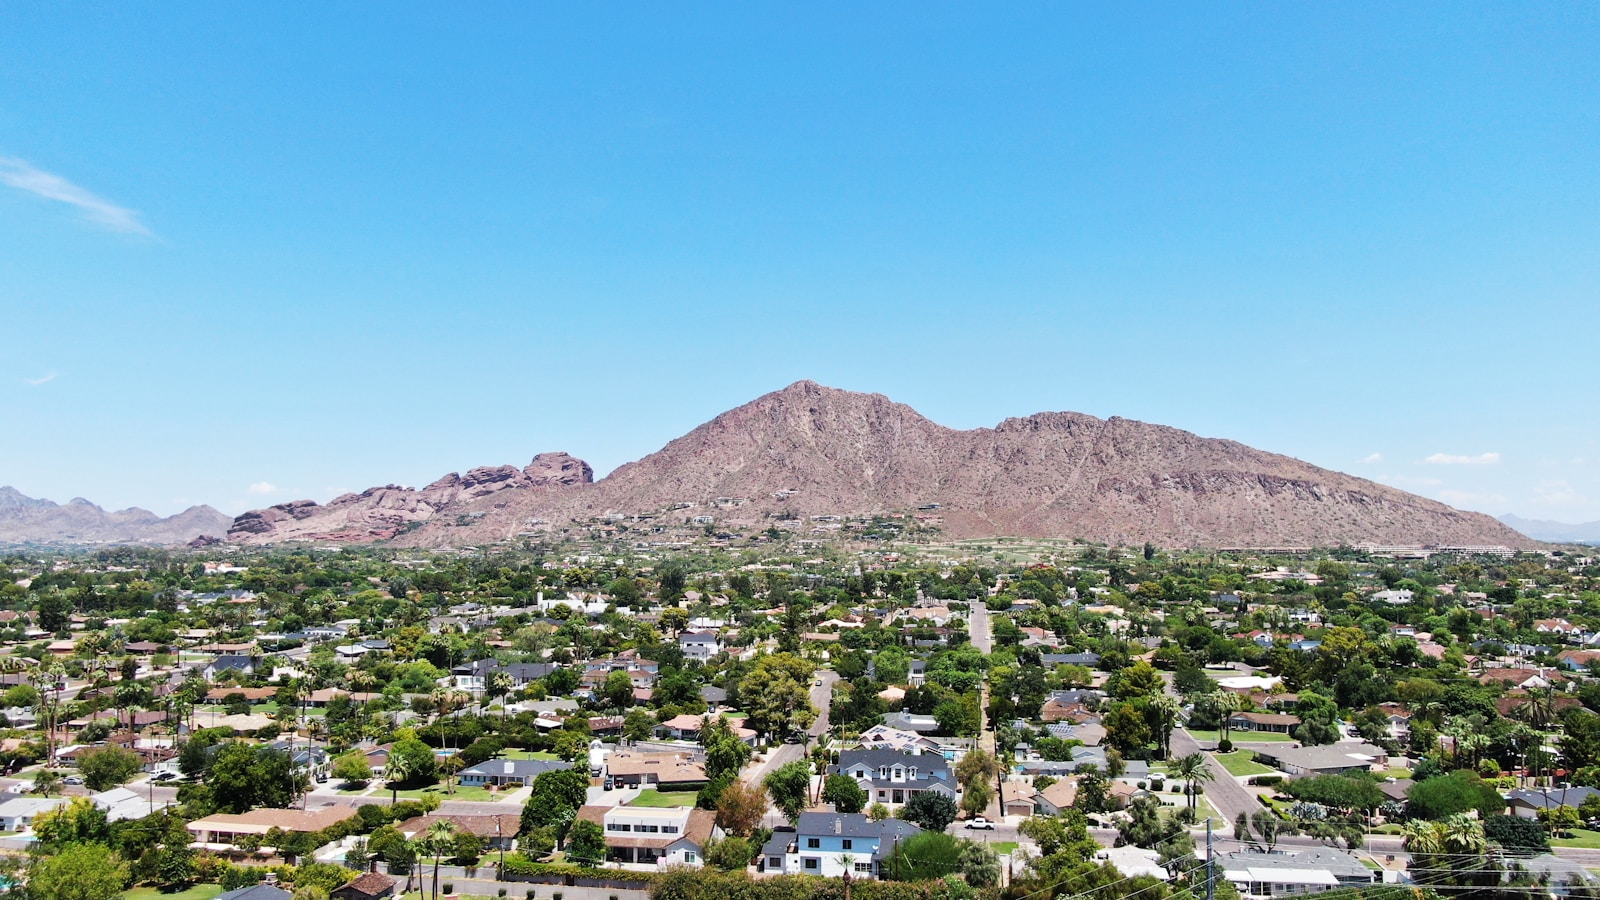
14. Mesa, AZ
- Effect of -$10,000 income on PM2.5 concentration: +0.05 µg/m3 (+0.86 cigarettes a year)
- Average annual PM2.5 concentration: 4.24 µg/m3
- Median household income: $73,766
- Poverty rate: 11.2%
13. Aurora, CO
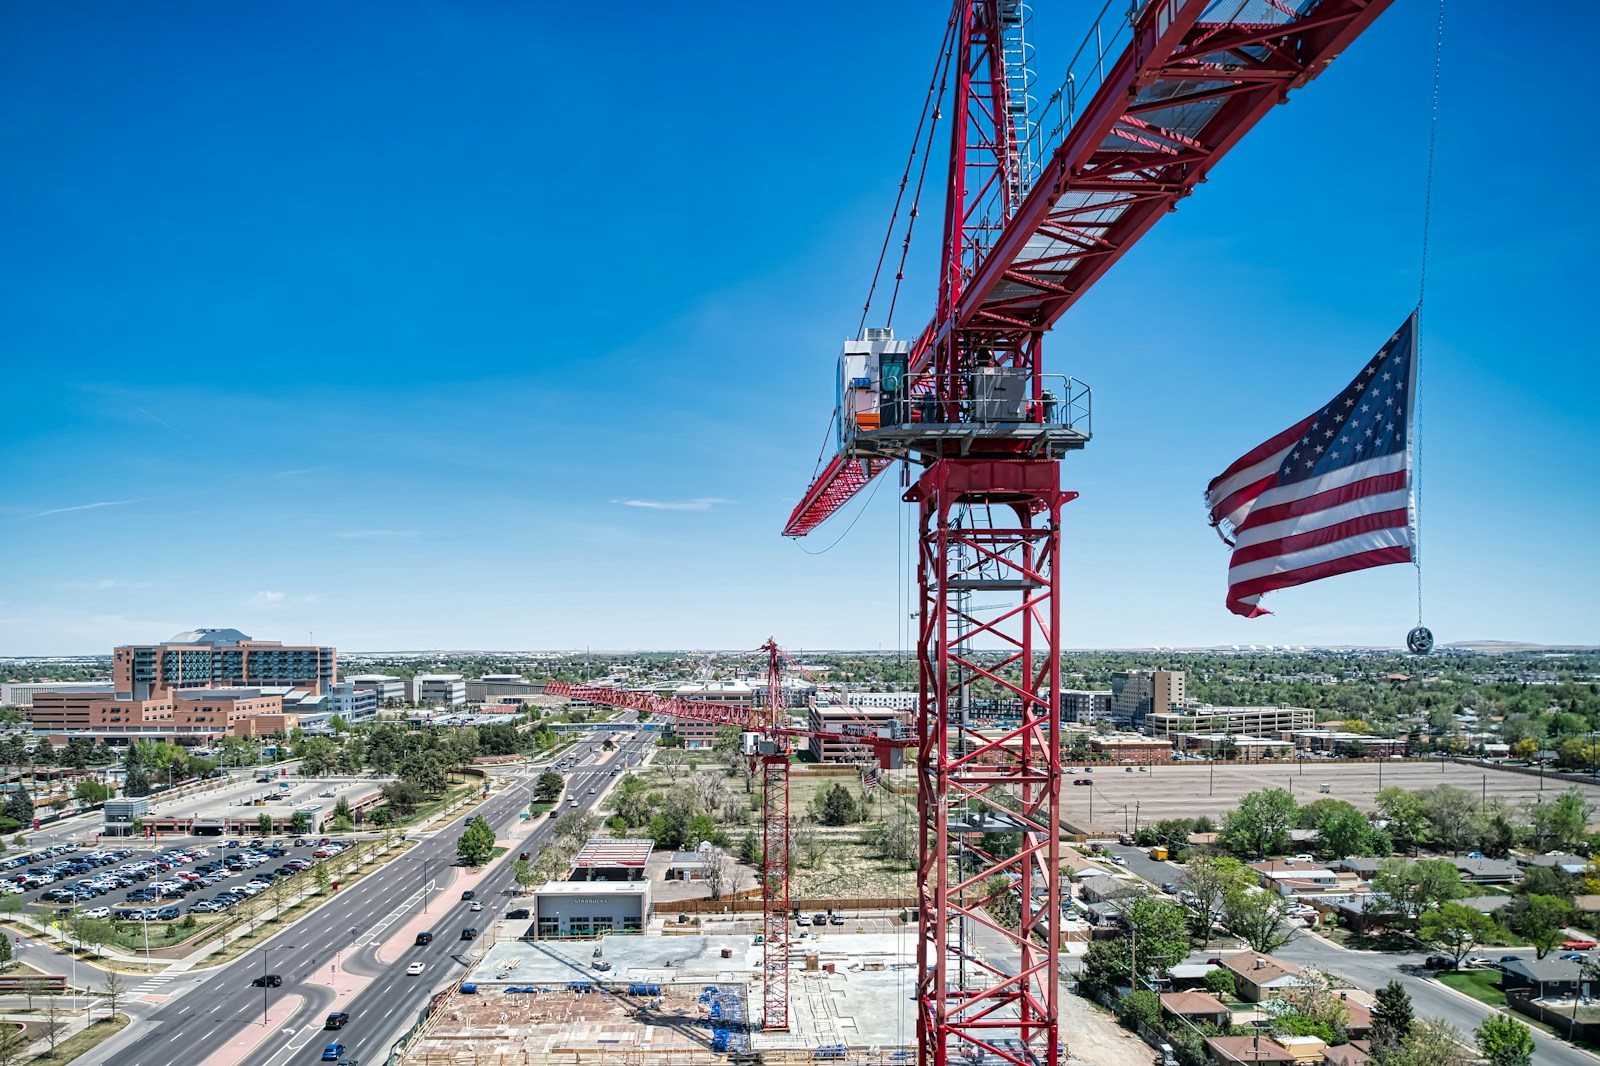
- Effect of -$10,000 income on PM2.5 concentration: +0.06 µg/m3 (+0.94 cigarettes a year)
- Average annual PM2.5 concentration: 4.19 µg/m3
- Median household income: $78,685
- Poverty rate: 10.5%
12. Toledo, OH

- Effect of -$10,000 income on PM2.5 concentration: +0.06 µg/m3 (+1.02 cigarettes a year)
- Average annual PM2.5 concentration: 5.40 µg/m3
- Median household income: $45,405
- Poverty rate: 24.6%
11. Henderson, NV
- Effect of -$10,000 income on PM2.5 concentration: +0.06 µg/m3 (+1.02 cigarettes a year)
- Average annual PM2.5 concentration: 3.46 µg/m3
- Median household income: $85,311
- Poverty rate: 8.1%
10. Reno, NV

- Effect of -$10,000 income on PM2.5 concentration: +0.07 µg/m3 (+1.12 cigarettes a year)
- Average annual PM2.5 concentration: 2.55 µg/m3
- Median household income: $73,073
- Poverty rate: 12.7%
9. Laredo, TX
- Effect of -$10,000 income on PM2.5 concentration: +0.07 µg/m3 (+1.22 cigarettes a year)
- Average annual PM2.5 concentration: 4.56 µg/m3
- Median household income: $60,928
- Poverty rate: 21.0%
8. Birmingham, AL
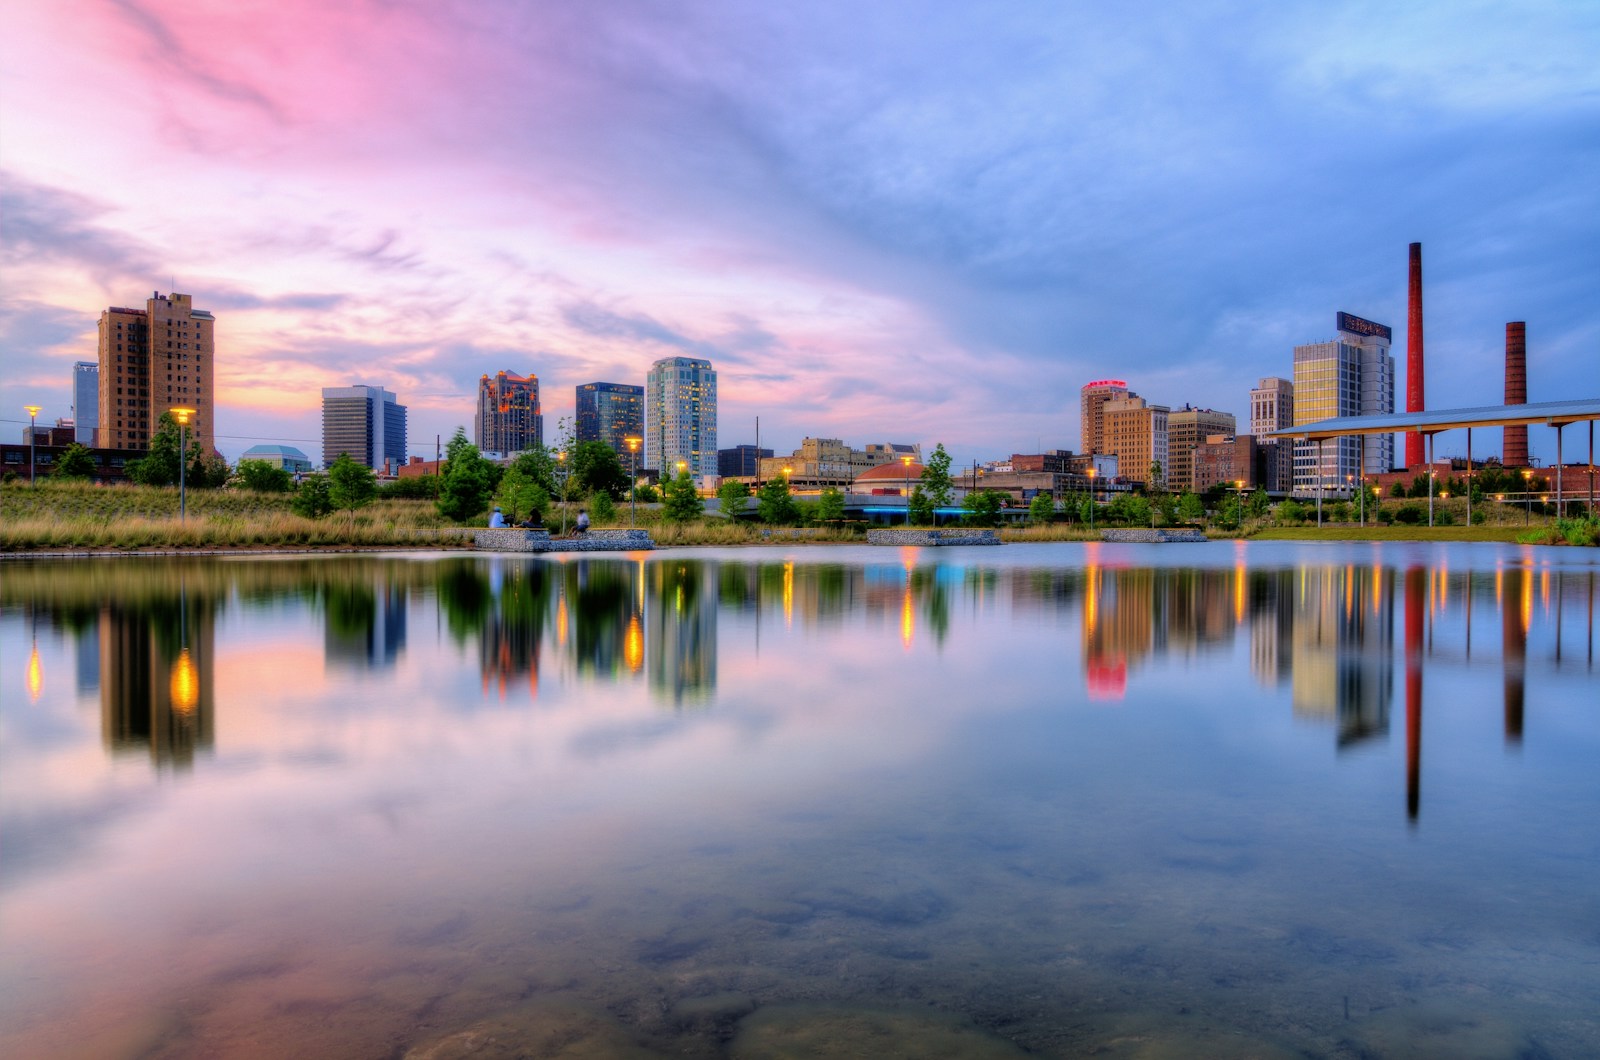
- Effect of -$10,000 income on PM2.5 concentration: +0.07 µg/m3 (+1.22 cigarettes a year)
- Average annual PM2.5 concentration: 4.97 µg/m3
- Median household income: $42,464
- Poverty rate: 26.1%
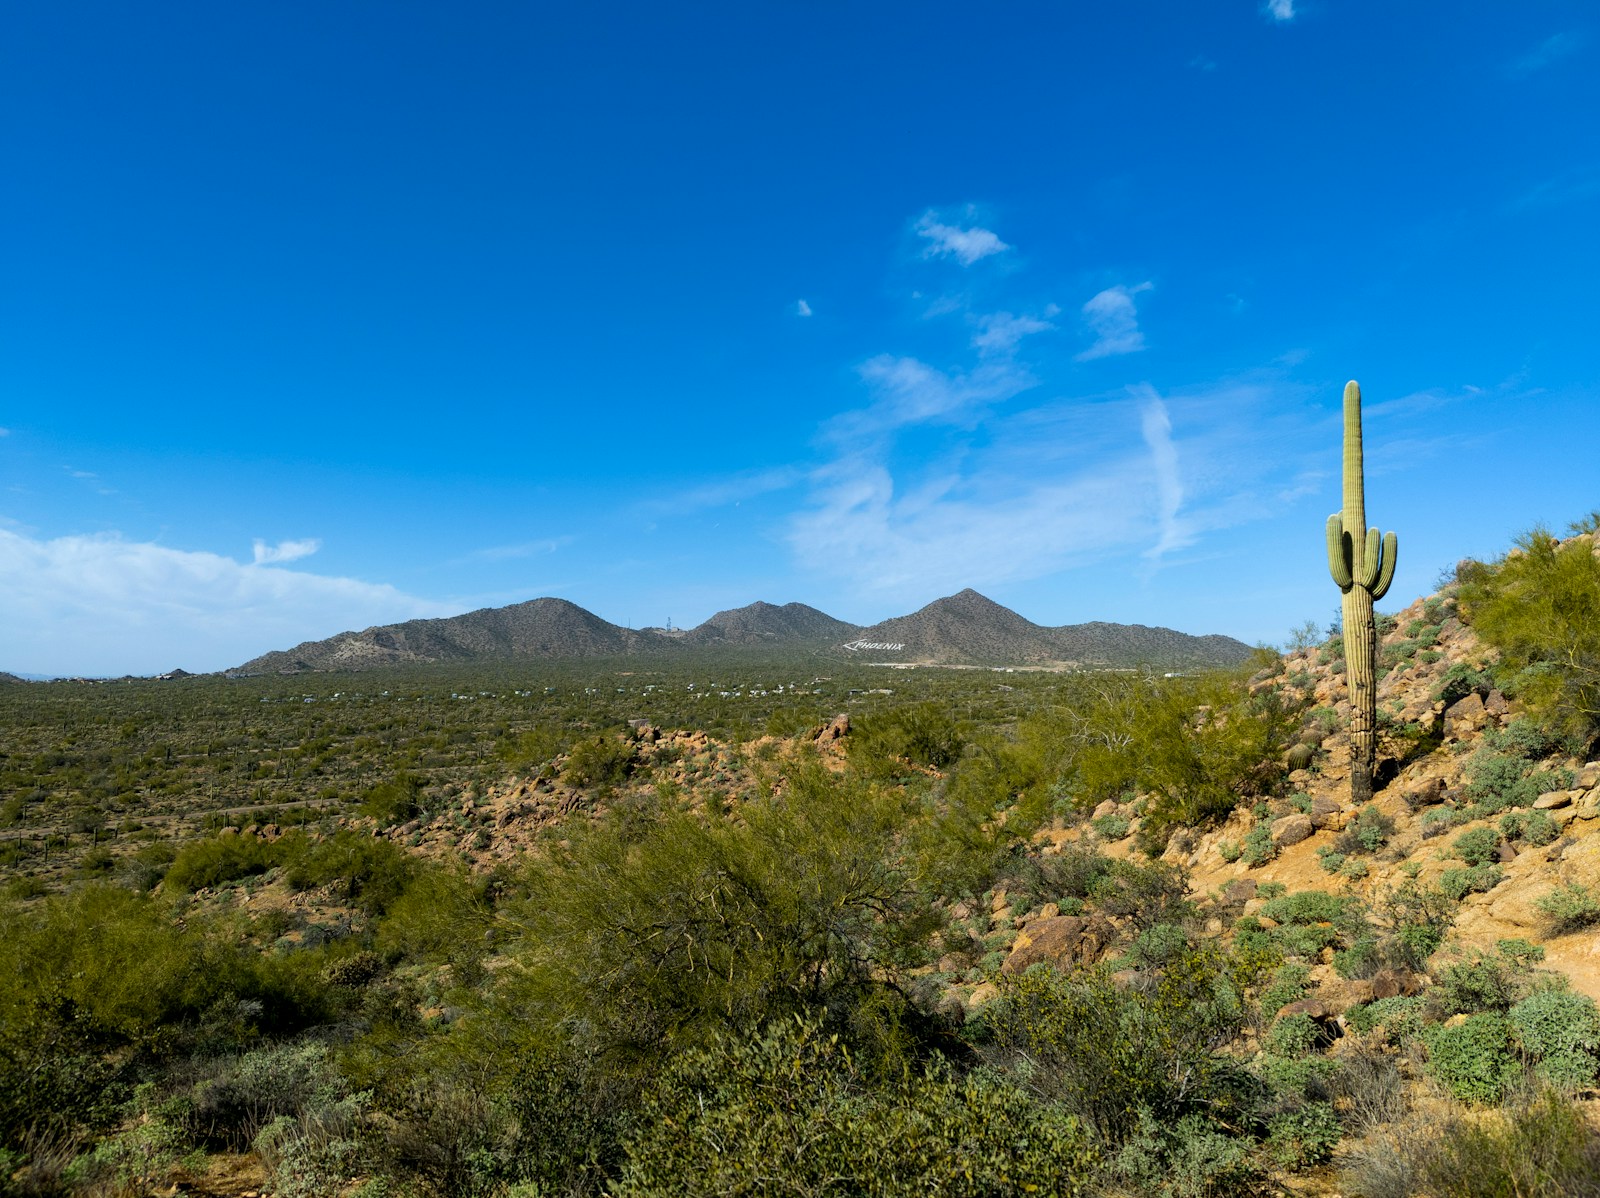
7. Phoenix, AZ
- Effect of -$10,000 income on PM2.5 concentration: +0.08 µg/m3 (+1.29 cigarettes a year)
- Average annual PM2.5 concentration: 4.26 µg/m3
- Median household income: $72,092
- Poverty rate: 14.6%
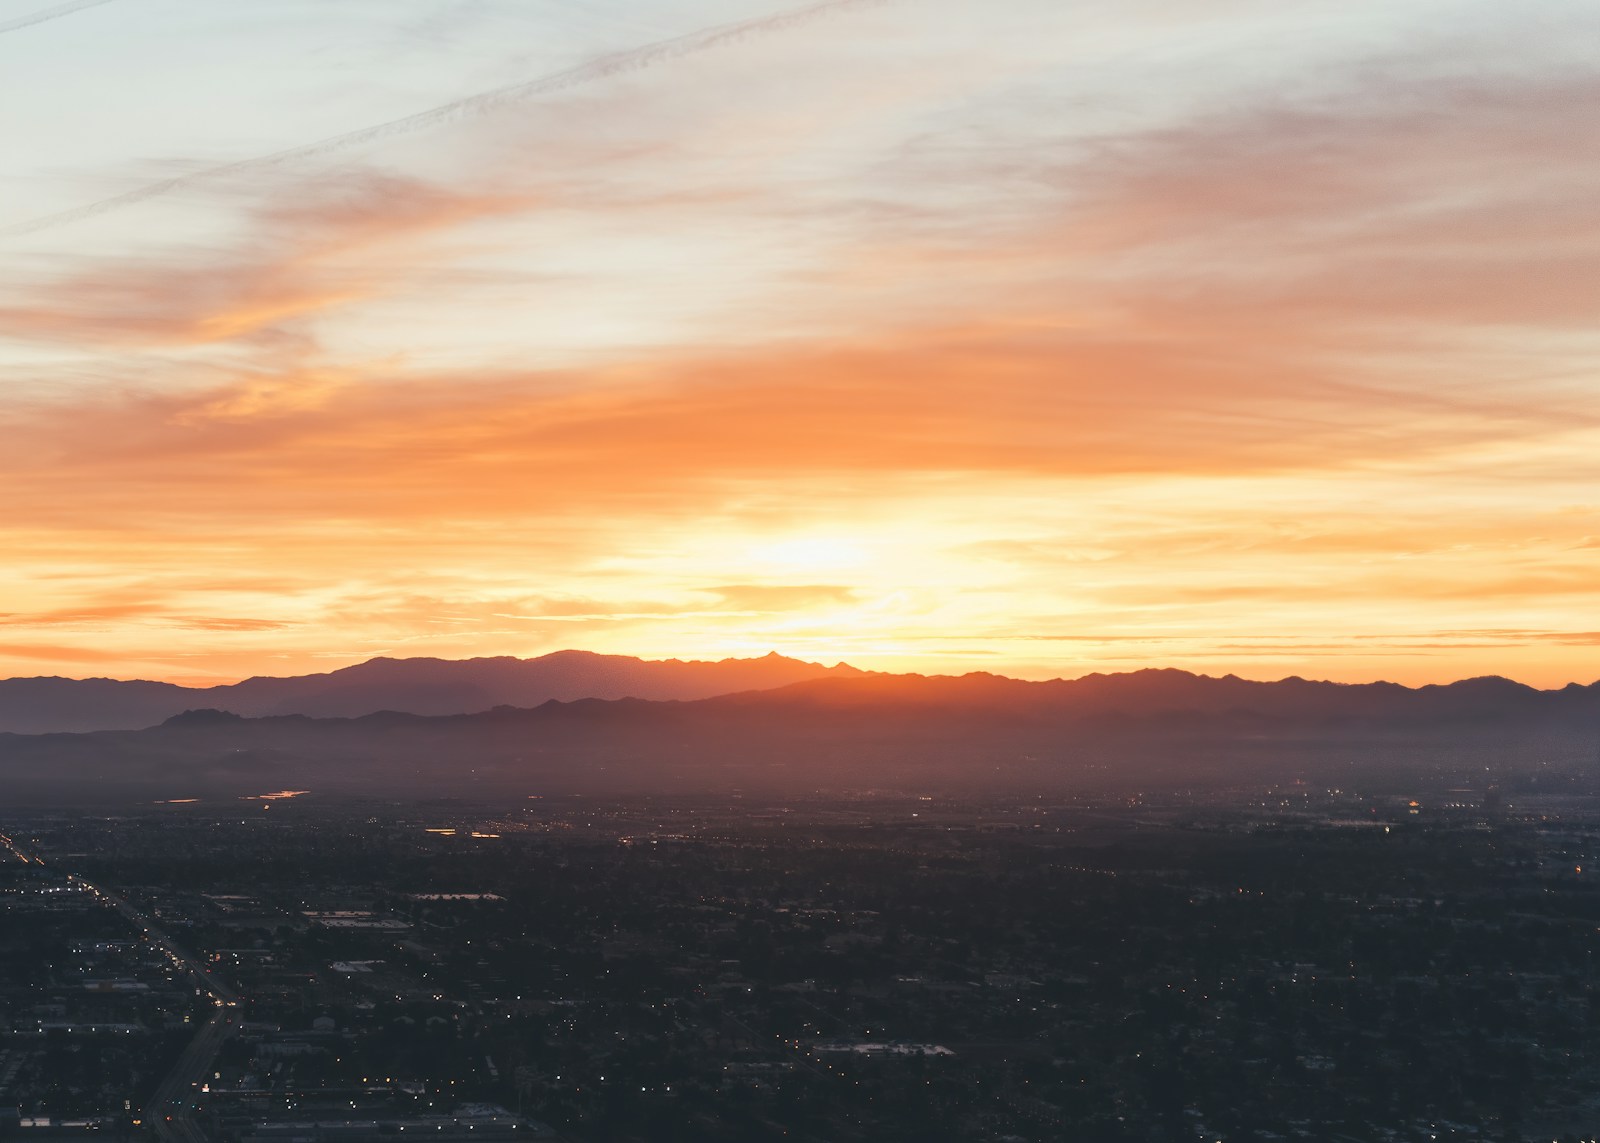
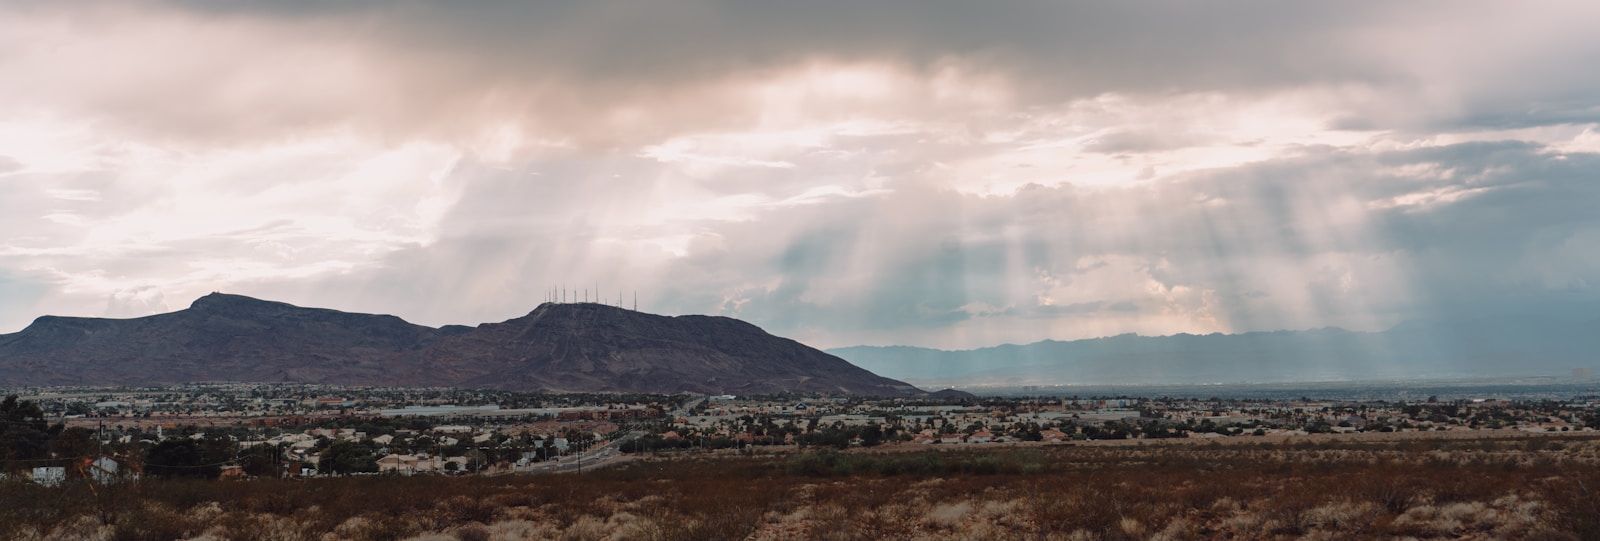
6. Las Vegas, NV
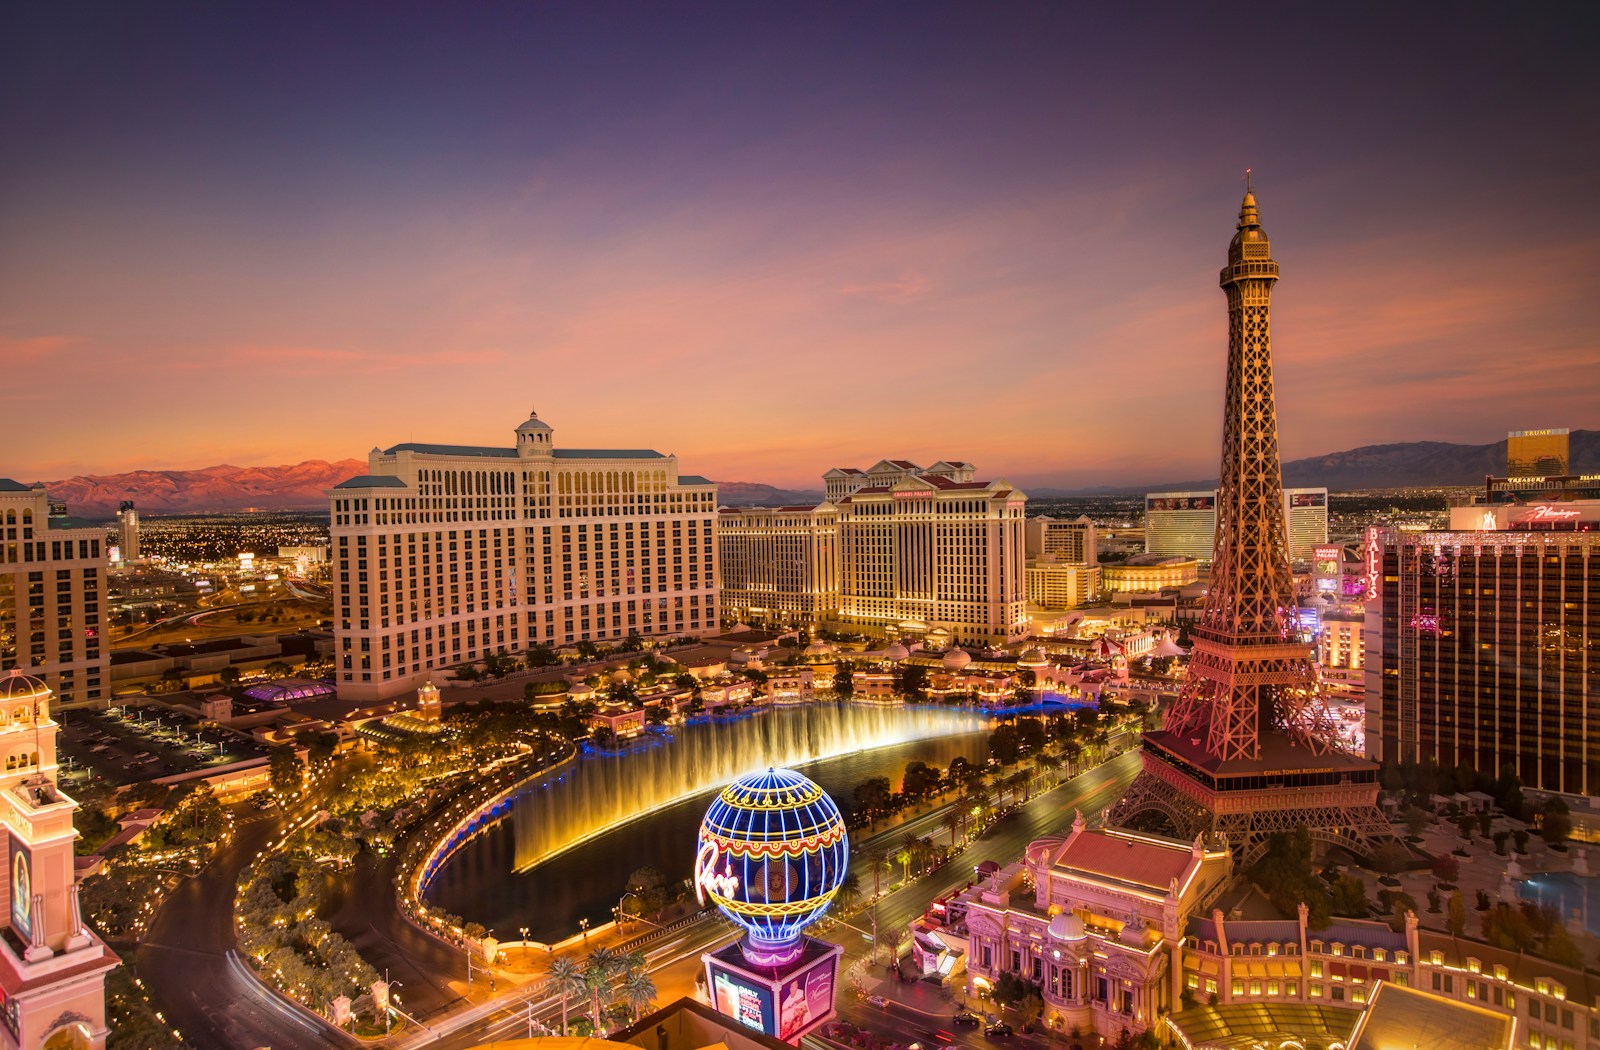
- Effect of -$10,000 income on PM2.5 concentration: +0.08 µg/m3 (+1.36 cigarettes a year)
- Average annual PM2.5 concentration: 3.62 µg/m3
- Median household income: $66,356
- Poverty rate: 14.7%
5. Scottsdale, AZ
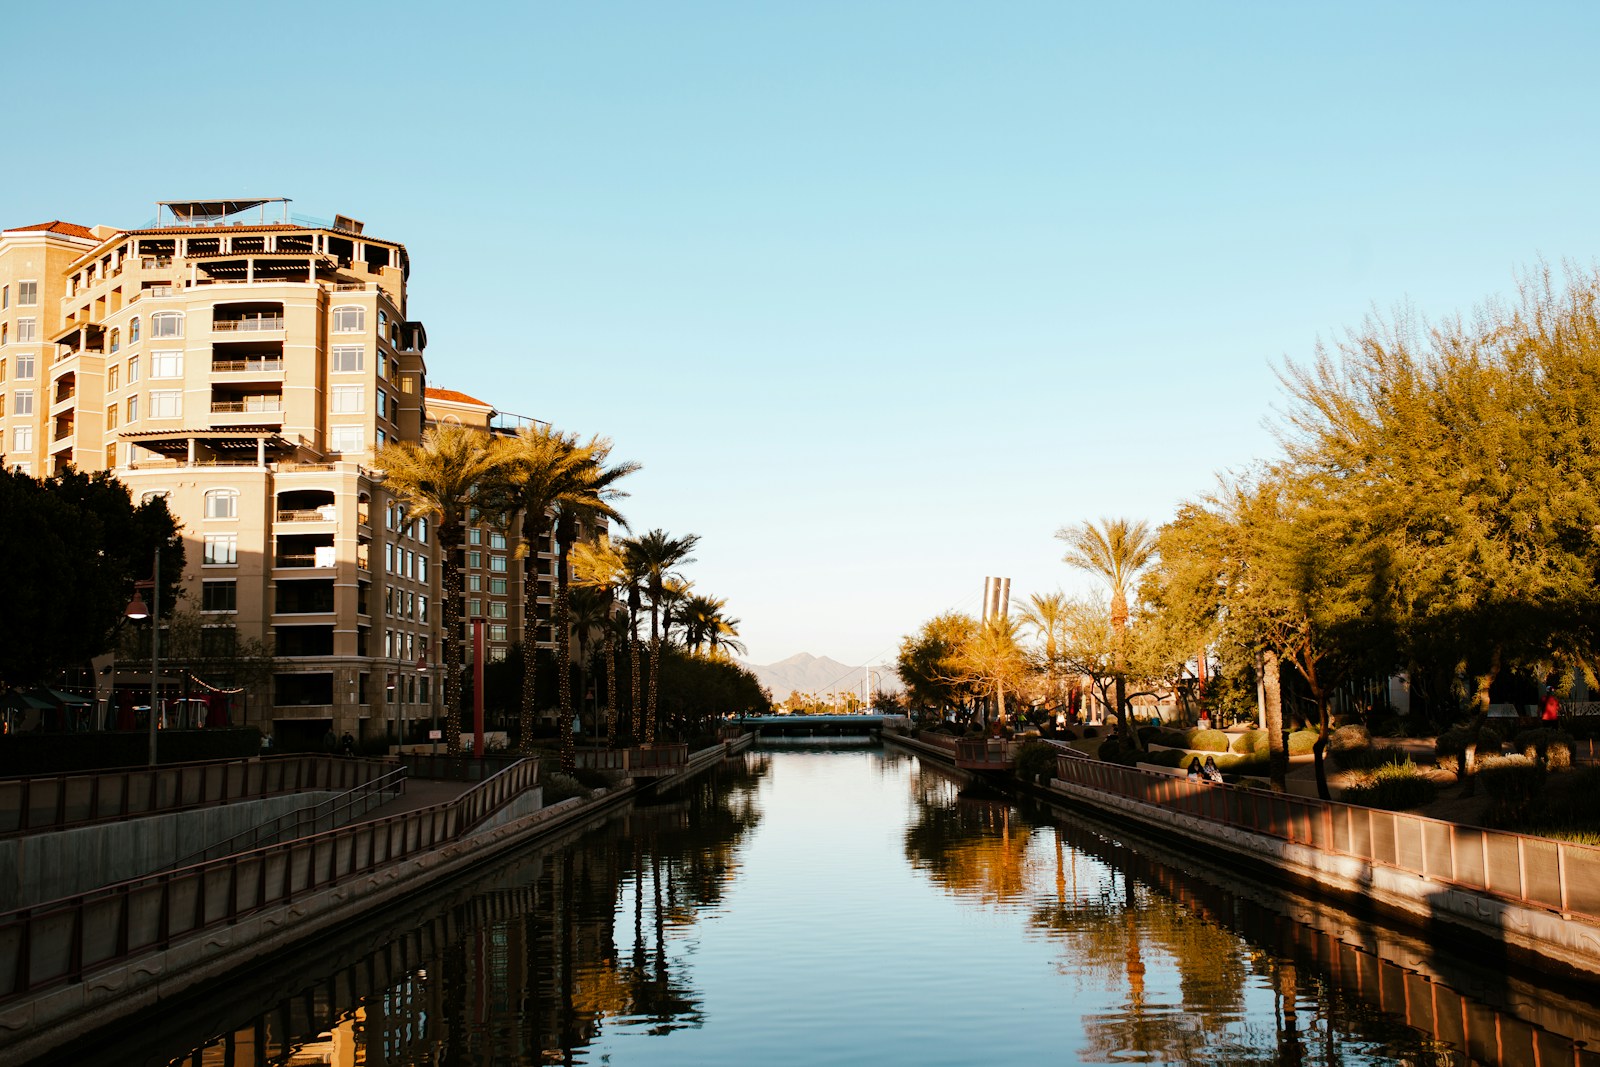
- Effect of -$10,000 income on PM2.5 concentration: +0.09 µg/m3 (+1.41 cigarettes a year)
- Average annual PM2.5 concentration: 3.35 µg/m3
- Median household income: $104,197
- Poverty rate: 6.8%
4. Los Angeles, CA
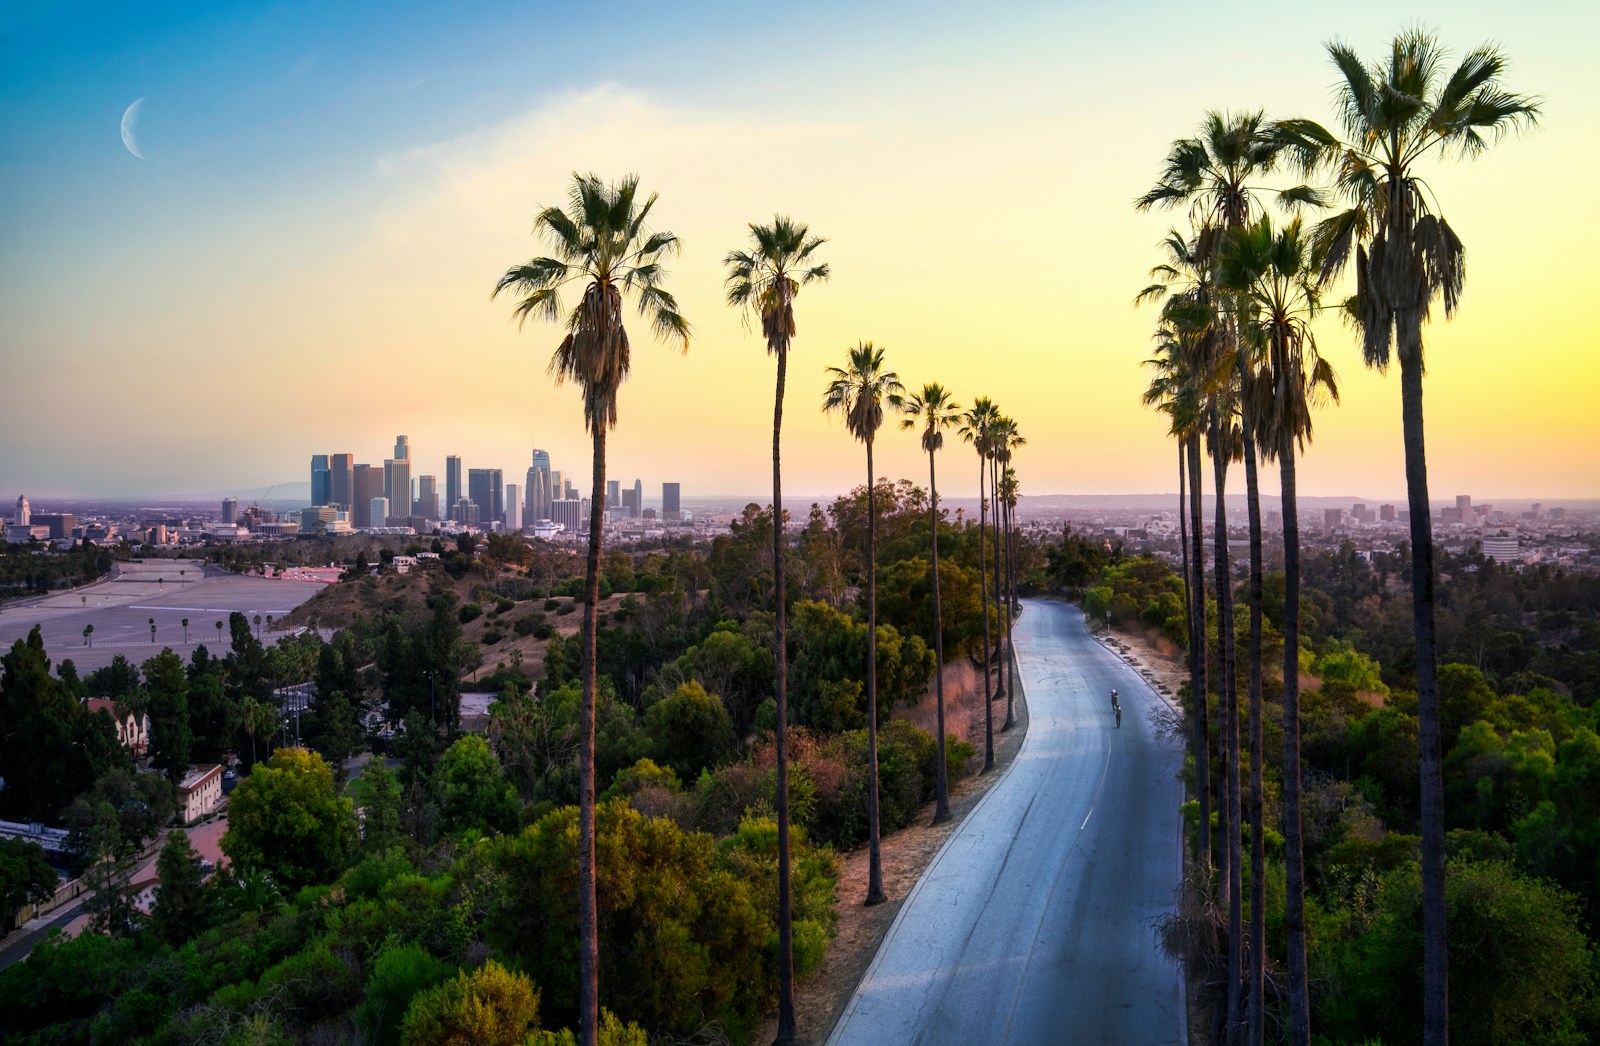
- Effect of -$10,000 income on PM2.5 concentration: +0.10 µg/m3 (+1.66 cigarettes a year)
- Average annual PM2.5 concentration: 5.87 µg/m3
- Median household income: $76,244
- Poverty rate: 16.6%
3. Akron, OH
- Effect of -$10,000 income on PM2.5 concentration: +0.10 µg/m3 (+1.70 cigarettes a year)
- Average annual PM2.5 concentration: 5.34 µg/m3
- Median household income: $46,596
- Poverty rate: 22.7%
2. Kansas City, KS

- Effect of -$10,000 income on PM2.5 concentration: +0.12 µg/m3 (+2.02 cigarettes a year)
- Average annual PM2.5 concentration: 4.21 µg/m3
- Median household income: $56,120
- Poverty rate: 17.4%
1. El Paso, TX
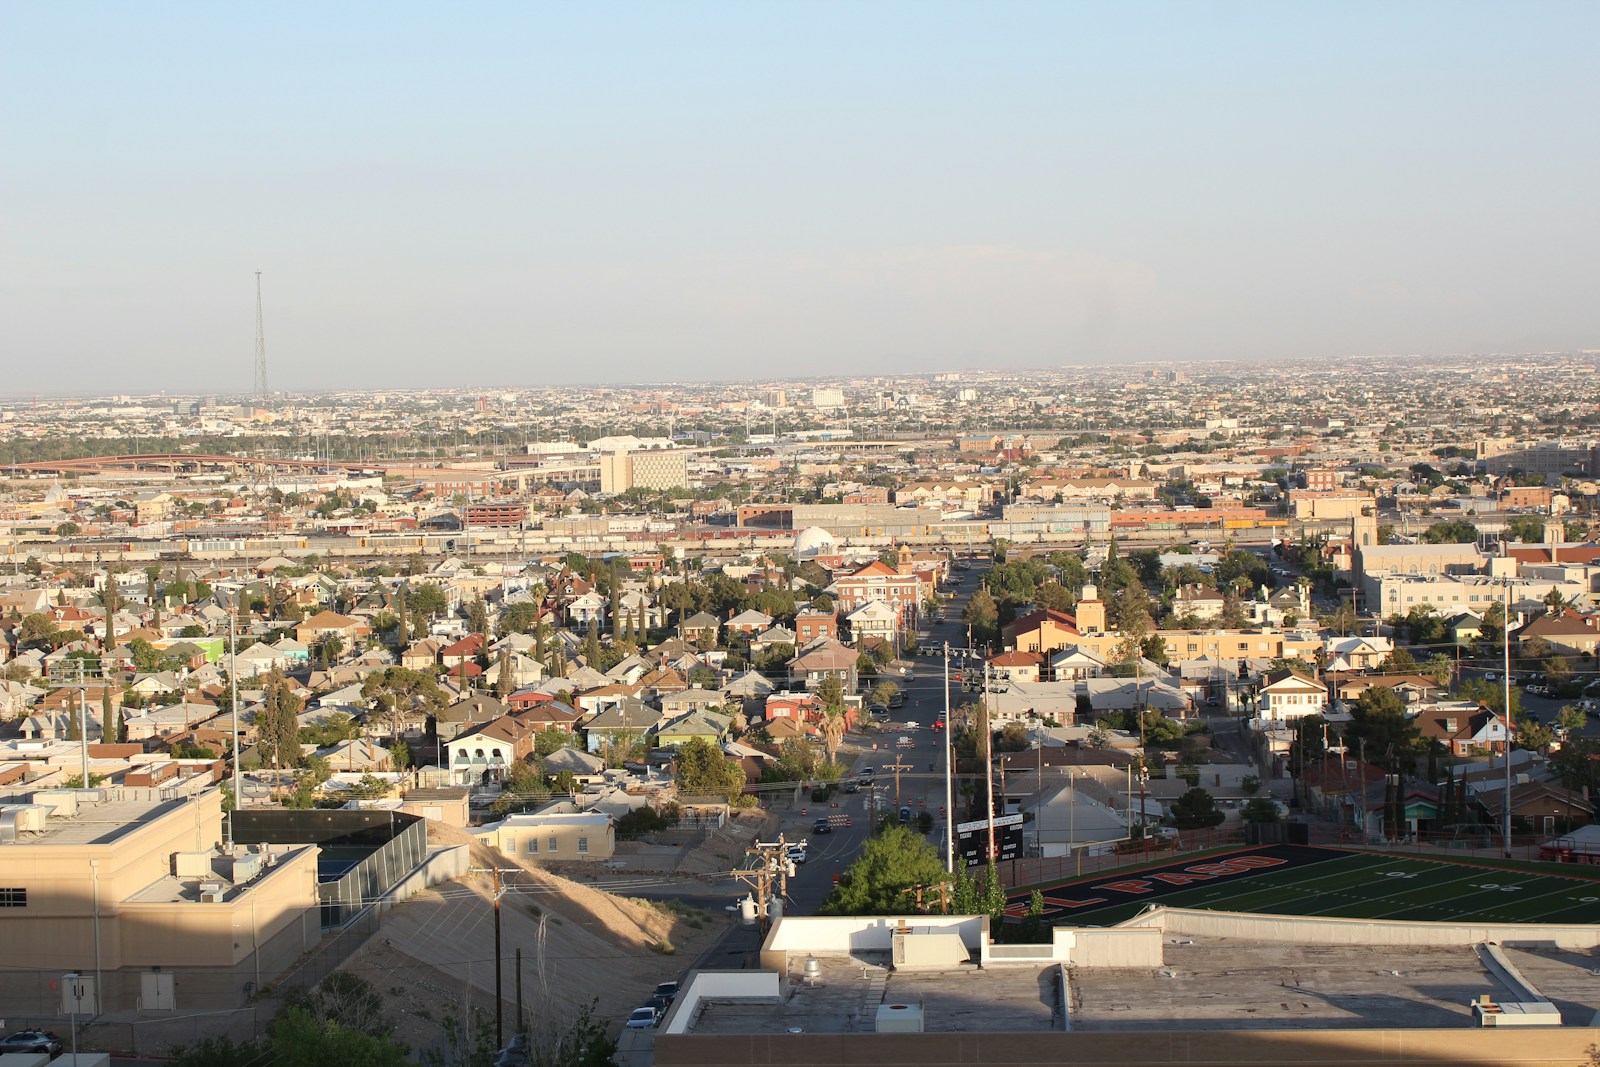
- Effect of -$10,000 income on PM2.5 concentration: +0.13 µg/m3 (+2.09 cigarettes a year)
- Average annual PM2.5 concentration: 3.69 µg/m3
- Median household income: $55,710
- Poverty rate: 18.9%
Sponsor
Find a Vetted Financial Advisor
- Finding a fiduciary financial advisor doesn't have to be hard. SmartAsset's free tool matches you with up to 3 financial advisors that serve your area in 5 minutes.
- Each advisor has been vetted by SmartAsset and is held to a fiduciary standard to act in your best interests. Get on the path toward achieving your financial goals!
More from ClimateCrisis 247
- These 20 Fast-Growing Cities Are Annexing New Land in High-Risk Fire Zones
- The 24 Deadliest Heat Waves of the Last 10 Years
- The Counties Where Power Outages Pose the Greatest Health Risk
- The US Cities With The Worst Air to Breathe Right Now