Cities Where Climate Change Is Causing More Extreme Rainfall
 https://climate-crisis-247-bucket.nyc3.cdn.digitaloceanspaces.com/wp-content/uploads/2025/10/10134209/93an5xcaljs-150x150.jpg
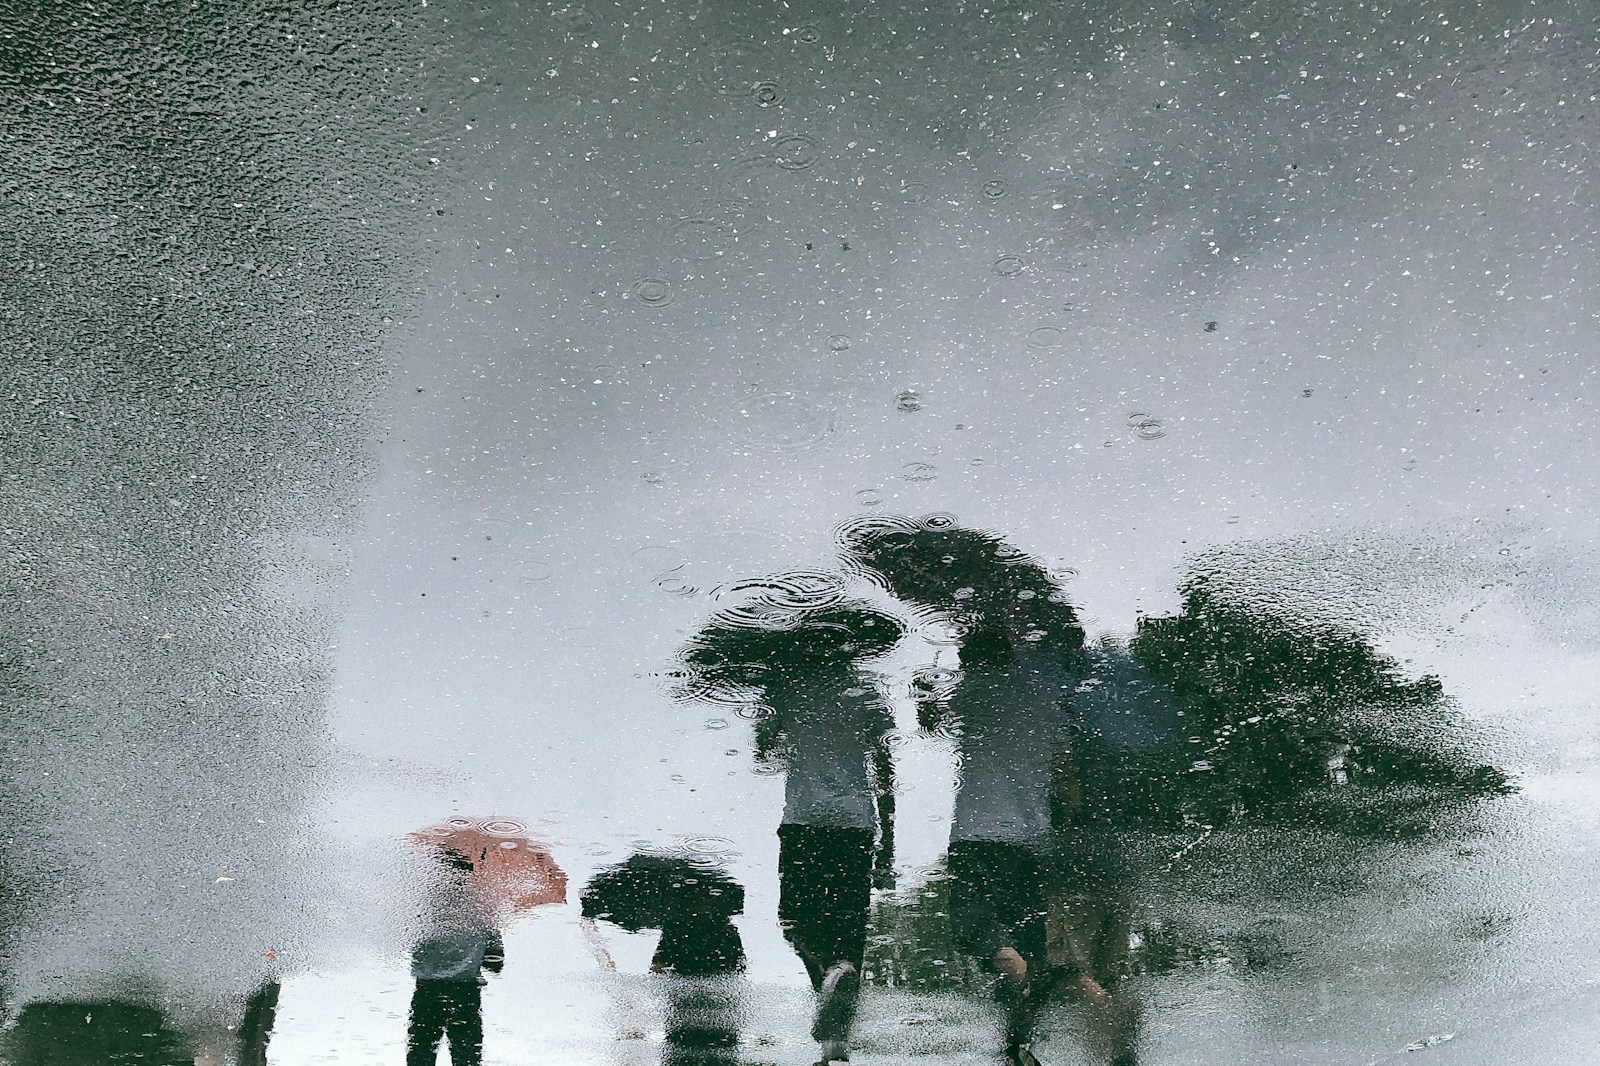
While the worst of the flooding season is over, this year was a devastating reminder of how vulnerable U.S. communities are to extreme rainfall. Several communities experienced deadly flooding events causing hundreds of millions in property damage, while the flooding of the Guadalupe River over the Fourth of July weekend resulted in more than 135 deaths.
Hot property? From Maui to Malibu, These Affluent Enclaves Are Becoming Wildfire Hotspots
Whence the next pandemic? Cities Where the Next Pandemic Is Most Likely to Break Out
Scientists warn that extreme rainfall events like the Central Texas floods are becoming more likely as the planet warms. As temperatures rise, increasingly warm air can hold increasingly more moisture, leading to heavier downpours and severe precipitation events. For every 1°F of warming, air holds 4% more moisture – upping the risk of intense, rapid-onset storms and flash flooding.
In a new analysis, Climate Central measured how climate change has coincided with increased rainfall in cities across the United States. Of the 144 locations analyzed, 126 experienced an increase in hourly rainfall intensity since 1970. Rainfall increased by 15% on average, with the largest increases in the Upper Midwest, Northern Rockies, and Ohio Valley – as well as two cities in Texas. A closer look at the data reveals the cities where rainfall is increasing the most, and where extreme precipitation could intensify flash flooding and other extreme weather events.
To determine the cities where climate change is contributing to more rainfall, Climate Crisis 247 reviewed data on rainfall density from Climate Central. Cities were ranked based on the change in the simple hourly rainfall intensity index from 1970 to 2024. The simple hourly rainfall intensity index is defined as total annual rainfall divided by the total hours of rainfall each year, or inches of rainfall per hour. Data was calculated across 144 U.S. weather stations with sufficient data quality using data from the National Centers for Environmental Information and the Applied Climate Information System.
15. Huntington, WV
- Percent change in hourly rainfall density, 1970-2024: +26.8%
- Climate region: Ohio Valley
14. Binghamton, NY

- Percent change in hourly rainfall density, 1970-2024: +27.2%
- Climate region: Northeast
13. Norfolk, VA

- Percent change in hourly rainfall density, 1970-2024: +27.4%
- Climate region: Southeast
12. Tucson, AZ
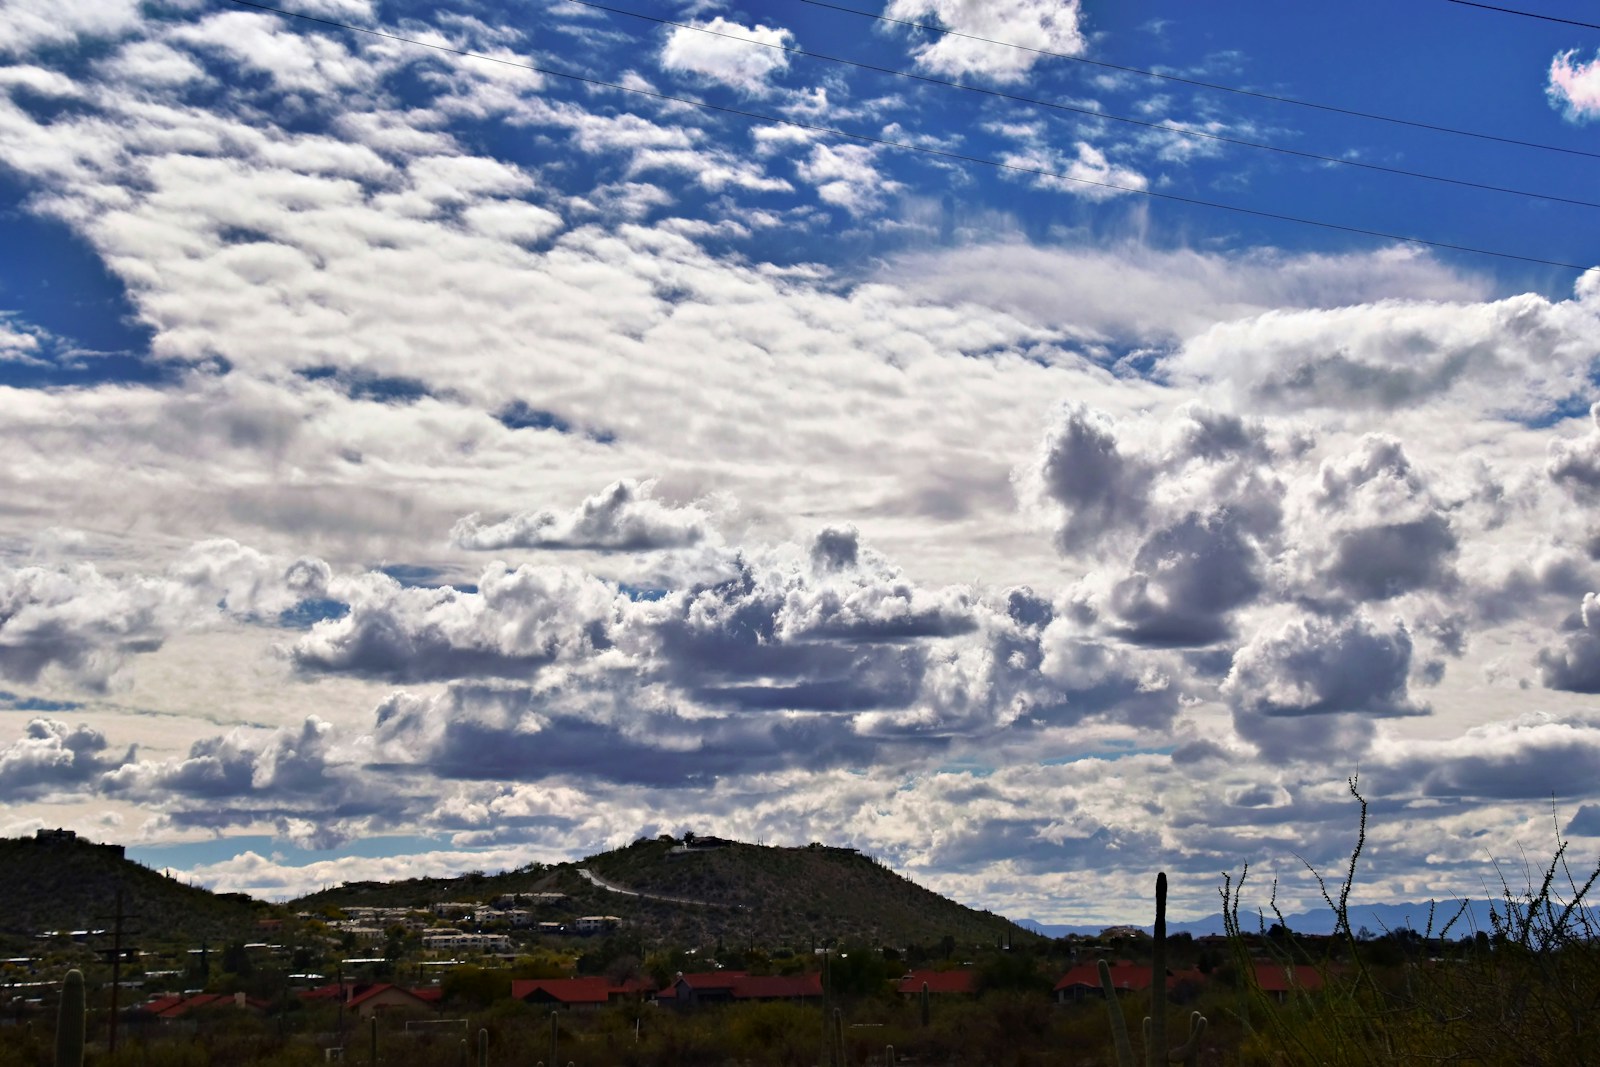
- Percent change in hourly rainfall density, 1970-2024: +27.9%
- Climate region: Southwest
11. Pittsburgh, PA
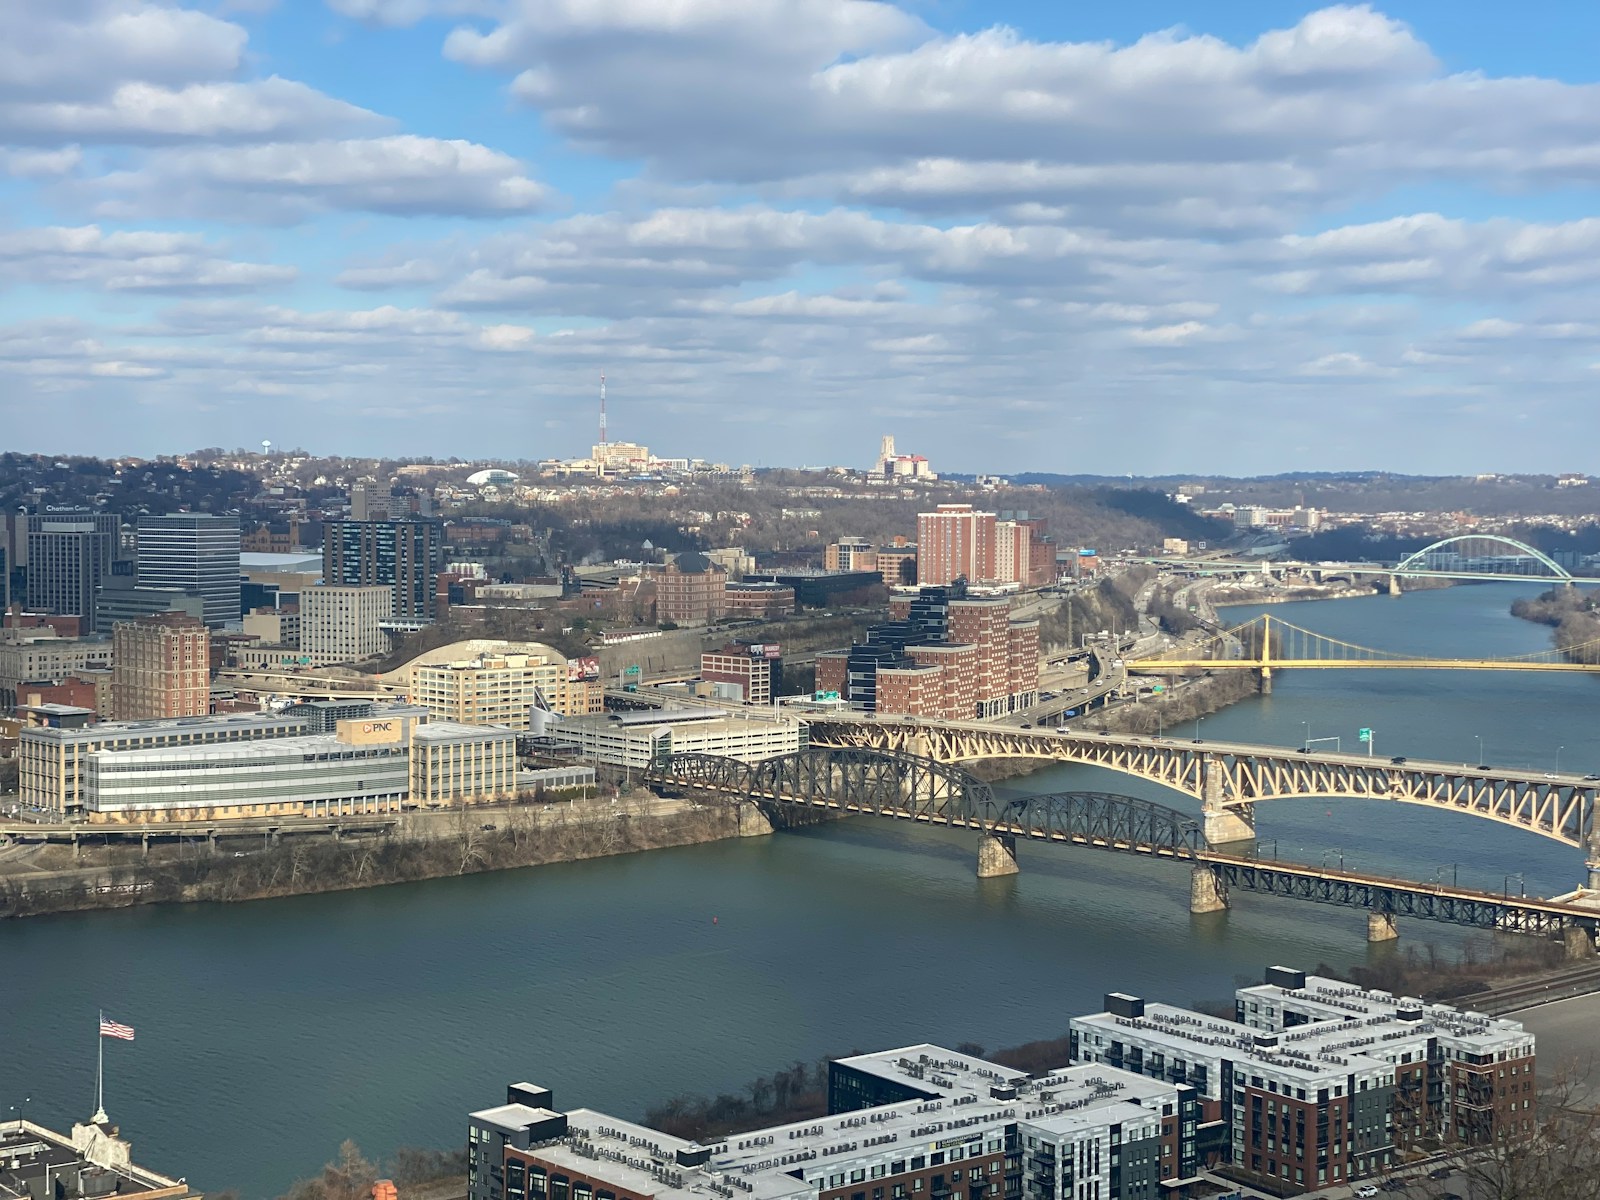
- Percent change in hourly rainfall density, 1970-2024: +27.9%
- Climate region: Northeast
10. Toledo, OH
- Percent change in hourly rainfall density, 1970-2024: +28.2%
- Climate region: Ohio Valley
9. San Angelo, TX

- Percent change in hourly rainfall density, 1970-2024: +29.0%
- Climate region: South
8. Sioux City, IA

- Percent change in hourly rainfall density, 1970-2024: +29.0%
- Climate region: Upper Midwest
7. North Platte, NE
- Percent change in hourly rainfall density, 1970-2024: +30.0%
- Climate region: Northern Rockies & Plains
6. Bismarck, ND
- Percent change in hourly rainfall density, 1970-2024: +30.0%
- Climate region: Northern Rockies & Plains
5. Sioux Falls, SD
- Percent change in hourly rainfall density, 1970-2024: +31.1%
- Climate region: Northern Rockies & Plains
4. El Paso, TX
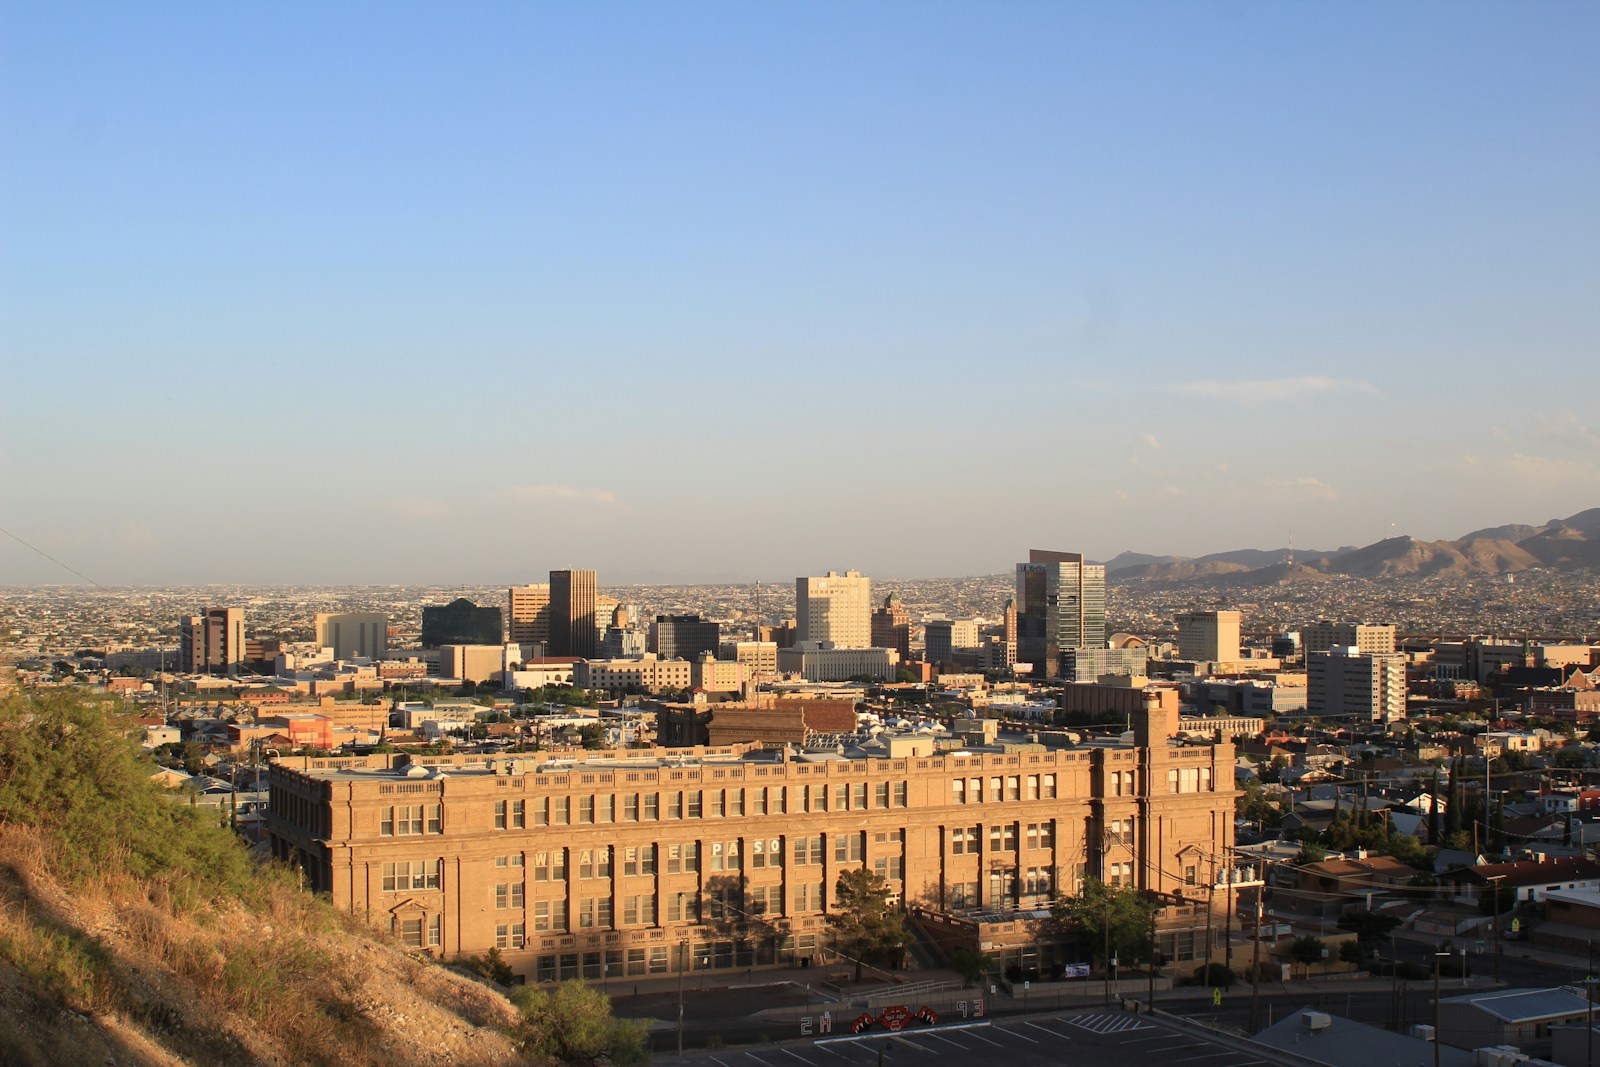
- Percent change in hourly rainfall density, 1970-2024: +36.5%
- Climate region: South
3. Fairbanks, AK
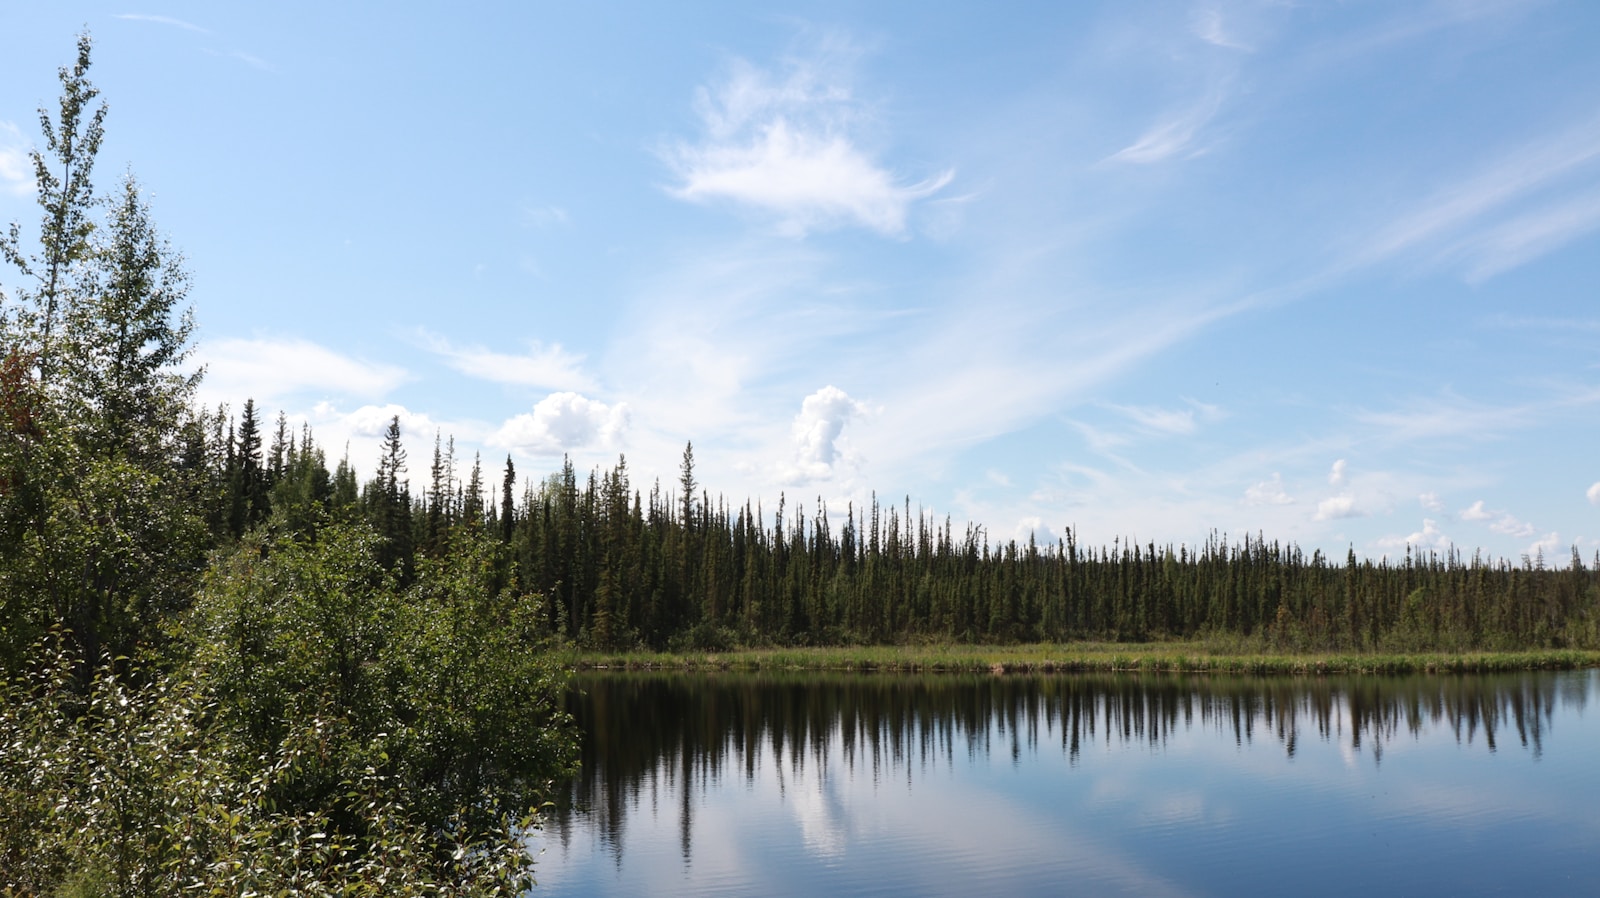
- Percent change in hourly rainfall density, 1970-2024: +36.8%
- Climate region: Northwest
2. Reno, NV
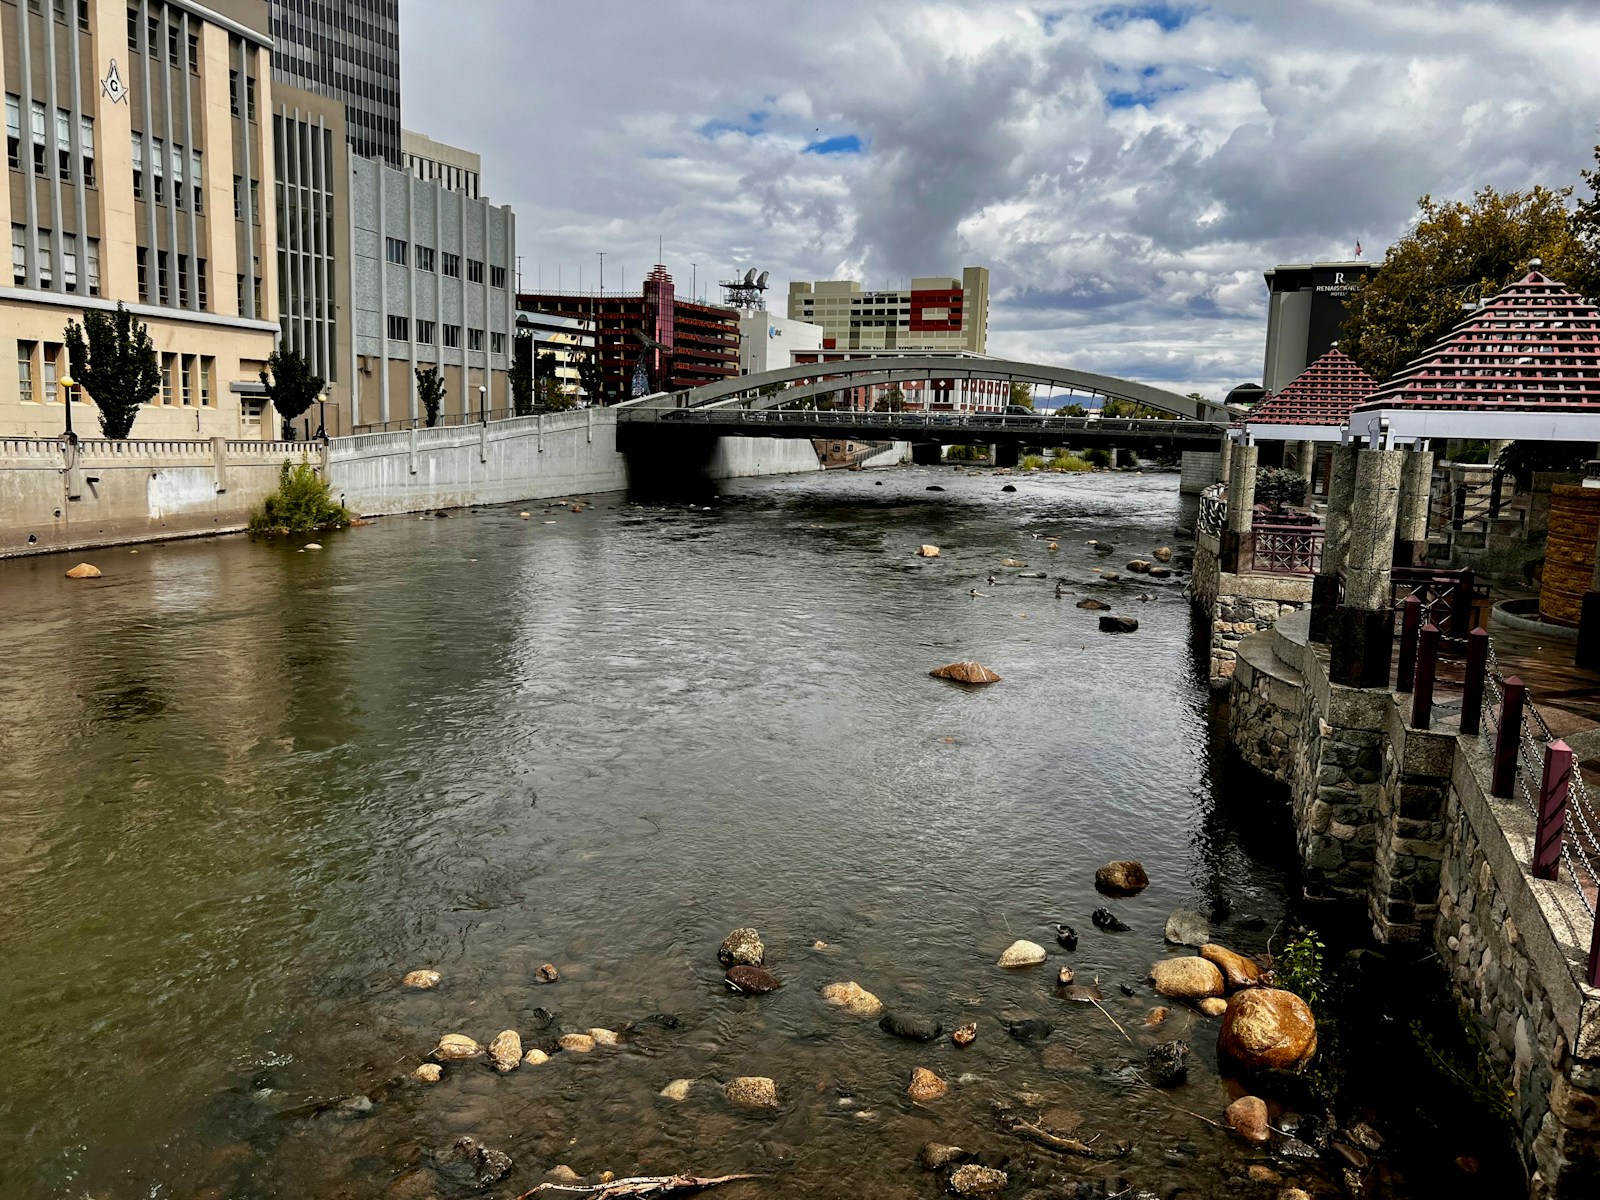
- Percent change in hourly rainfall density, 1970-2024: +37.0%
- Climate region: West
1. Wichita, KS
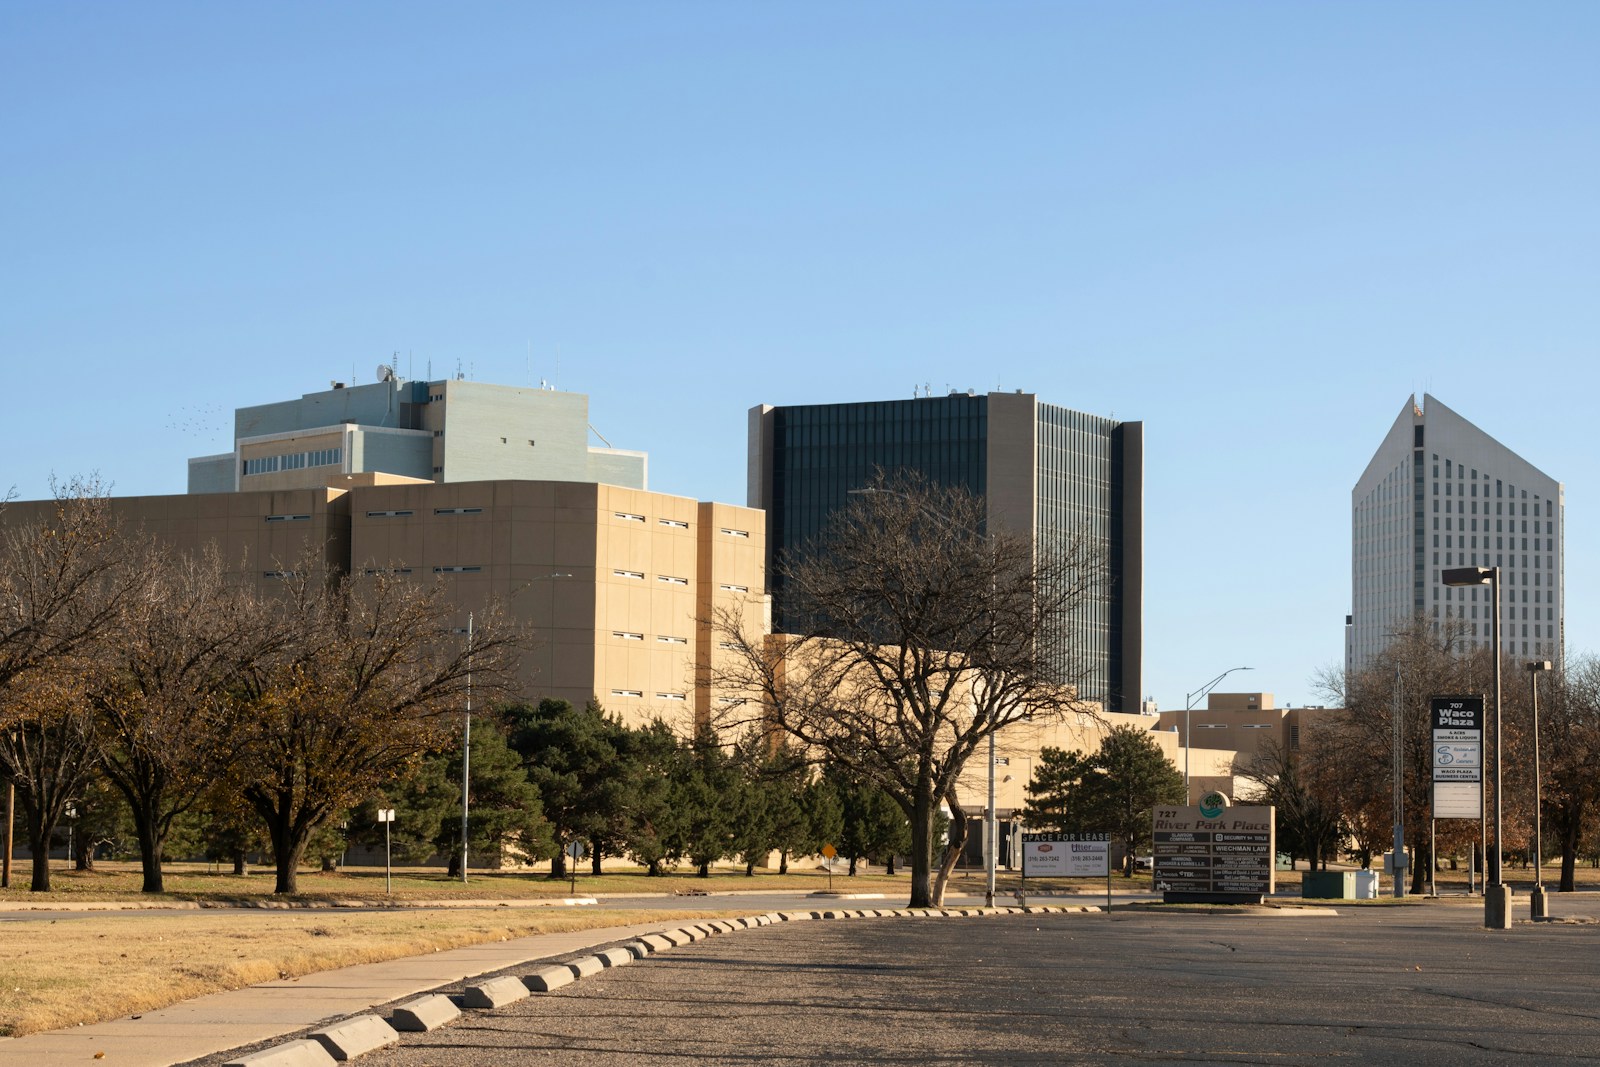
- Percent change in hourly rainfall density, 1970-2024: +38.4%
- Climate region: South