Cities Where Poor People Have the Most Climate Risk
 https://climate-crisis-247-bucket.nyc3.cdn.digitaloceanspaces.com/wp-content/uploads/2024/11/07235834/2990617-150x150.jpeg
In a majority of cities, poor Americans face a greater risk of natural disaster than wealthier ones. When Hurricane Katrina hit New Orleans in 2005, it disproportionately affected low-income communities like the Lower Ninth Ward, where homes were built in low-lying areas with poorly maintained flood control infrastructure.
Whence the next pandemic? Cities Where the Next Pandemic Is Most Likely to Break Out
New border crisis? Climate Change Pushing Vampire Bats North Into Texas
In recent years, climate risk has been increasingly priced into real estate, with platforms like Zillow and Realtor providing climate risk factor scores on property listings. As a result, poor families have become increasingly concentrated in neighborhoods with higher risk of flood, wildfire, and poor air quality. In some cities, the risk of natural disaster is more than three times as high in the poorest quintile of neighborhoods as it is in the wealthiest quintile of neighborhoods. A closer look at the data reveals the cities with the highest climate risk inequality.
To determine the cities where poor people bear the most climate risk, Climate Crisis 247 reviewed tract-level data on income from the U.S. Census Bureau and natural hazard risk data from FEMA. Cities were ranked based on the inferred effect of an additional $10,000 in household income on natural hazard risk, measured as the slope between average household income and FEMA natural hazard risk score. Data on average household income is from the Census Bureau’s 2022 American Community Survey, while data on National Risk Index score is from FEMA. Only cities with at least 200,000 residents and 60 overlapping census tracts were considered.
25. Nashville, TN

- Effect of +$10,000 income on hazard risk score: -0.9
- Most dangerous tract risk score: 99.3/100 (Very high)
- Safest tract risk score: 2.2 (Very low)
24. Honolulu, HI
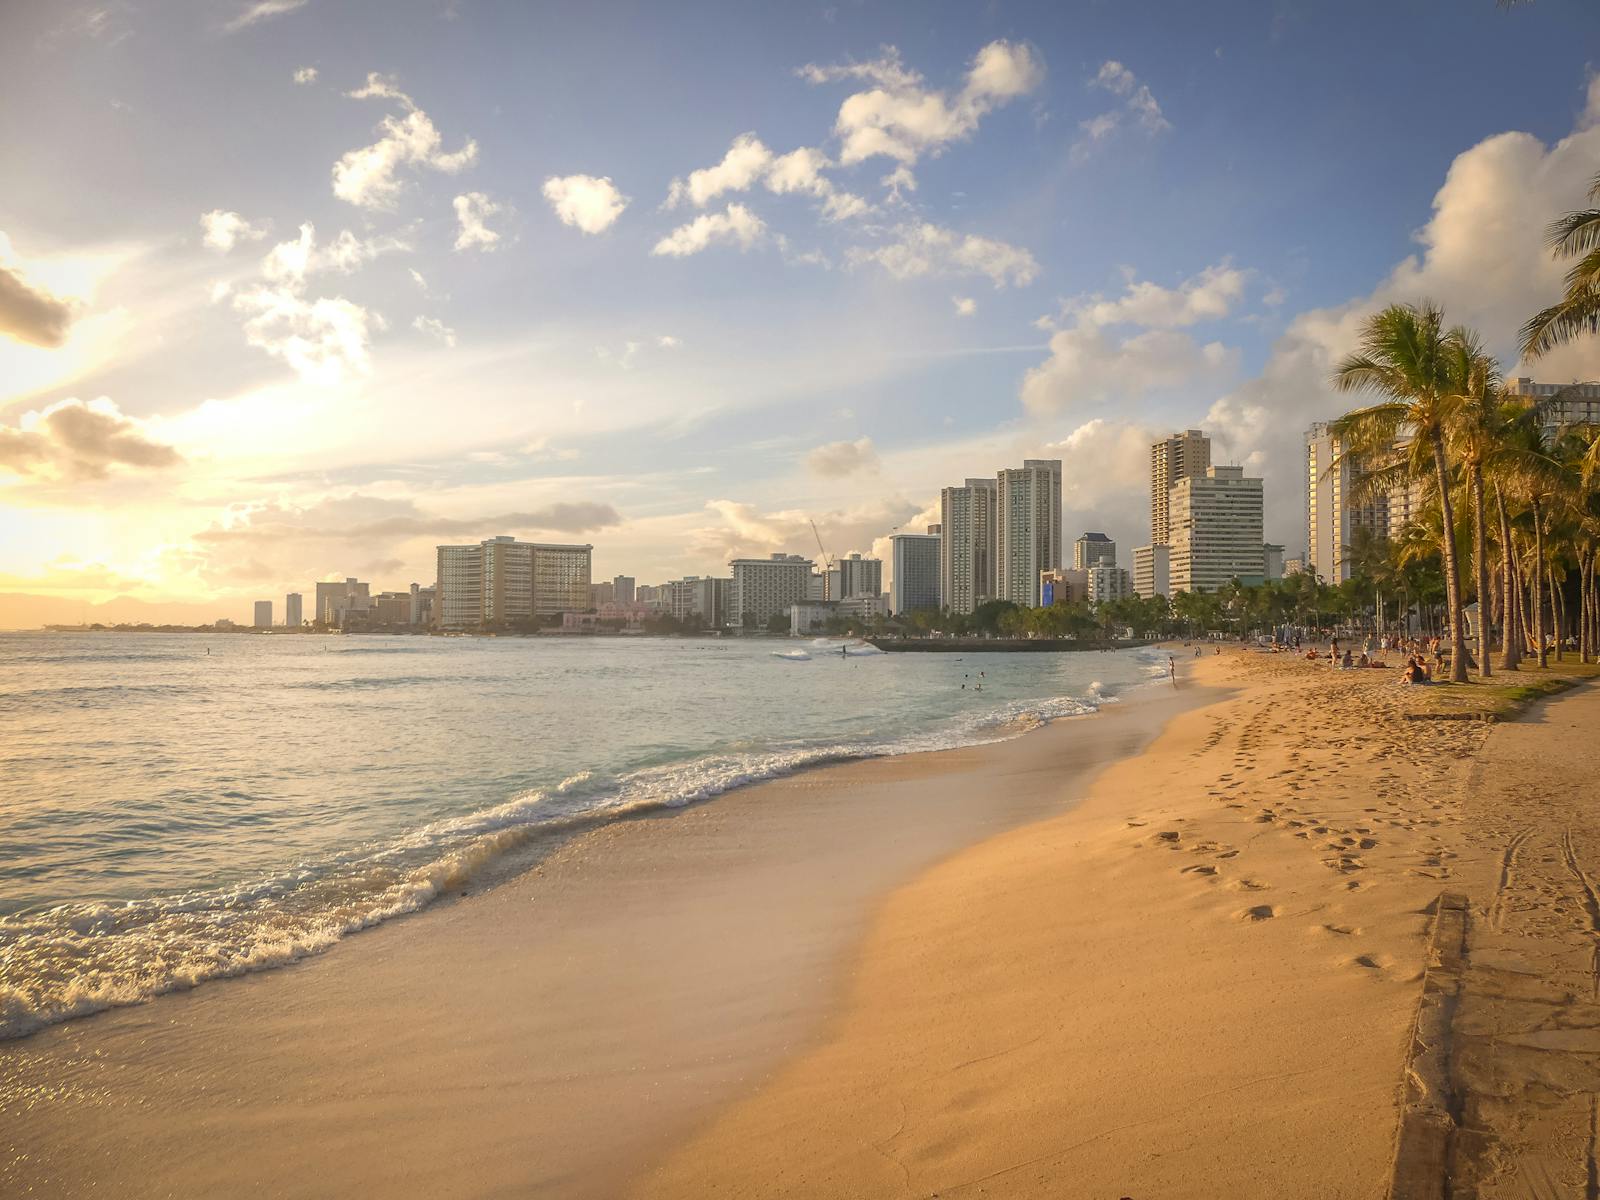
- Effect of +$10,000 income on hazard risk score: -0.9
- Most dangerous tract risk score: 90.7/100 (Relatively high)
- Safest tract risk score: 0.2 (Very low)
23. St. Paul, MN

- Effect of +$10,000 income on hazard risk score: -1.0
- Most dangerous tract risk score: 68.7/100 (Relatively moderate)
- Safest tract risk score: 7.4 (Very low)
22. Riverside, CA
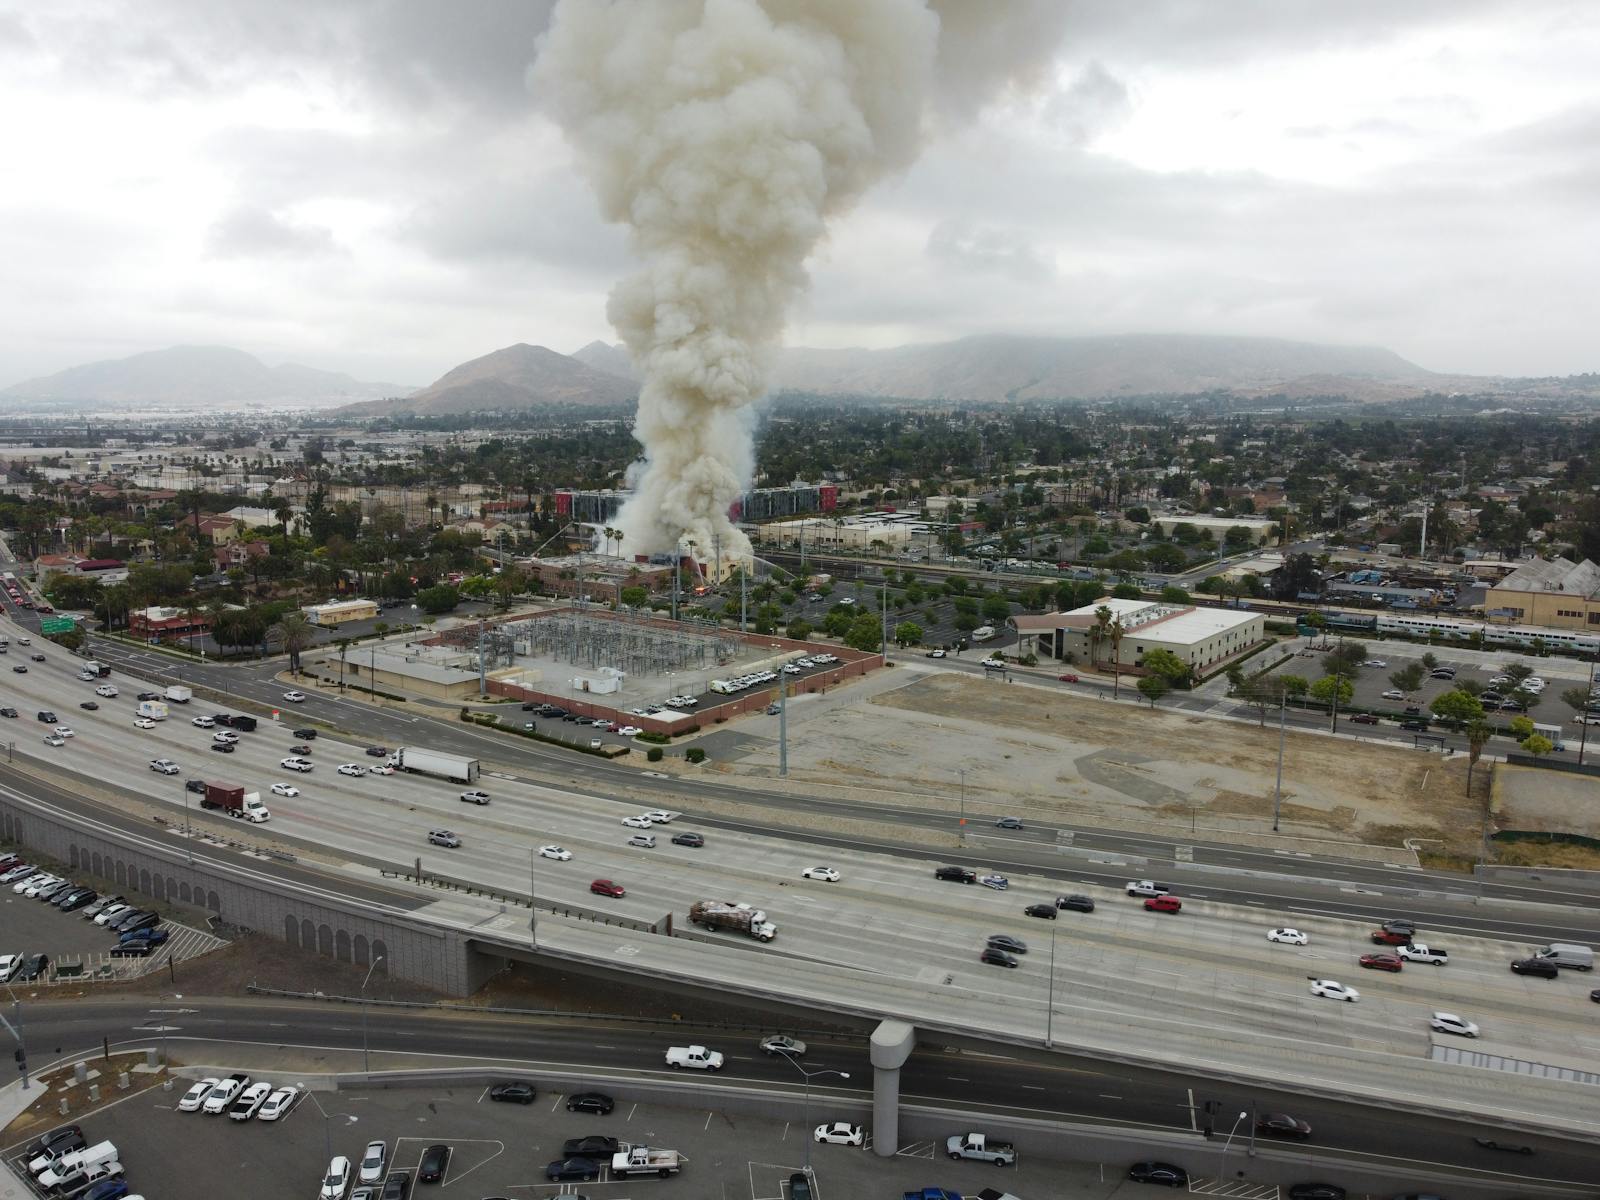
- Effect of +$10,000 income on hazard risk score: -1.0
- Most dangerous tract risk score: 99.8/100 (Very high)
- Safest tract risk score: 27.8 (Relatively low)
21. Henderson, NV
- Effect of +$10,000 income on hazard risk score: -1.0
- Most dangerous tract risk score: 91.1/100 (Relatively high)
- Safest tract risk score: 4.4 (Very low)
20. Long Beach, CA

- Effect of +$10,000 income on hazard risk score: -1.0
- Most dangerous tract risk score: 99.9/100 (Very high)
- Safest tract risk score: 27.5 (Relatively low)
19. Des Moines, IA

- Effect of +$10,000 income on hazard risk score: -1.1
- Most dangerous tract risk score: 82.9/100 (Relatively moderate)
- Safest tract risk score: 1.6 (Very low)
18. Tulsa, OK
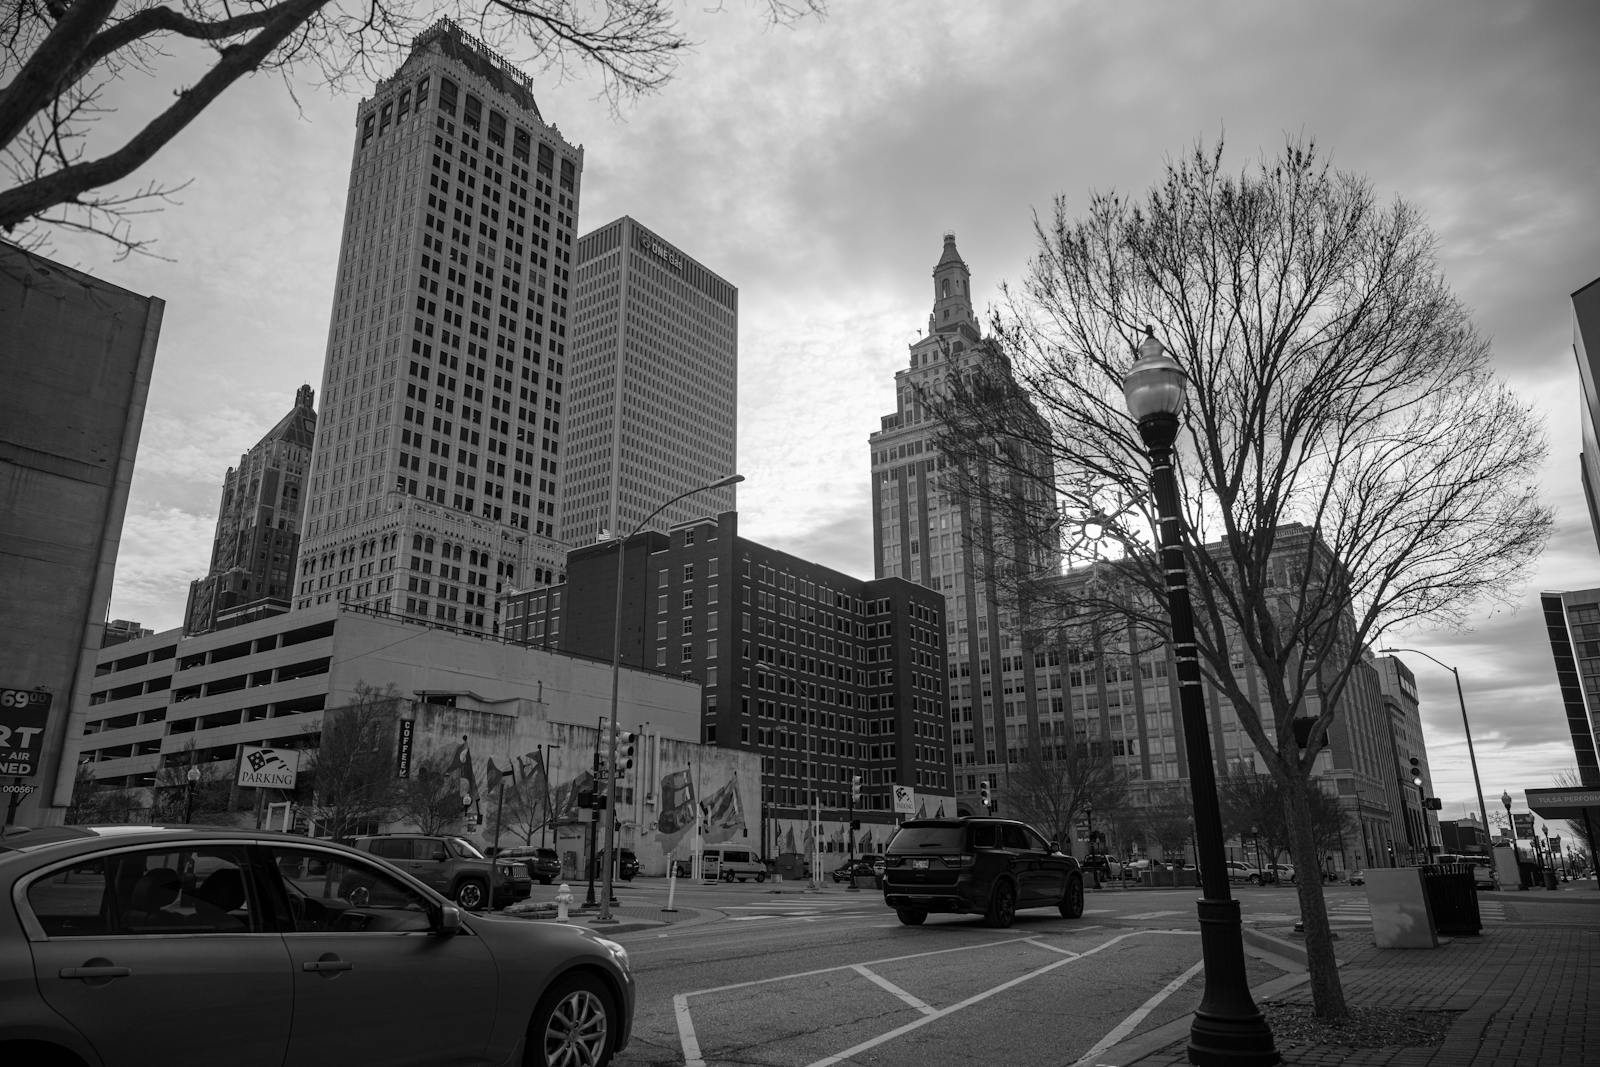
- Effect of +$10,000 income on hazard risk score: -1.2
- Most dangerous tract risk score: 84.0/100 (Relatively moderate)
- Safest tract risk score: 15.1 (Very low)
17. Santa Ana, CA

- Effect of +$10,000 income on hazard risk score: -1.2
- Most dangerous tract risk score: 99.9/100 (Very high)
- Safest tract risk score: 35.5 (Relatively low)
16. Anaheim, CA

- Effect of +$10,000 income on hazard risk score: -1.2
- Most dangerous tract risk score: 99.9/100 (Very high)
- Safest tract risk score: 48.4 (Relatively low)
15. Huntsville, AL

- Effect of +$10,000 income on hazard risk score: -1.2
- Most dangerous tract risk score: 79.9/100 (Relatively moderate)
- Safest tract risk score: 13.9 (Very low)
14. Chandler, AZ
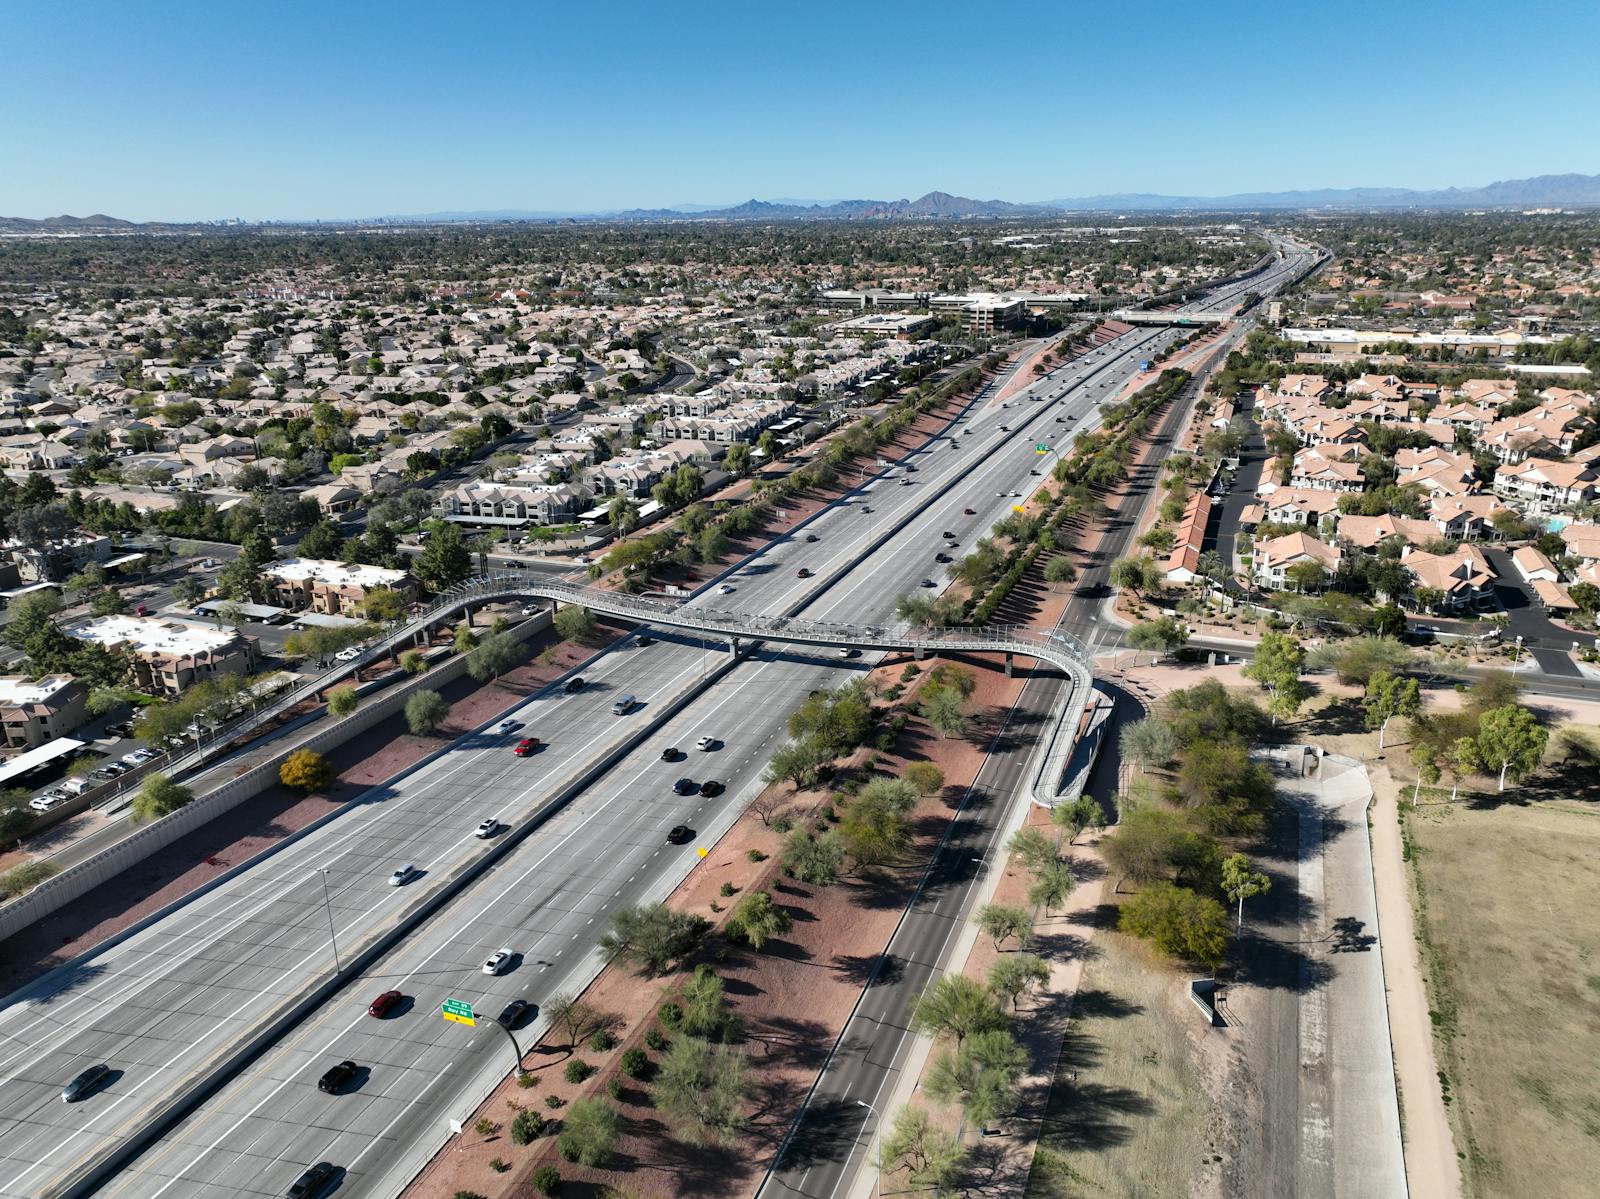
- Effect of +$10,000 income on hazard risk score: -1.3
- Most dangerous tract risk score: 94.5/100 (Relatively high)
- Safest tract risk score: 0.7 (Very low)
13. Tacoma, WA

- Effect of +$10,000 income on hazard risk score: -1.3
- Most dangerous tract risk score: 99.7/100 (Very high)
- Safest tract risk score: 48.0 (Relatively low)
12. Philadelphia, PA
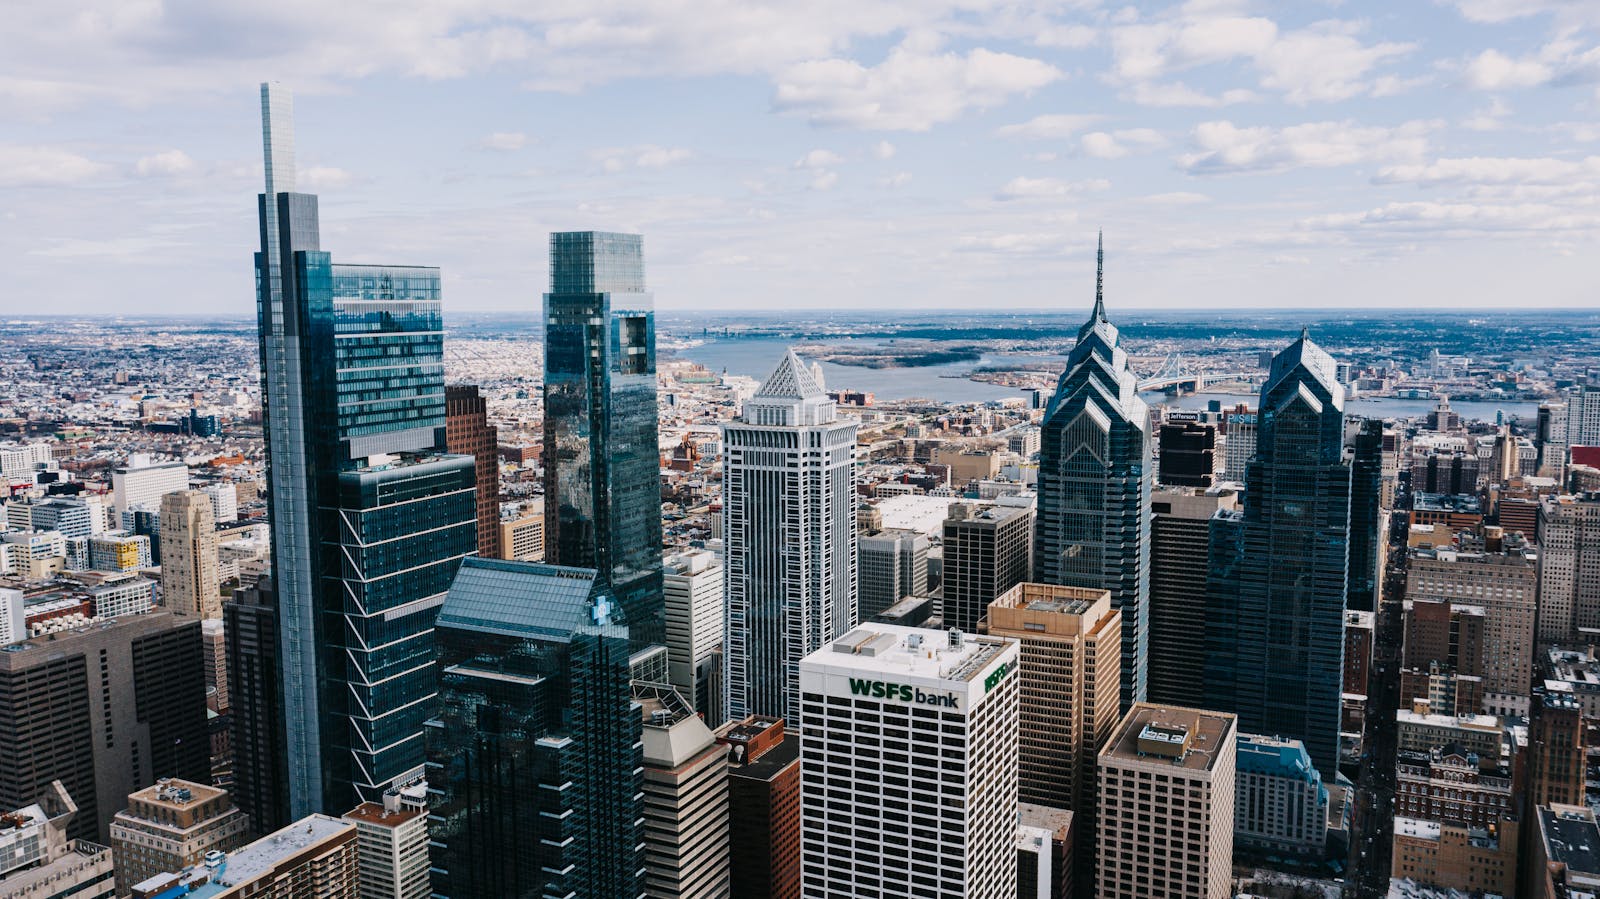
- Effect of +$10,000 income on hazard risk score: -1.4
- Most dangerous tract risk score: 98.2/100 (Very high)
- Safest tract risk score: 0.1 (Very low)
11. Albuquerque, NM

- Effect of +$10,000 income on hazard risk score: -1.5
- Most dangerous tract risk score: 87.2/100 (Relatively high)
- Safest tract risk score: 0.1 (Very low)
10. El Paso, TX
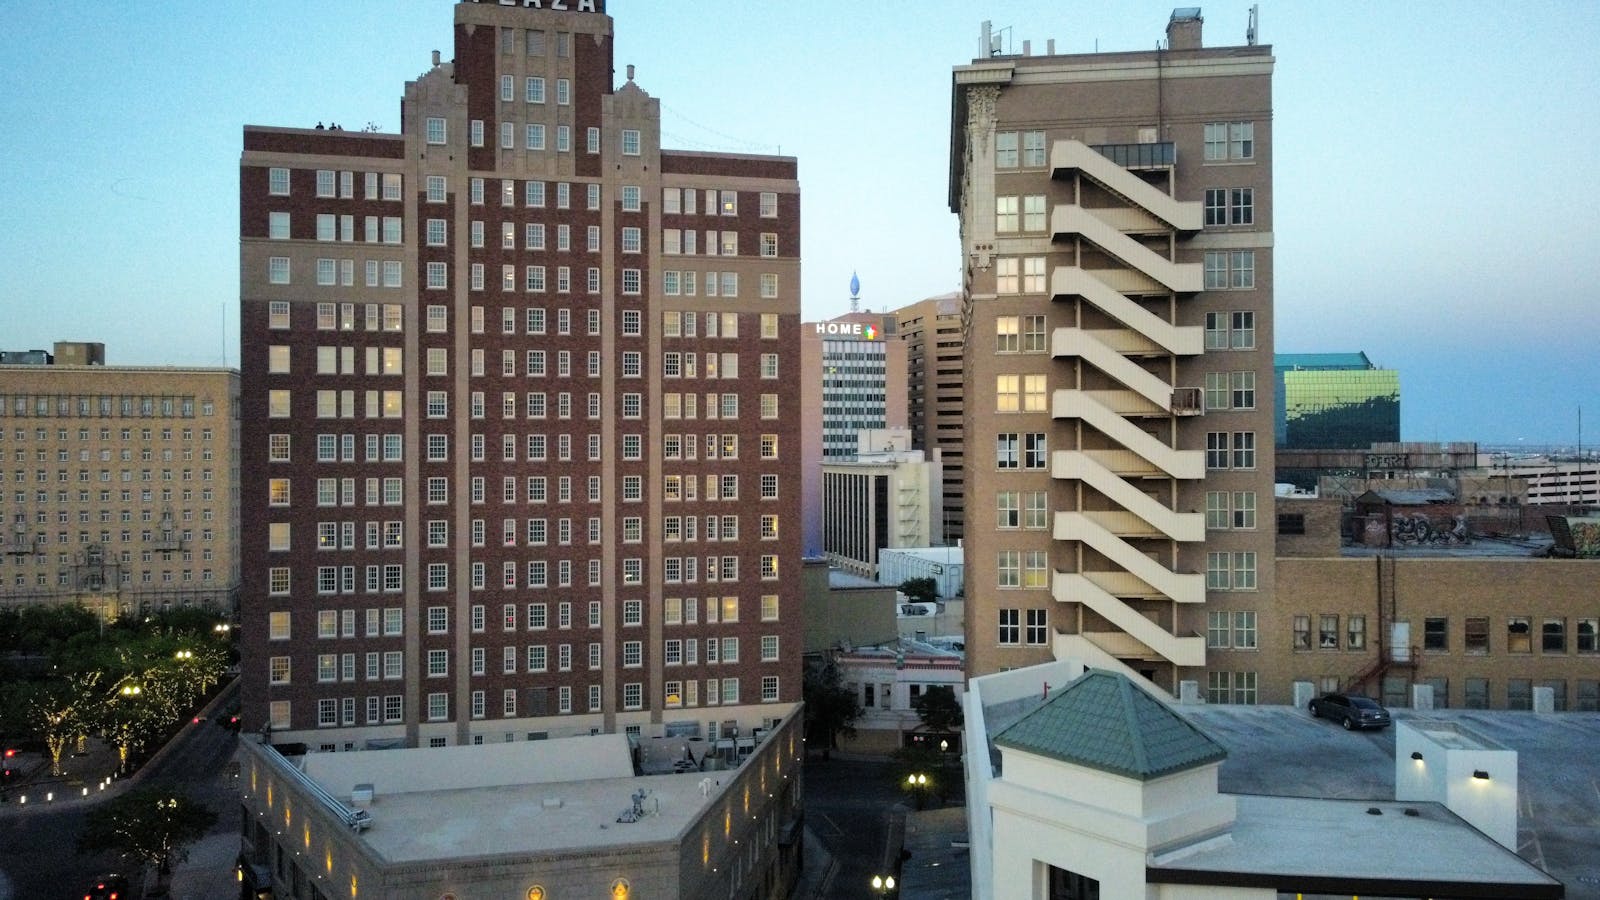
- Effect of +$10,000 income on hazard risk score: -1.6
- Most dangerous tract risk score: 91.8/100 (Relatively high)
- Safest tract risk score: 1.2 (Very low)
9. Lincoln, NE

- Effect of +$10,000 income on hazard risk score: -1.6
- Most dangerous tract risk score: 93.7/100 (Relatively high)
- Safest tract risk score: 1.0 (Very low)
8. Fresno, CA
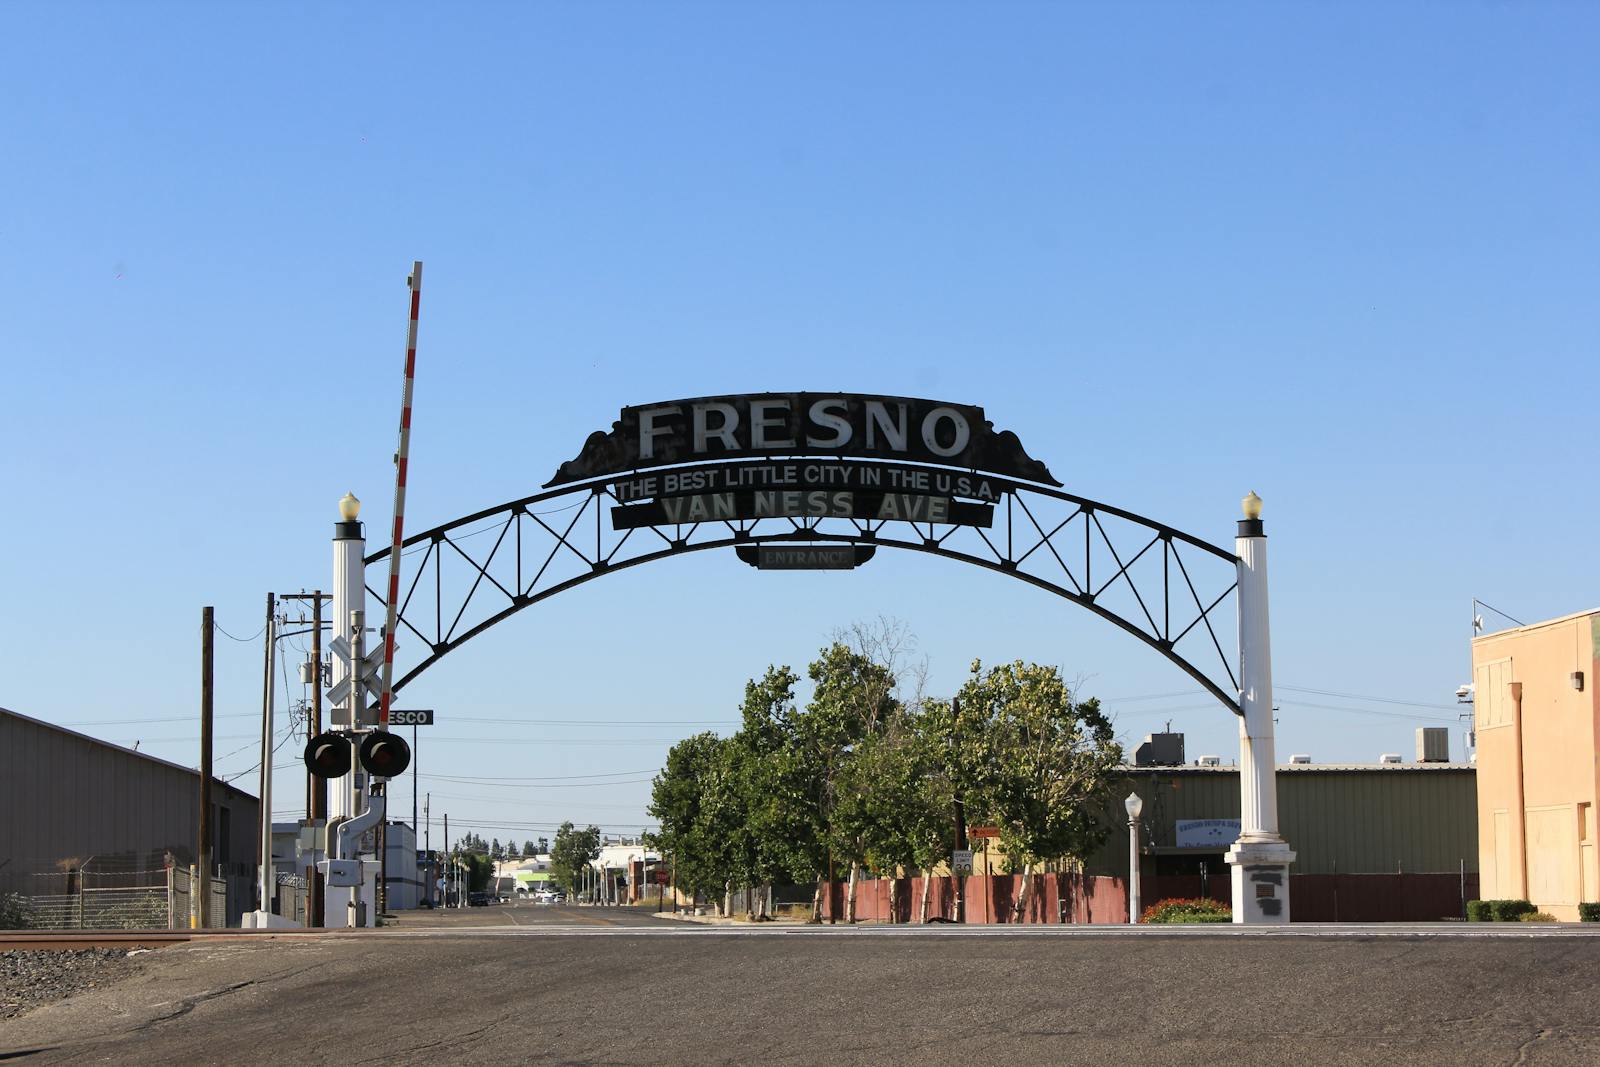
- Effect of +$10,000 income on hazard risk score: -1.6
- Most dangerous tract risk score: 99.9/100 (Very high)
- Safest tract risk score: 2.6 (Very low)
7. Bakersfield, CA

- Effect of +$10,000 income on hazard risk score: -1.6
- Most dangerous tract risk score: 99.7/100 (Very high)
- Safest tract risk score: 9.5 (Very low)
6. Las Vegas, NV

- Effect of +$10,000 income on hazard risk score: -1.8
- Most dangerous tract risk score: 96.6/100 (Relatively high)
- Safest tract risk score: 5.5 (Very low)
5. Portland, OR

- Effect of +$10,000 income on hazard risk score: -2.0
- Most dangerous tract risk score: 99.9/100 (Very high)
- Safest tract risk score: 8.6 (Very low)
4. Modesto, CA

- Effect of +$10,000 income on hazard risk score: -2.3
- Most dangerous tract risk score: 98.5/100 (Very high)
- Safest tract risk score: 16.4 (Very low)
3. Salt Lake City, UT

- Effect of +$10,000 income on hazard risk score: -2.6
- Most dangerous tract risk score: 99.9/100 (Very high)
- Safest tract risk score: 14.4 (Very low)
2. Chula Vista, CA

- Effect of +$10,000 income on hazard risk score: -2.6
- Most dangerous tract risk score: 100.0/100 (Very high)
- Safest tract risk score: 6.9 (Very low)
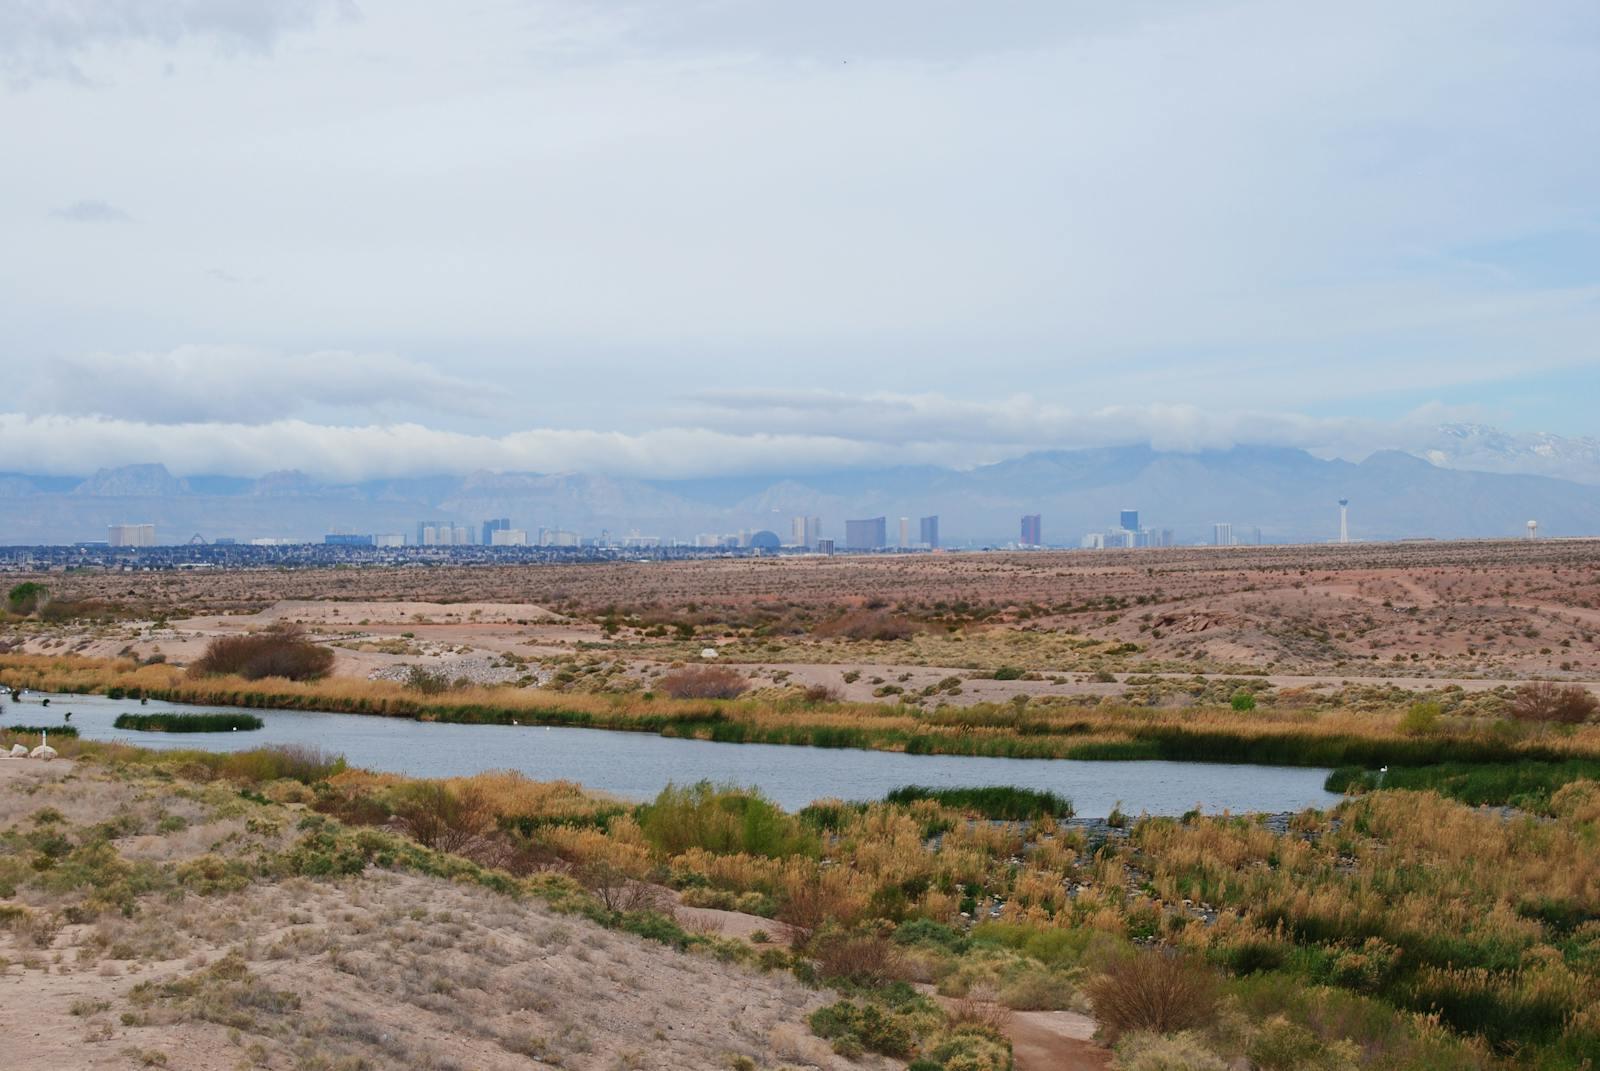
1. North Las Vegas, NV

- Effect of +$10,000 income on hazard risk score: -3.3
- Most dangerous tract risk score: 95.8/100 (Relatively high)
- Safest tract risk score: 8.7 (Very low)
Sponsor
Find a Vetted Financial Advisor
- Finding a fiduciary financial advisor doesn't have to be hard. SmartAsset's free tool matches you with up to 3 financial advisors that serve your area in 5 minutes.
- Each advisor has been vetted by SmartAsset and is held to a fiduciary standard to act in your best interests. Get on the path toward achieving your financial goals!