
Counties Where Coastal Homes Are Flooding the Most; Is Your County on the List?
 https://climate-crisis-247-bucket.nyc3.cdn.digitaloceanspaces.com/wp-content/uploads/2025/08/07204636/County-Level-Concentration-of-National-Flood-Insurance-Multiple-Loss-Properties-150x150.png
According to the government of Dare County, North Carolina, at least 11 homes have collapsed into the Atlantic Ocean in the small beach town of Rodanthe since 2020. As worsening storms and rising sea levels contribute to erosion along the Atlantic Coast, thousands of beach homes are at risk.
Whence the next pandemic? Cities Where the Next Pandemic Is Most Likely to Break Out
Hot property? From Maui to Malibu, These Affluent Enclaves Are Becoming Wildfire Hotspots
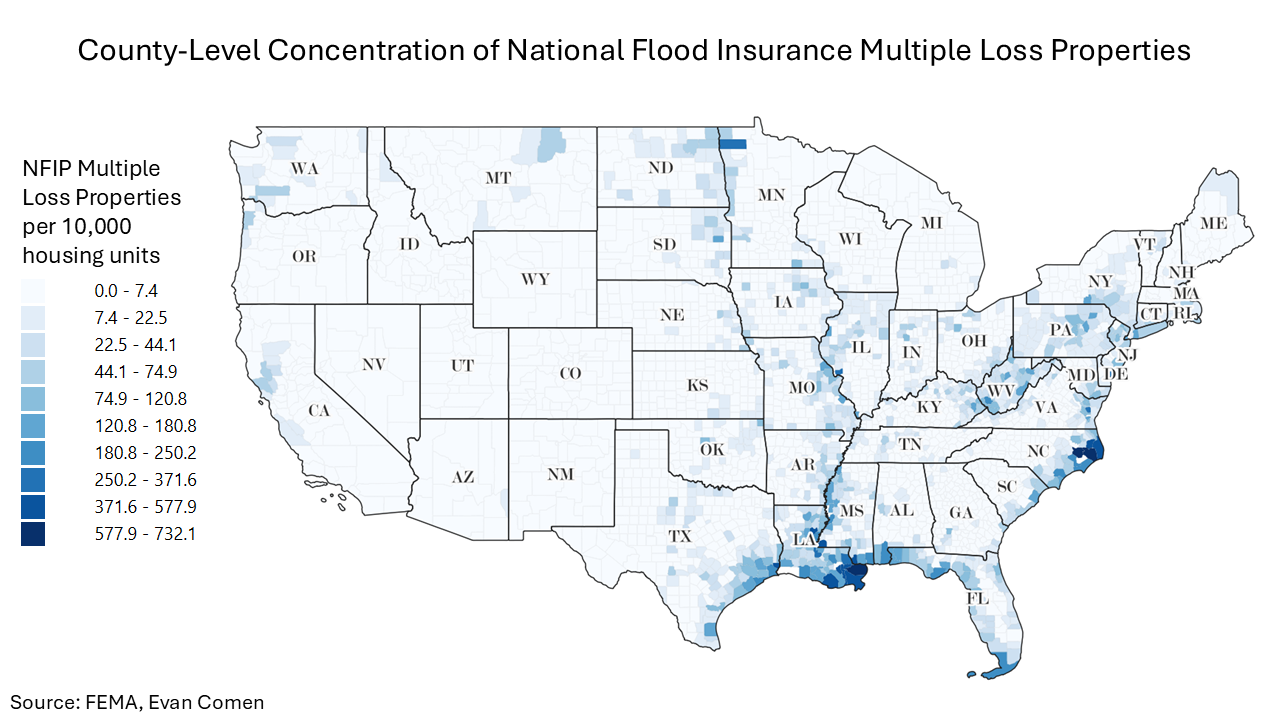
New data from FEMA’s National Flood Insurance Program sheds light on the places facing the most risk. The NFIP tracks properties that file regular flood insurance claims, an indication of systemic flooding. While nationwide there are 17.9 multiple loss properties per 10,000 housing units, in some parts of the country – like Dare County and other communities along the Atlantic and Gulf Coast – have more than 50 times that. A closer look at the data reveals the counties where coastal homes are flooding the most.
To determine where coastal homes are flooding the most, Climate Crisis 247 reviewed data on multiple loss properties from FEMA’s National Flood Insurance Program. Counties were ranked based on the number of multiple loss properties – structures with multiple NFIP claims – per 10,000 housing units. Only coastal counties were included. Supplemental data on population is from the U.S. Census Bureau.
25. Jackson County, MS
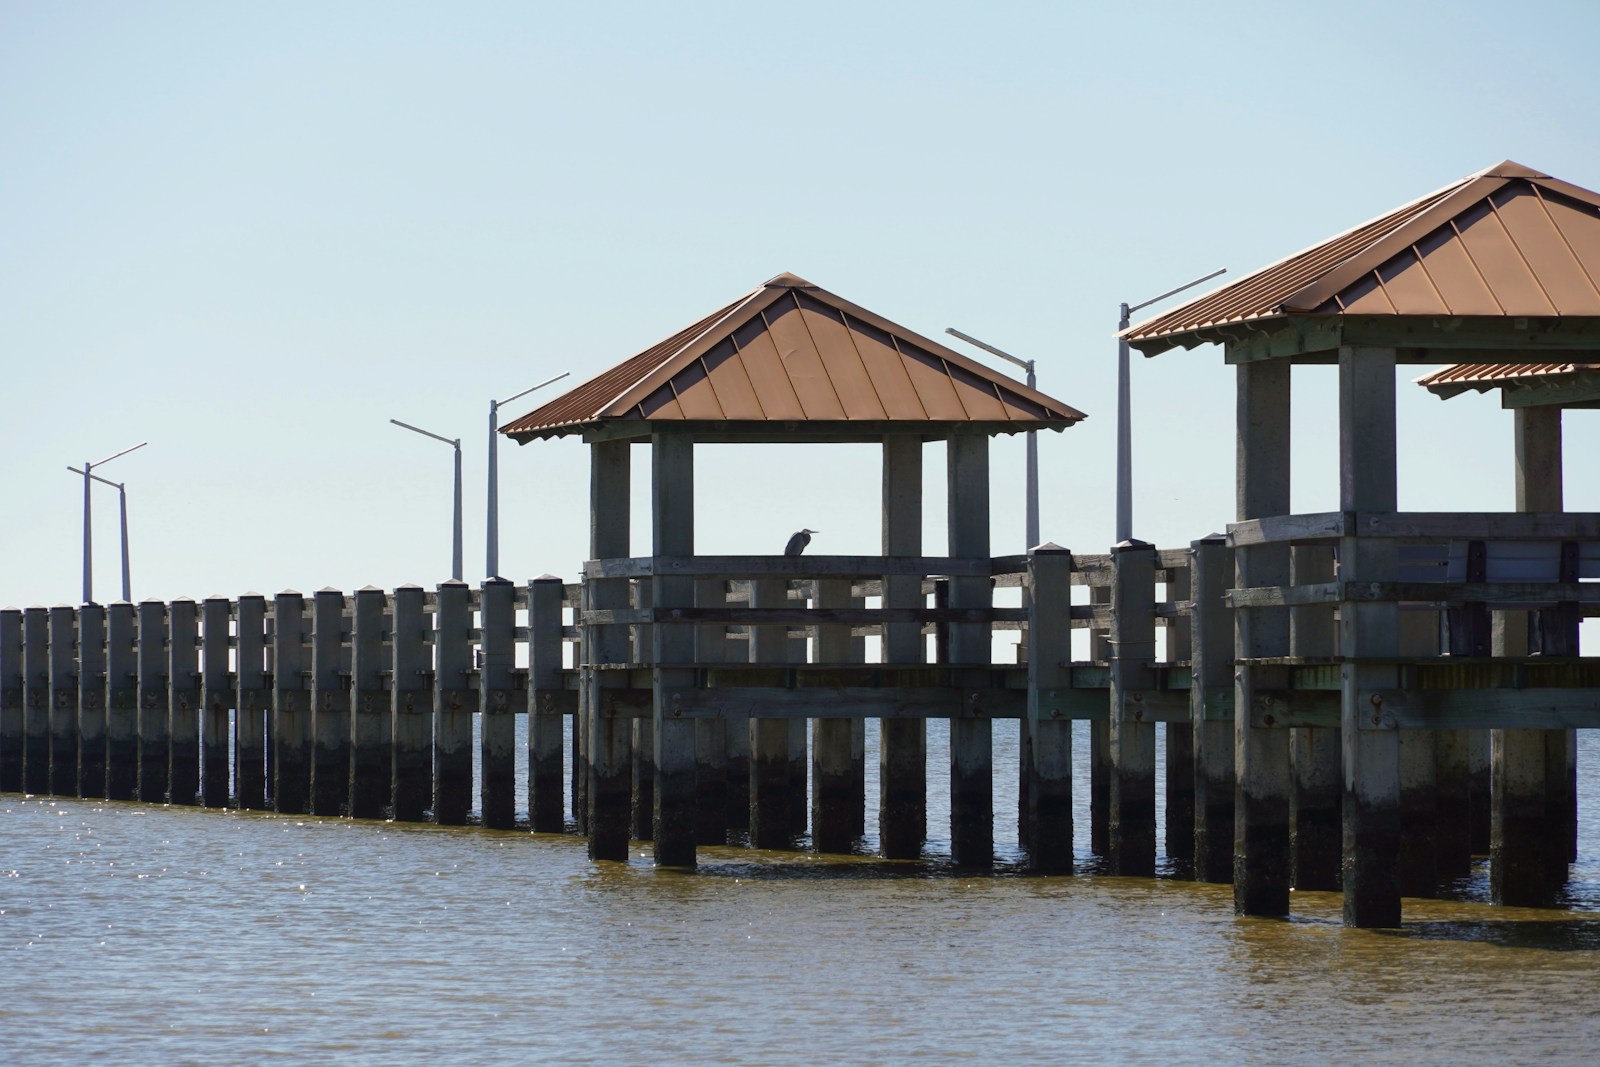
- NFIP multiple loss properties concentration: 234.3 per 10,000 housing units
- NFIP multiple loss properties count: 1,476 structures
- County population: 144,437
- County seat: Pascagoula
24. Livingston Parish, LA

- NFIP multiple loss properties concentration: 241.3 per 10,000 housing units
- NFIP multiple loss properties count: 1,421 structures
- County population: 145,583
- County seat: Livingston
23. Pender County, NC

- NFIP multiple loss properties concentration: 242.2 per 10,000 housing units
- NFIP multiple loss properties count: 751 structures
- County population: 63,475
- County seat: Burgaw
22. Monroe County, FL

- NFIP multiple loss properties concentration: 246.2 per 10,000 housing units
- NFIP multiple loss properties count: 1,340 structures
- County population: 81,840
- County seat: Key West
21. Cape May County, NJ
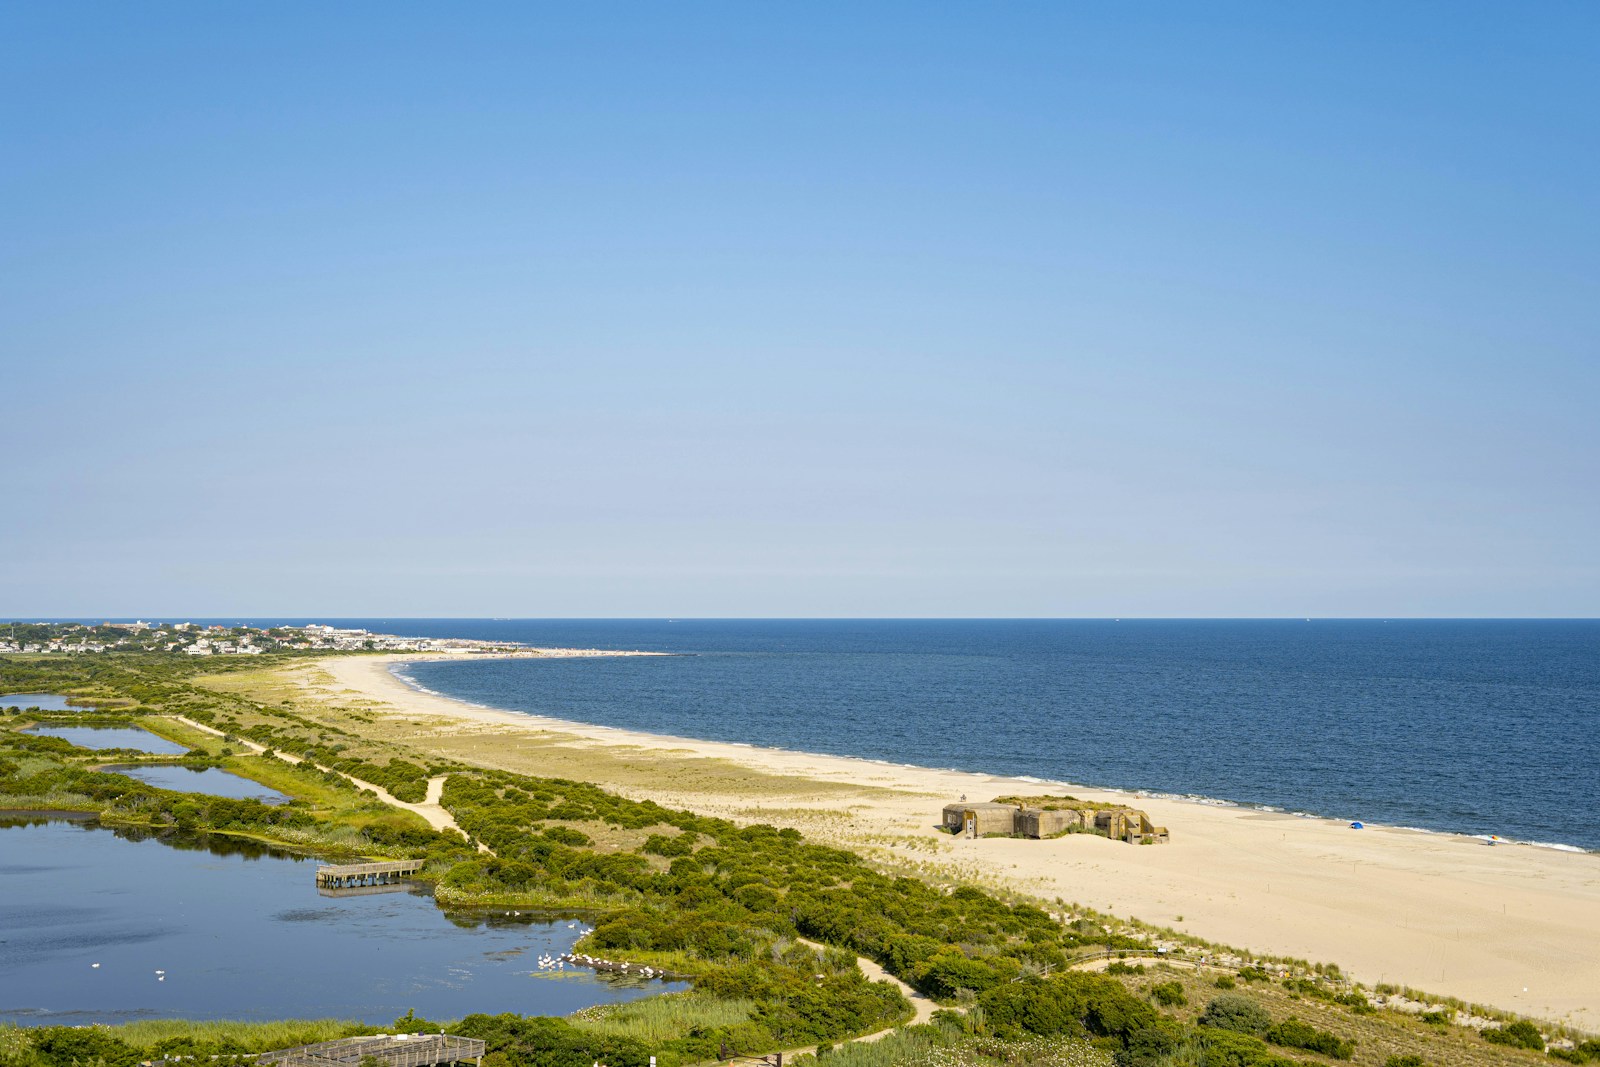
- NFIP multiple loss properties concentration: 286.2 per 10,000 housing units
- NFIP multiple loss properties count: 2,851 structures
- County population: 95,236
- County seat: Cape May
20. Mathews County, VA

- NFIP multiple loss properties concentration: 309.9 per 10,000 housing units
- NFIP multiple loss properties count: 170 structures
- County population: 8,517
- County seat: Mathews
19. Pointe Coupee Parish, LA

- NFIP multiple loss properties concentration: 327.8 per 10,000 housing units
- NFIP multiple loss properties count: 362 structures
- County population: 20,438
- County seat: New Roads
18. St. Tammany Parish, LA

- NFIP multiple loss properties concentration: 371.6 per 10,000 housing units
- NFIP multiple loss properties count: 4,177 structures
- County population: 269,331
- County seat: Covington
17. Terrebonne Parish, LA

- NFIP multiple loss properties concentration: 432.5 per 10,000 housing units
- NFIP multiple loss properties count: 2,043 structures
- County population: 107,362
- County seat: Houma
16. St. Charles Parish, LA

- NFIP multiple loss properties concentration: 436.5 per 10,000 housing units
- NFIP multiple loss properties count: 899 structures
- County population: 51,863
- County seat: Hahnville
15. Wilkinson County, MS

- NFIP multiple loss properties concentration: 437.0 per 10,000 housing units
- NFIP multiple loss properties count: 201 structures
- County population: 8,376
- County seat: Woodville
14. Orleans Parish, LA

- NFIP multiple loss properties concentration: 442.0 per 10,000 housing units
- NFIP multiple loss properties count: 8,608 structures
- County population: 376,035
- County seat: New Orleans
13. Hancock County, MS

- NFIP multiple loss properties concentration: 497.5 per 10,000 housing units
- NFIP multiple loss properties count: 1,158 structures
- County population: 46,057
- County seat: Bay St. Louis
12. Dare County, NC

- NFIP multiple loss properties concentration: 502.0 per 10,000 housing units
- NFIP multiple loss properties count: 1,749 structures
- County population: 37,534
- County seat: Manteo
11. Tyrrell County, NC

- NFIP multiple loss properties concentration: 519.0 per 10,000 housing units
- NFIP multiple loss properties count: 104 structures
- County population: 3,376
- County seat: Columbia
10. Plaquemines Parish, LA

- NFIP multiple loss properties concentration: 536.1 per 10,000 housing units
- NFIP multiple loss properties count: 516 structures
- County population: 23,070
- County seat: Pointe à la Hache
9. Jefferson Parish, LA

- NFIP multiple loss properties concentration: 542.5 per 10,000 housing units
- NFIP multiple loss properties count: 10,531 structures
- County population: 432,484
- County seat: Gretna
8. Catahoula Parish, LA

- NFIP multiple loss properties concentration: 577.9 per 10,000 housing units
- NFIP multiple loss properties count: 257 structures
- County population: 8,738
- County seat: Harrisonburg
7. Beaufort County, NC
- NFIP multiple loss properties concentration: 672.5 per 10,000 housing units
- NFIP multiple loss properties count: 1,640 structures
- County population: 44,597
- County seat: Washington
6. Hyde County, NC

- NFIP multiple loss properties concentration: 703.9 per 10,000 housing units
- NFIP multiple loss properties count: 223 structures
- County population: 4,625
- County seat: Swan Quarter
5. St. Bernard Parish, LA

- NFIP multiple loss properties concentration: 732.1 per 10,000 housing units
- NFIP multiple loss properties count: 1,318 structures
- County population: 44,172
- County seat: Chalmette
4. St. John the Baptist Parish, LA

- NFIP multiple loss properties concentration: 1,418.2 per 10,000 housing units
- NFIP multiple loss properties count: 2,523 structures
- County population: 41,342
- County seat: Edgard
3. Pamlico County, NC
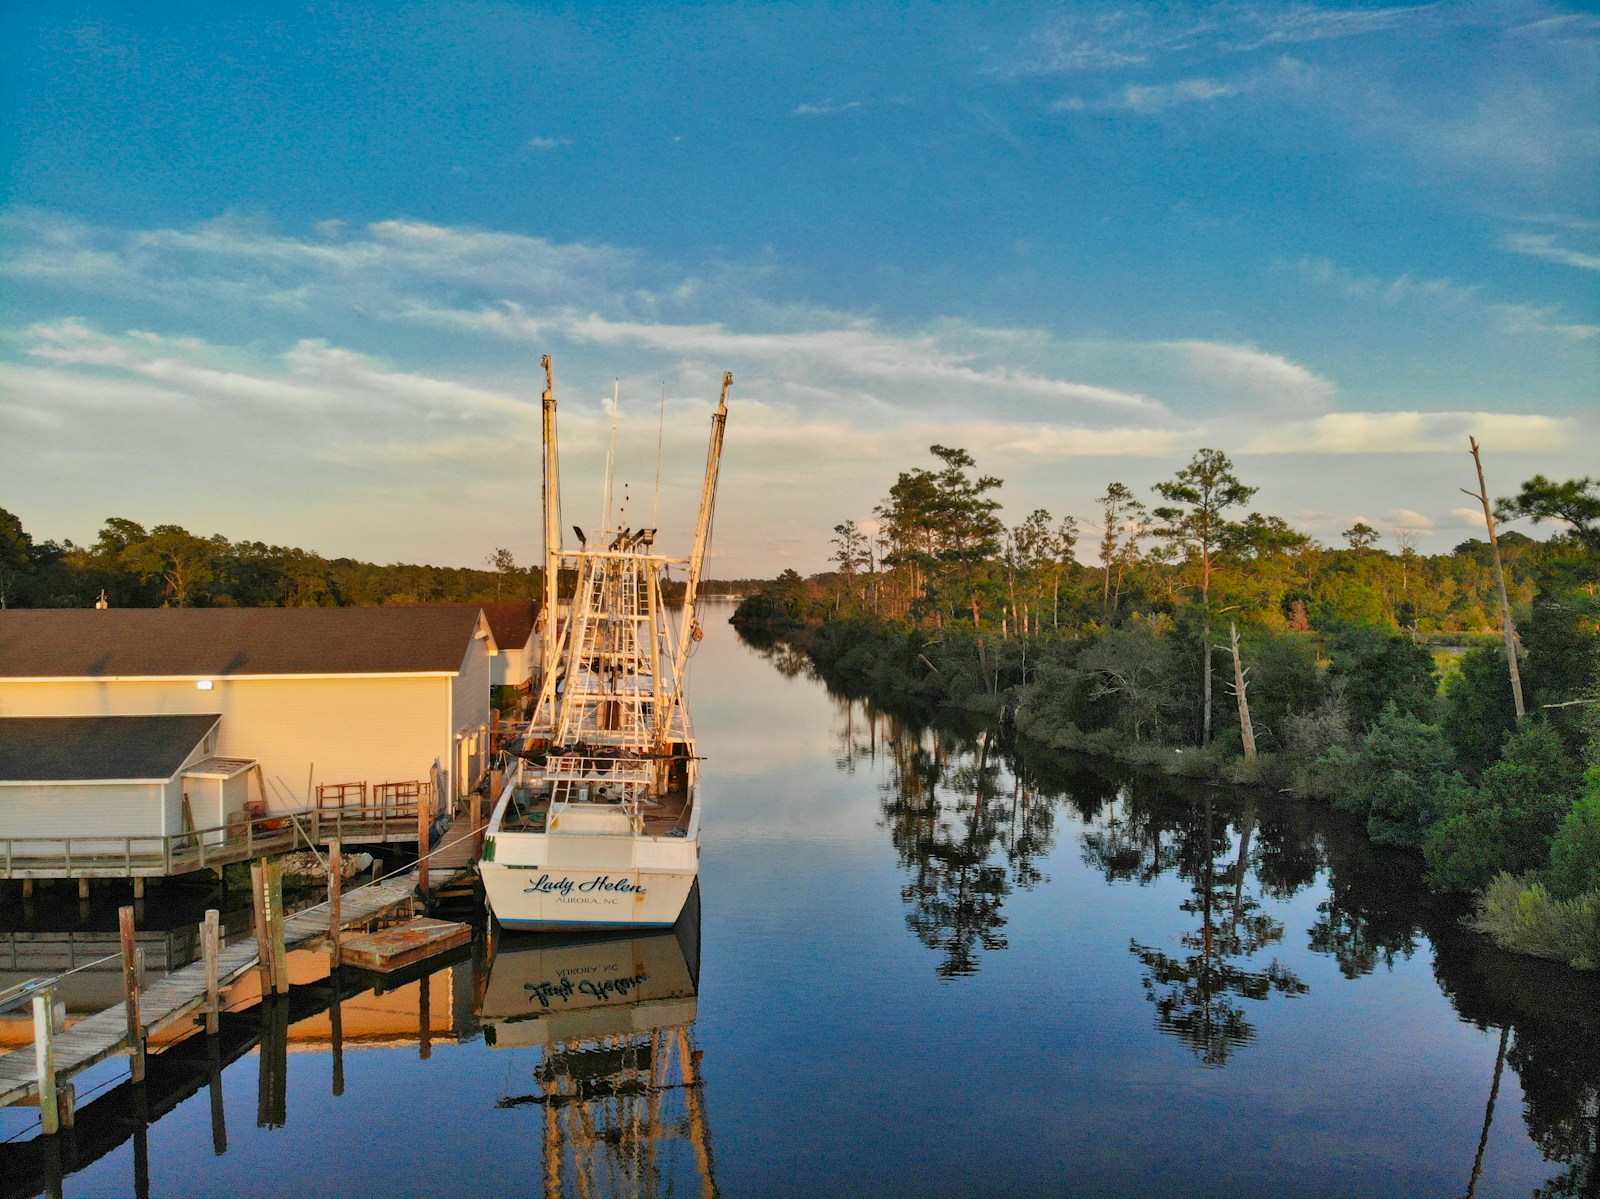
- NFIP multiple loss properties concentration: 1,446.3 per 10,000 housing units
- NFIP multiple loss properties count: 1,047 structures
- County population: 12,315
- County seat: Bayboro
2. Cameron Parish, LA

- NFIP multiple loss properties concentration: 1,502.8 per 10,000 housing units
- NFIP multiple loss properties count: 518 structures
- County population: 5,222
- County seat: Cameron
1. Poquoson city, VA

- NFIP multiple loss properties concentration: 2,000.0 per 10,000 housing units
- NFIP multiple loss properties count: 989 structures
- County population: 12,556
- County seat: Poquoson