From Philadelphia to Seattle, Heat Waves Are Getting Worse and More Frequent in These US Cities
 https://climate-crisis-247-bucket.nyc3.cdn.digitaloceanspaces.com/wp-content/uploads/2024/11/07235115/196663-150x150.jpeg
This past summer, several major heat waves smashed heat records from coast to coast across the United States. A brutal heat dome plagued New York City, causing train delays and hundreds of heat-related deaths, while temperatures in Palm Springs reached 124°F for the first time in recorded history. By the end of September, there were 342 deaths in Las Vegas linked to prolonged triple-digit temperatures, the most in city history.
Hiking plans? Lyme Disease Is Exploding in These Areas Due To Climate Change
Whence the next pandemic? Cities Where the Next Pandemic Is Most Likely to Break Out
Heat waves have gotten longer, more intense, and more frequent in nearly every major city in the last 50 years. The length of the average heat wave rose from 3.0 days in the 1960s to 4.3 days in the 2020s, while the average temperature anomaly rose from 1.9°F above local thresholds to 2.5°F above local thresholds. A look at new NOAA data reveals the cities where heat waves have worsened the most in the last 50 years.
To determine the cities where heat waves are getting worse, Climate Crisis 247 reviewed data on heat wave characteristics from the NOAA provided to the EPA in April 2024. The 50 largest U.S. cities were ranked based on the change in the average length of a heat wave – defined as a period of two or more consecutive days when the daily minimum apparent temperature in a particular city exceeds the 85th percentile of historical July and August temperatures from 1981 to 2010 for that city – from 1961 to 2023. Supplemental data on the change in average heat wave temperature and the number of heat waves that occur every year are also from the EPA and based on NOAA data.
15. Philadelphia, PA

- Change in average heat wave duration, 1961 to 2023: +2.0 days
- Change in average heat wave temperature, 1961 to 2023: +1.6°F
- Change in number of heat waves per year, 1961 to 2023: +4.4 occurrences
- Total population: 1,593,208
14. Raleigh, NC
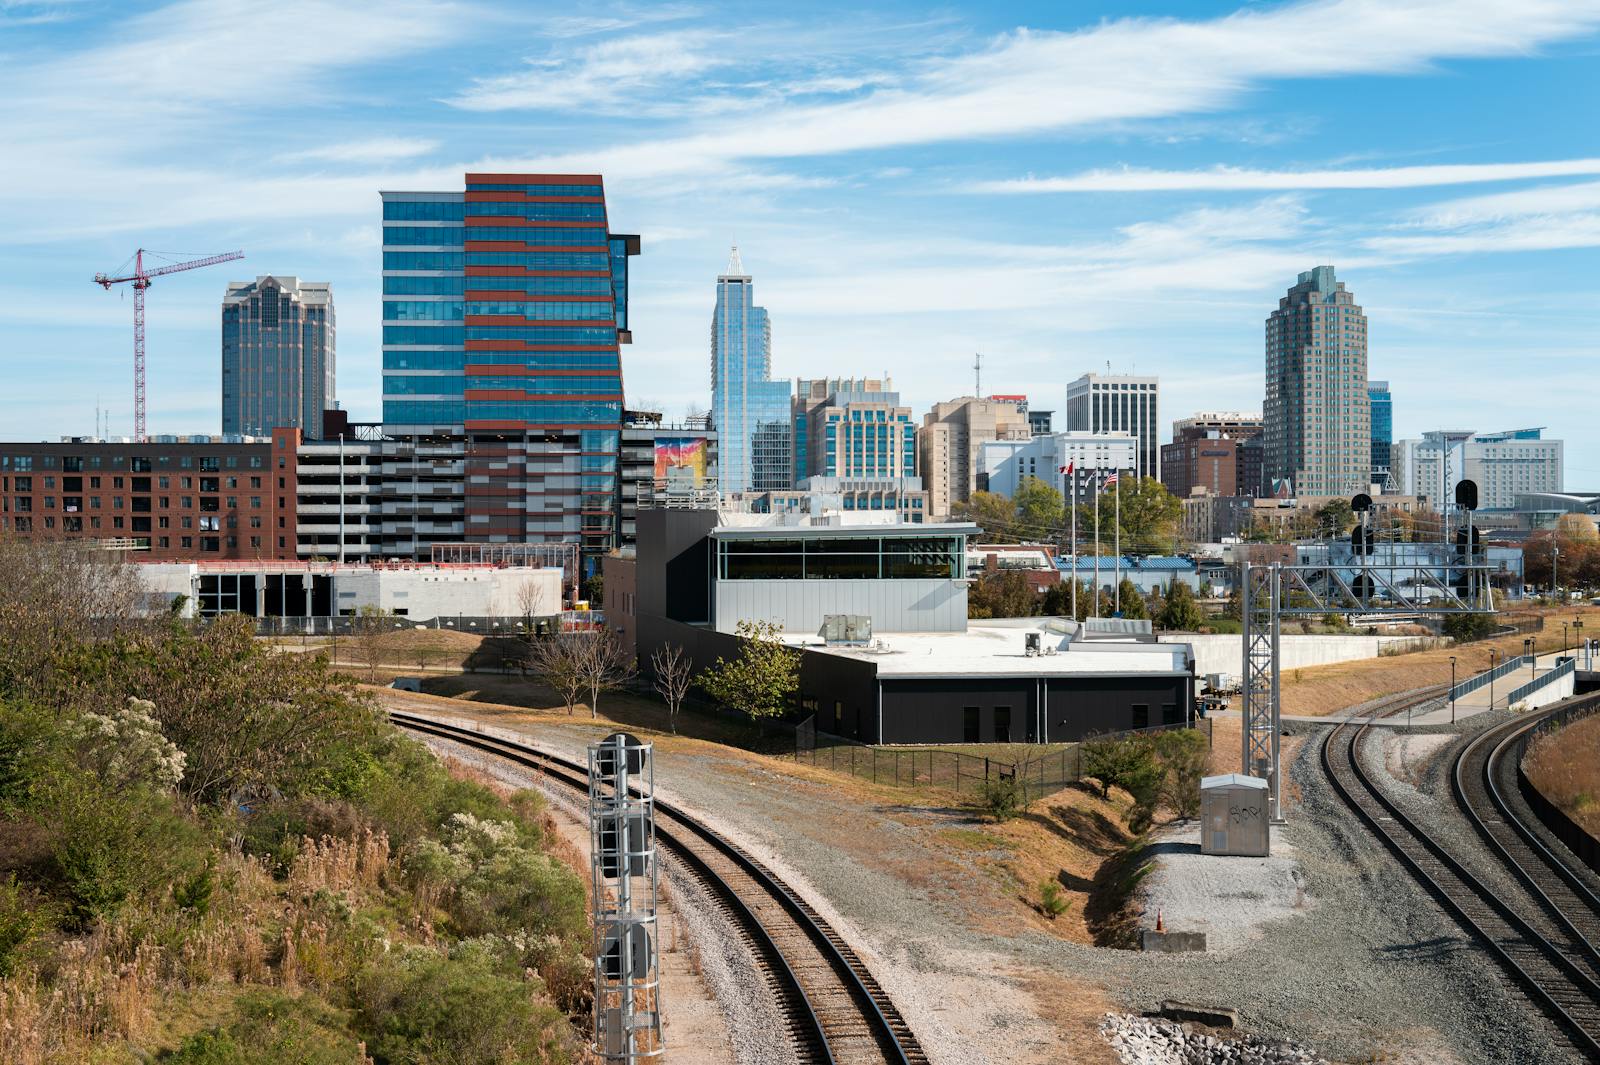
- Change in average heat wave duration, 1961 to 2023: +2.1 days
- Change in average heat wave temperature, 1961 to 2023: +0.9°F
- Change in number of heat waves per year, 1961 to 2023: +5.4 occurrences
- Total population: 465,517
13. Norfolk, VA

- Change in average heat wave duration, 1961 to 2023: +2.1 days
- Change in average heat wave temperature, 1961 to 2023: +0.3°F
- Change in number of heat waves per year, 1961 to 2023: +5.8 occurrences
- Total population: 236,973
12. Phoenix, AZ

- Change in average heat wave duration, 1961 to 2023: +2.1 days
- Change in average heat wave temperature, 1961 to 2023: +1.2°F
- Change in number of heat waves per year, 1961 to 2023: +5.7 occurrences
- Total population: 1,609,456
11. Atlanta, GA
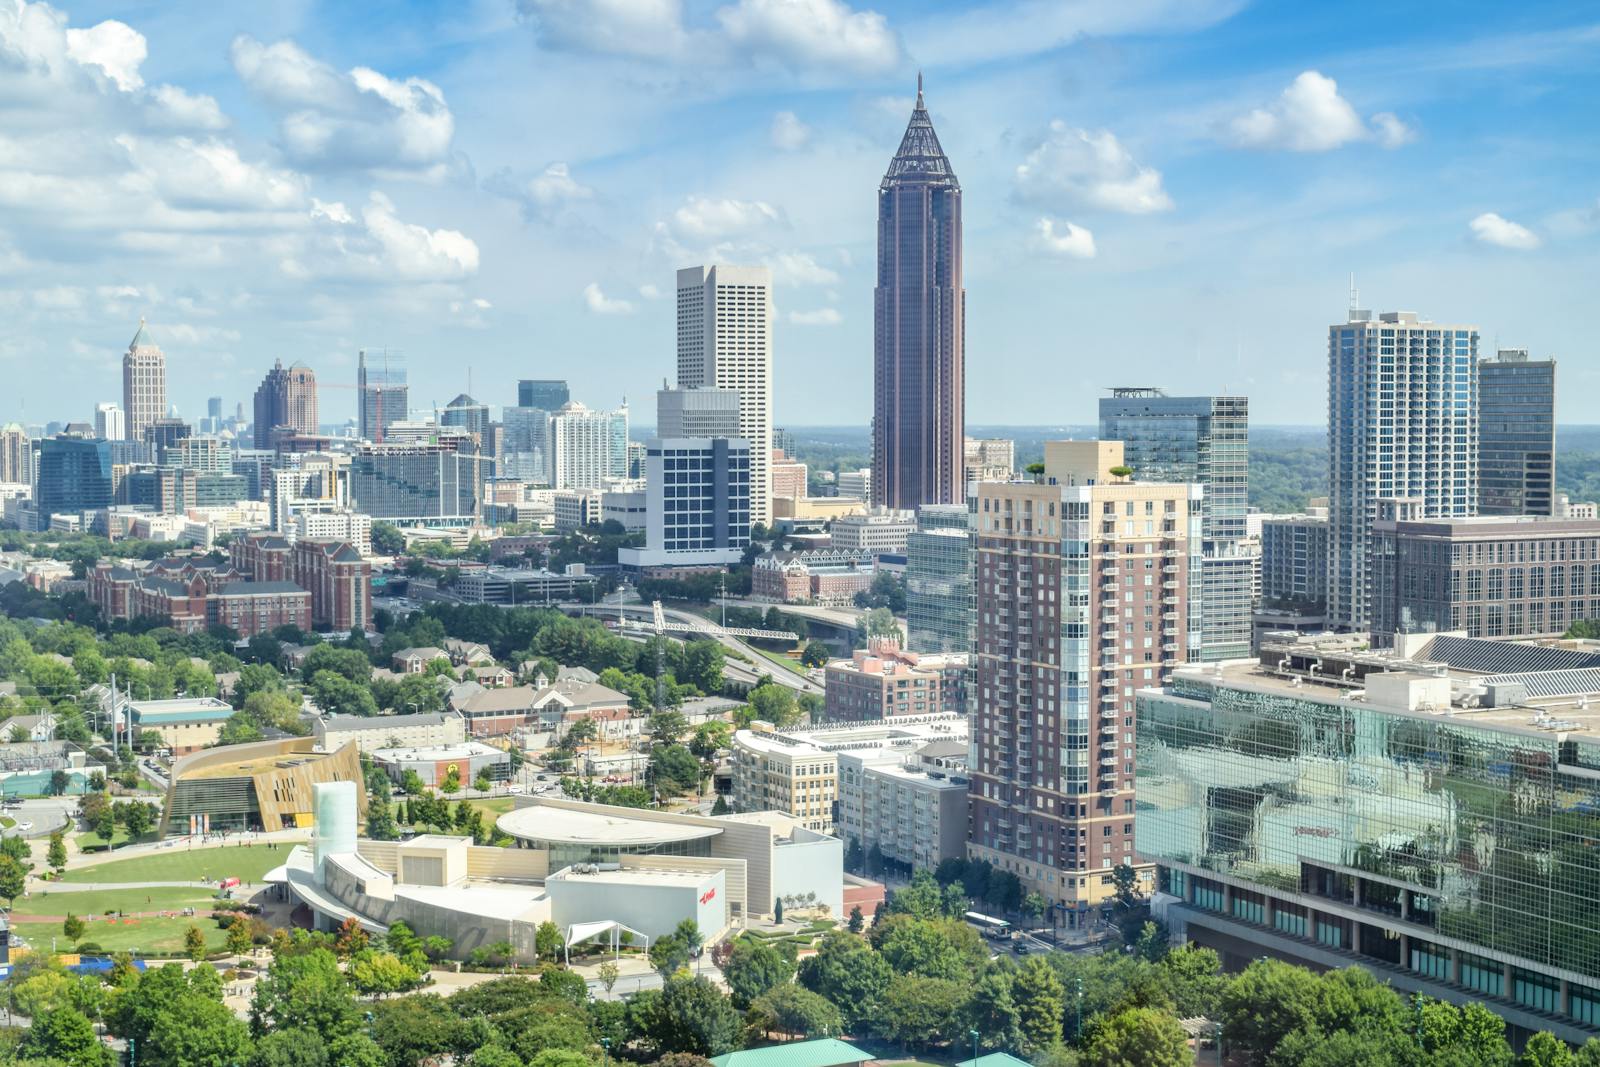
- Change in average heat wave duration, 1961 to 2023: +2.1 days
- Change in average heat wave temperature, 1961 to 2023: +0.4°F
- Change in number of heat waves per year, 1961 to 2023: +6.6 occurrences
- Total population: 494,838
10. Seattle, WA

- Change in average heat wave duration, 1961 to 2023: +2.1 days
- Change in average heat wave temperature, 1961 to 2023: +0.3°F
- Change in number of heat waves per year, 1961 to 2023: +4.7 occurrences
- Total population: 734,603
9. Los Angeles, CA
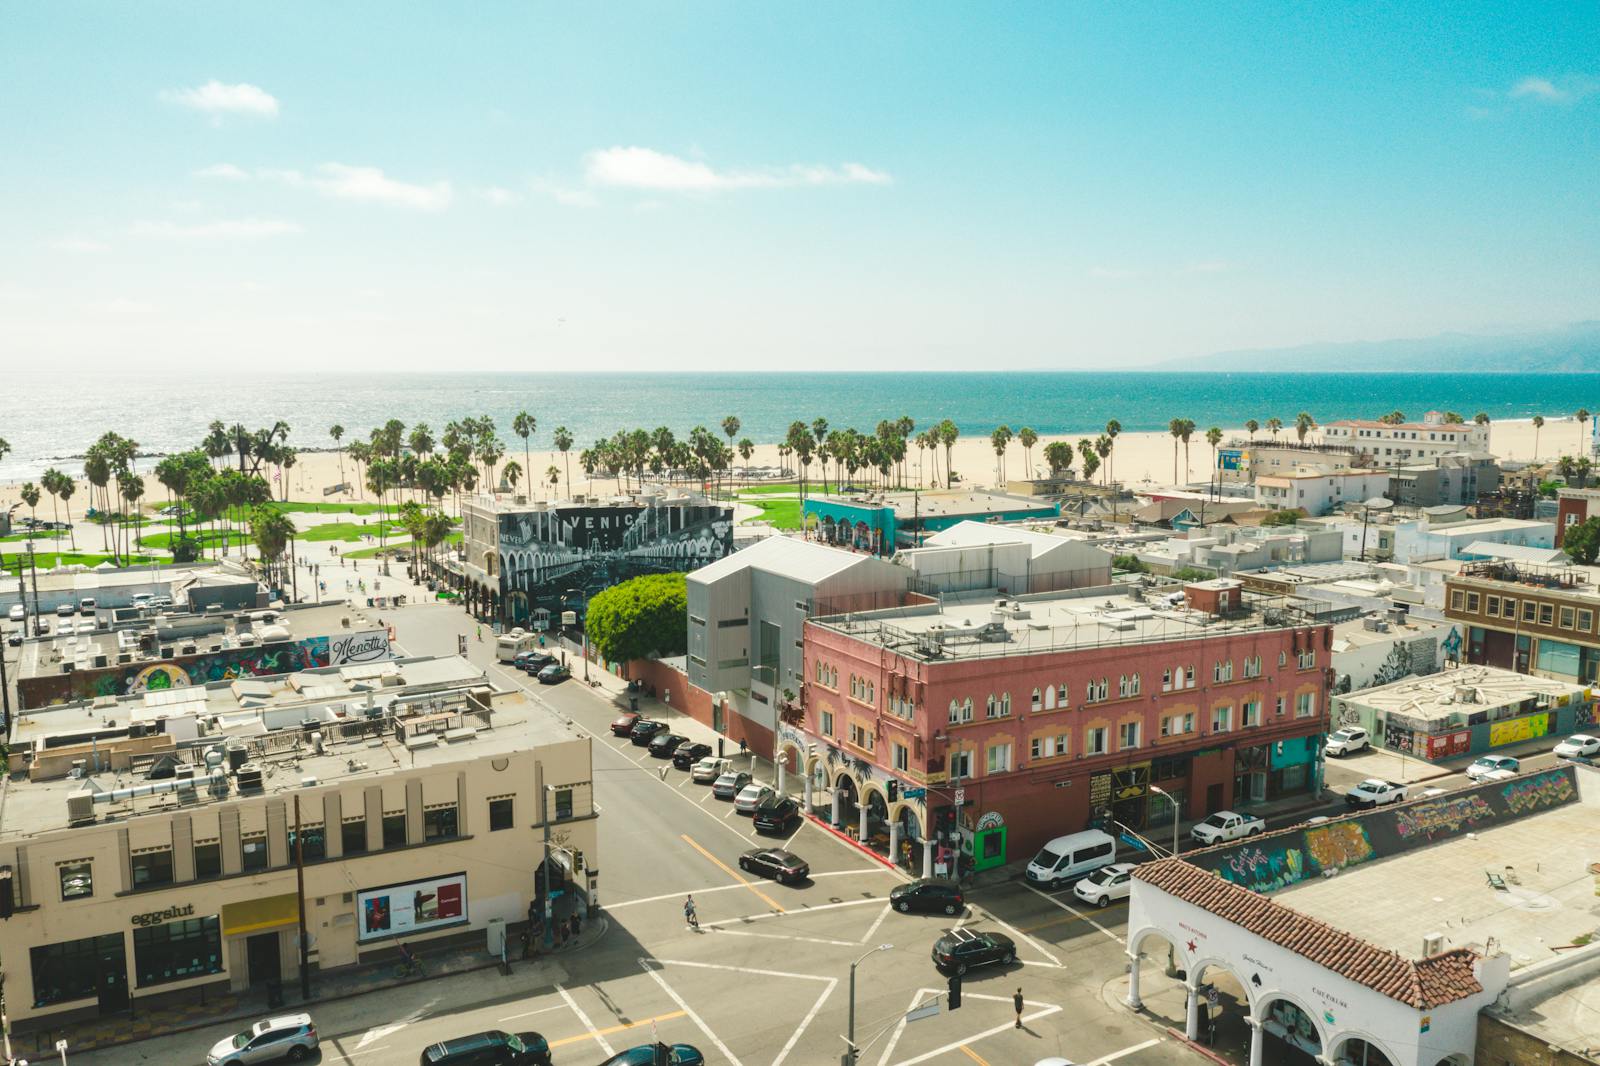
- Change in average heat wave duration, 1961 to 2023: +2.2 days
- Change in average heat wave temperature, 1961 to 2023: +0.4°F
- Change in number of heat waves per year, 1961 to 2023: +1.5 occurrences
- Total population: 3,881,041
8. Fresno, CA

- Change in average heat wave duration, 1961 to 2023: +2.3 days
- Change in average heat wave temperature, 1961 to 2023: +0.8°F
- Change in number of heat waves per year, 1961 to 2023: +4.6 occurrences
- Total population: 541,528
7. Tampa, FL

- Change in average heat wave duration, 1961 to 2023: +2.4 days
- Change in average heat wave temperature, 1961 to 2023: +0.6°F
- Change in number of heat waves per year, 1961 to 2023: +10.4 occurrences
- Total population: 388,768
6. Birmingham, AL

- Change in average heat wave duration, 1961 to 2023: +2.5 days
- Change in average heat wave temperature, 1961 to 2023: +0.5°F
- Change in number of heat waves per year, 1961 to 2023: +5.7 occurrences
- Total population: 200,431
5. San Francisco, CA

- Change in average heat wave duration, 1961 to 2023: +3.0 days
- Change in average heat wave temperature, 1961 to 2023: +0.2°F
- Change in number of heat waves per year, 1961 to 2023: +7.6 occurrences
- Total population: 851,036
4. Las Vegas, NV

- Change in average heat wave duration, 1961 to 2023: +3.3 days
- Change in average heat wave temperature, 1961 to 2023: +1.1°F
- Change in number of heat waves per year, 1961 to 2023: +5.9 occurrences
- Total population: 644,835
3. Salt Lake City, UT
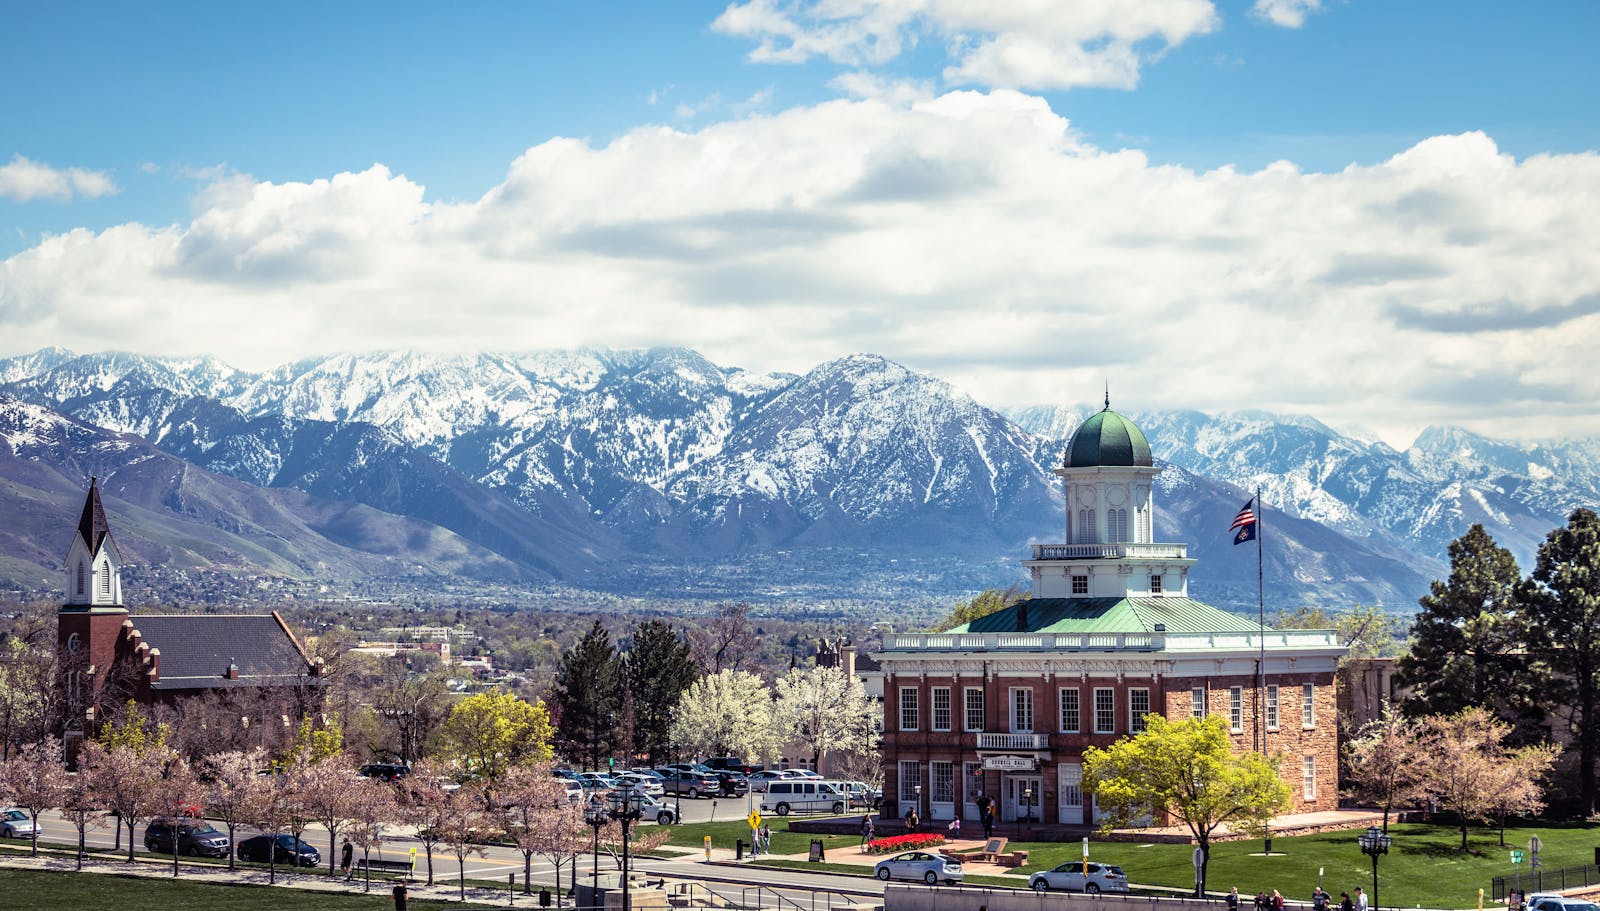
- Change in average heat wave duration, 1961 to 2023: +3.7 days
- Change in average heat wave temperature, 1961 to 2023: +1.4°F
- Change in number of heat waves per year, 1961 to 2023: +5.3 occurrences
- Total population: 201,269
2. Fort Worth, TX

- Change in average heat wave duration, 1961 to 2023: +4.0 days
- Change in average heat wave temperature, 1961 to 2023: +0.7°F
- Change in number of heat waves per year, 1961 to 2023: +5.3 occurrences
- Total population: 924,663
1. New Orleans, LA

- Change in average heat wave duration, 1961 to 2023: +4.5 days
- Change in average heat wave temperature, 1961 to 2023: +0.7°F
- Change in number of heat waves per year, 1961 to 2023: +9.1 occurrences
- Total population: 380,408