From New York City to Texas to Arizona, 25 US Cities Facing the Worst Drought Right Now
 https://climate-crisis-247-bucket.nyc3.cdn.digitaloceanspaces.com/wp-content/uploads/2024/11/08000406/20433735-150x150.jpeg
In one of the worst national droughts in recorded history, more than 20% of the U.S. has been in moderate to exceptional drought for the bulk of 2024. By mid-November, 88% of the contiguous U.S. was abnormally dry, the largest share since the U.S. Drought Monitor began tracking national drought conditions in 1999.
Whence the next pandemic? Cities Where the Next Pandemic Is Most Likely to Break Out
New border crisis? Climate Change Pushing Vampire Bats North Into Texas
With dry conditions spreading coast to coast, some of the largest cities in the country are currently facing their worst droughts on record. Crisp air and dry, brittle vegetation have led to increased wildfire activity throughout the country and have caused particulate matter concentrations in the air to spike to dangerous levels. A closer look at the data reveals the cities with the worst drought right now.
To determine the cities with the worst drought right now, Climate Crisis 247 reviewed data on U.S. drought conditions as of November 18, 2024 from the U.S. Drought Monitor. Metropolitan statistical areas were ranked based on the percentage of land area currently in extreme to exceptional drought, per USDM definitions. Supplemental data on October rainfall and rainfall normals are from the NOAA.
25. New York-Newark-Jersey City, NY-NJ

- Land area in extreme to exceptional drought: 4.9%
- Normal rainfall, October 1901-2000: 3.5 inches
- Rainfall, October 2024: 0.0 inches
24. El Centro, CA MSA

- Land area in extreme to exceptional drought: 7.8%
- Normal rainfall, October 1901-2000: 0.2 inches
- Rainfall, October 2024: 0.0 inches
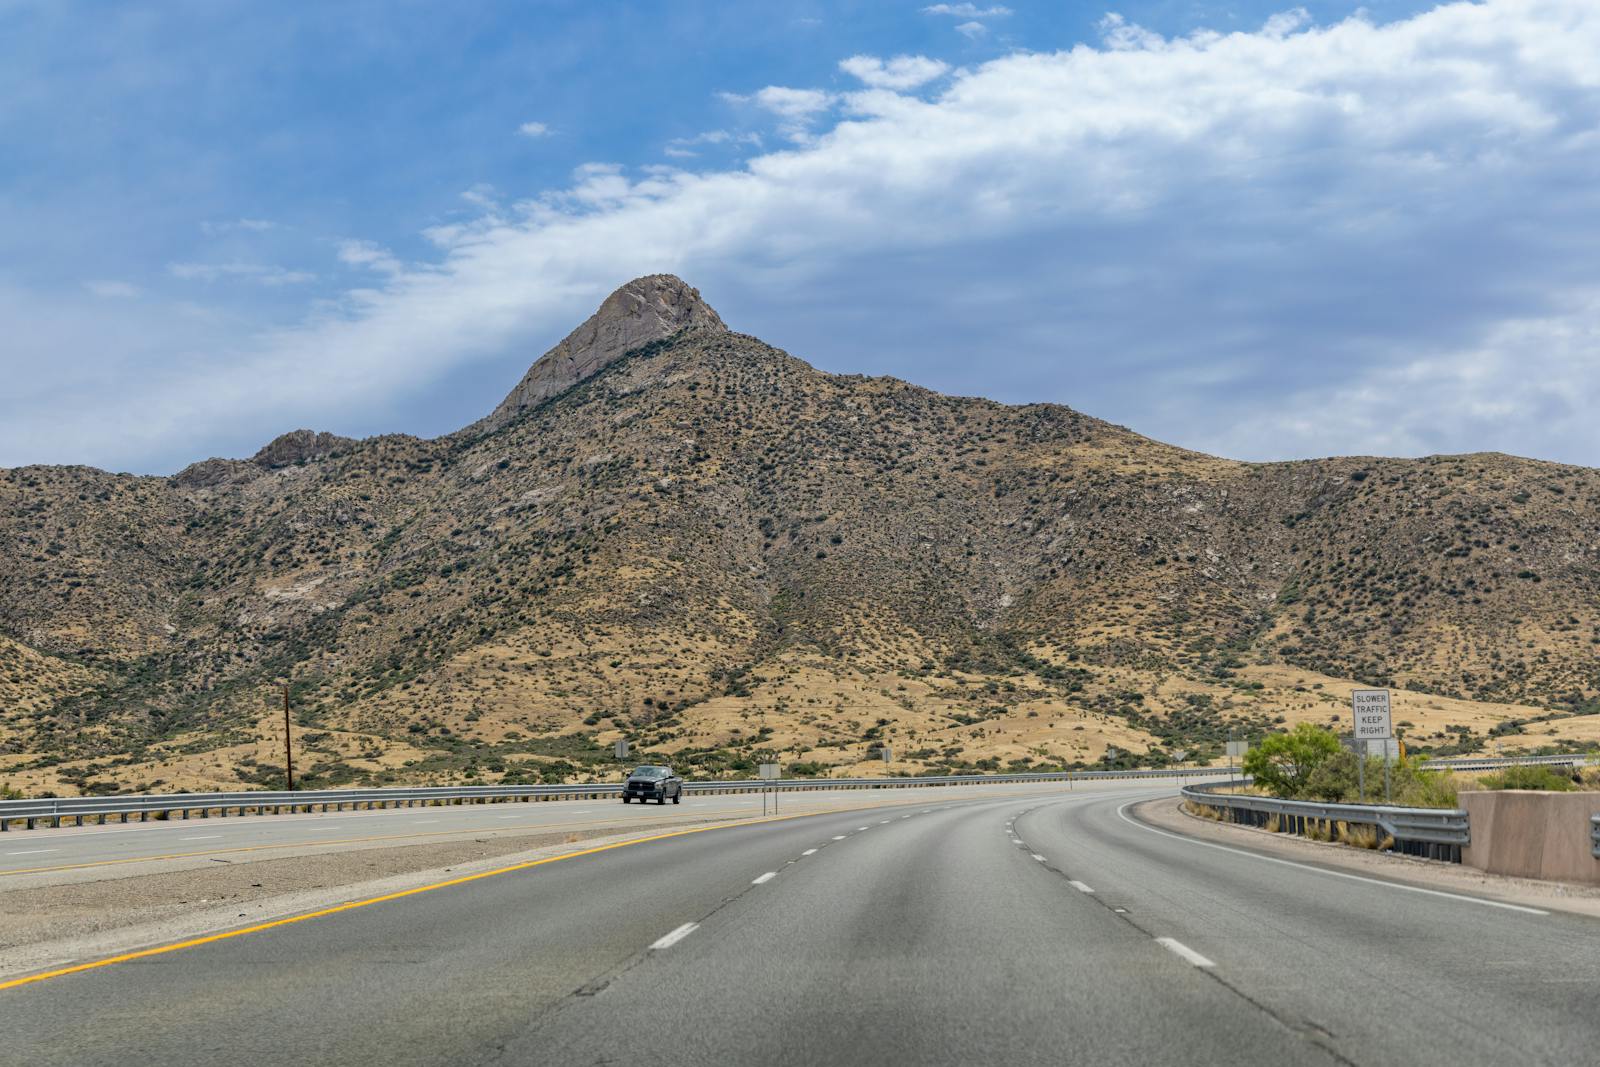
23. Phoenix-Mesa-Chandler, AZ
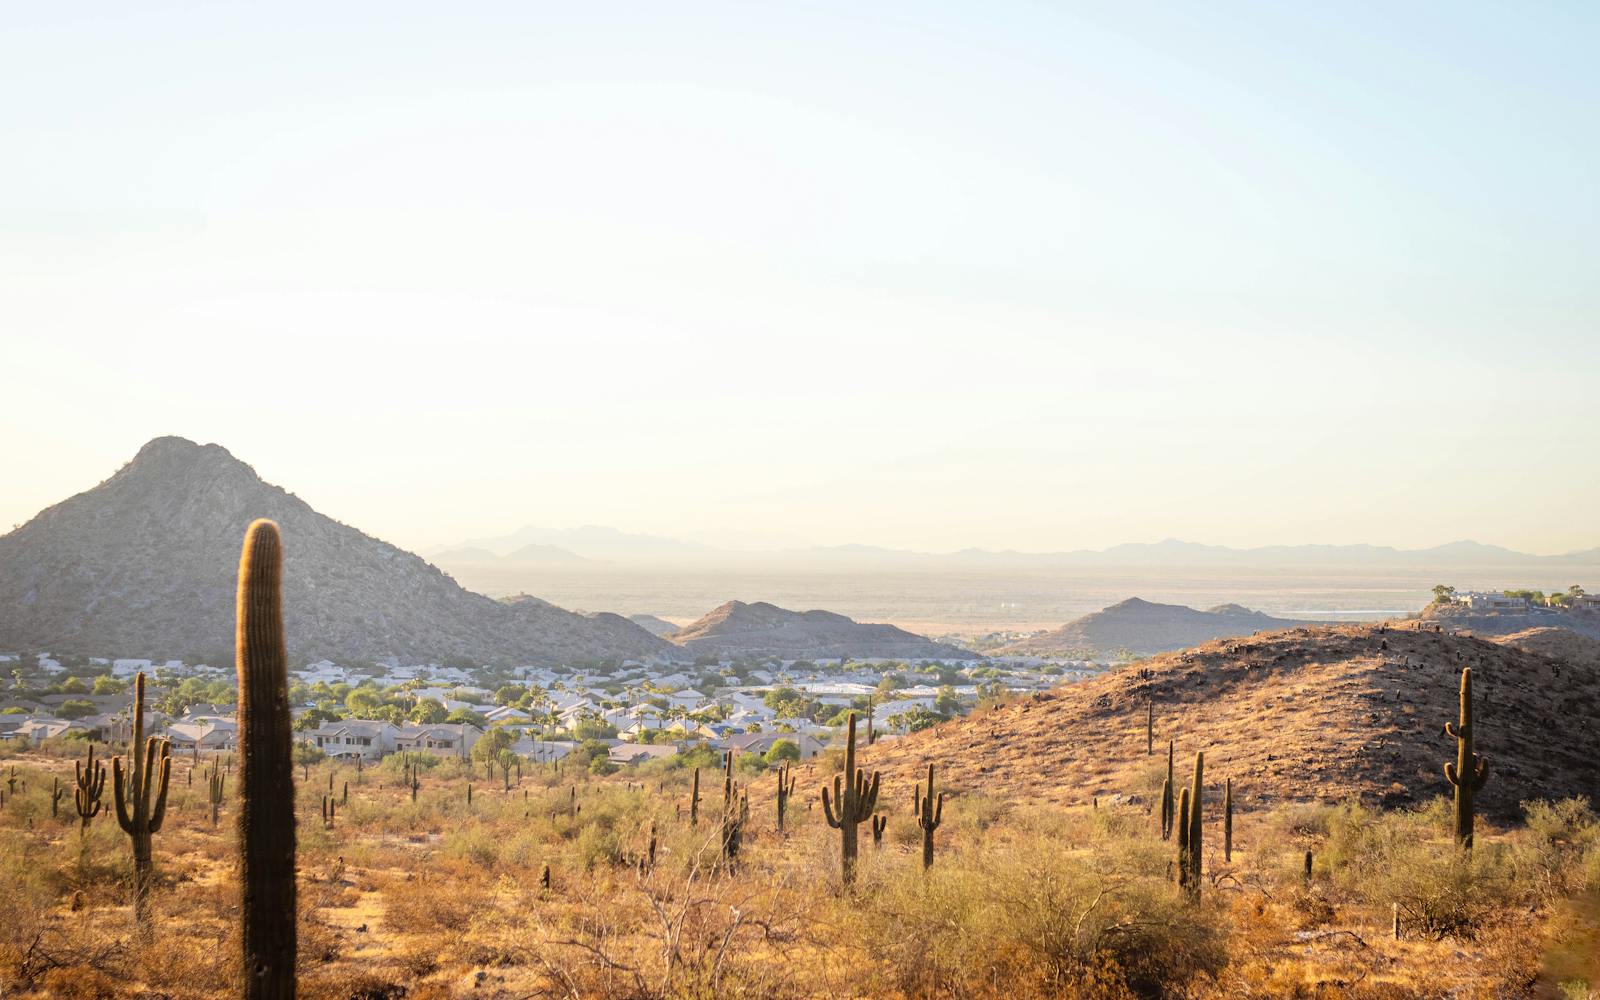
- Land area in extreme to exceptional drought: 10.2%
- Normal rainfall, October 1901-2000: 0.7 inches
- Rainfall, October 2024: 0.1 inches
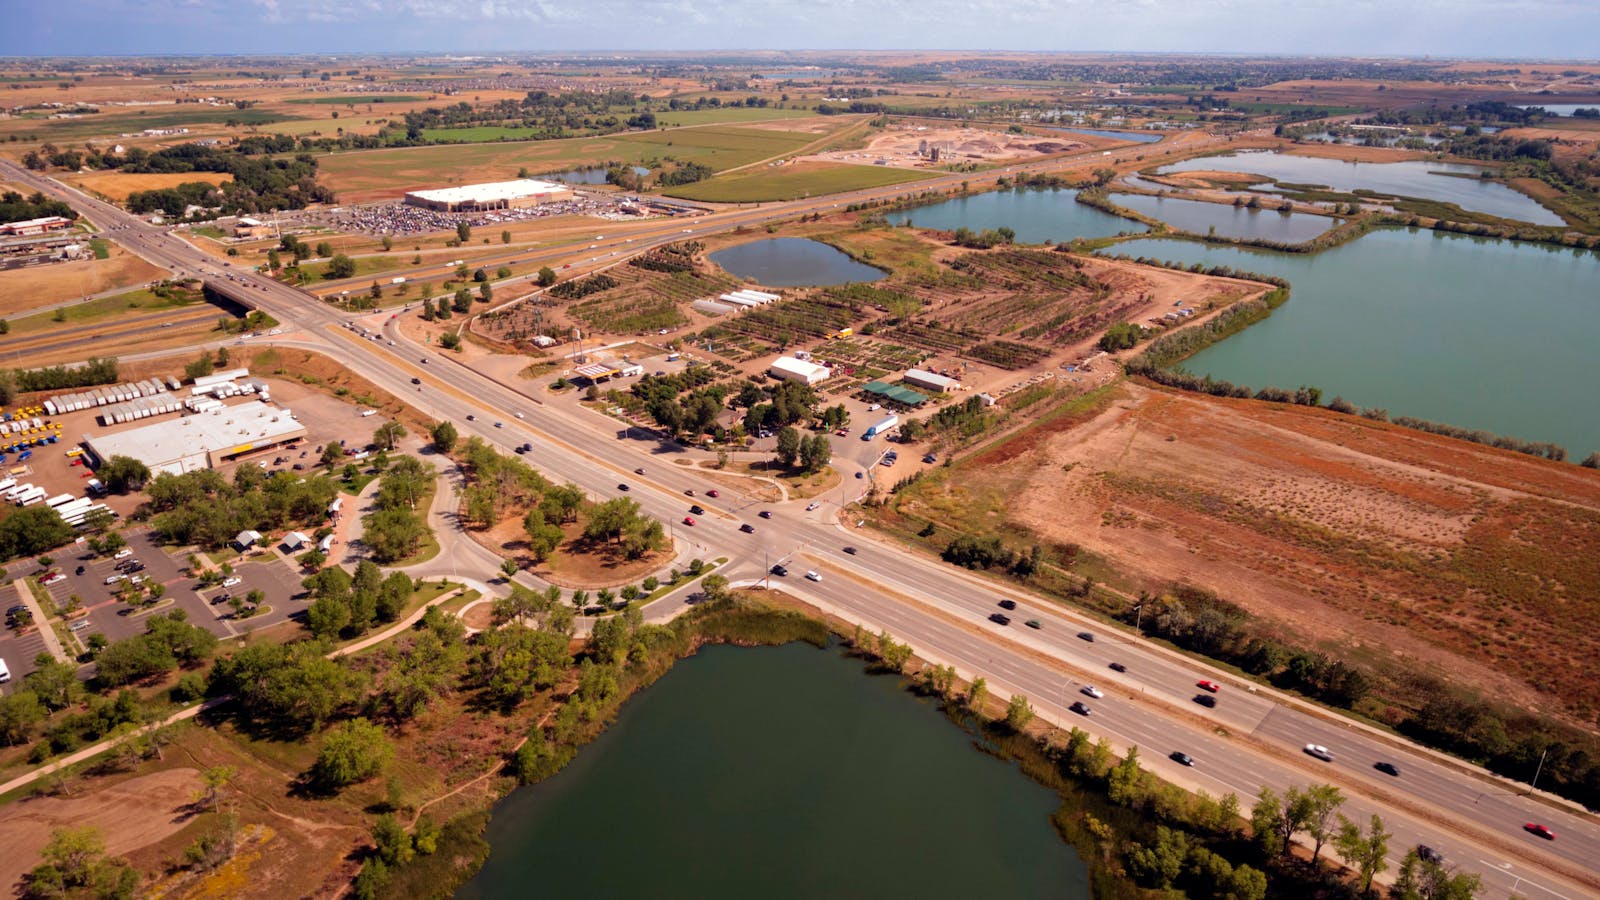
22. Greeley, CO MSA
- Land area in extreme to exceptional drought: 10.7%
- Normal rainfall, October 1901-2000: 0.9 inches
- Rainfall, October 2024: 0.2 inches
21. Cheyenne, WY
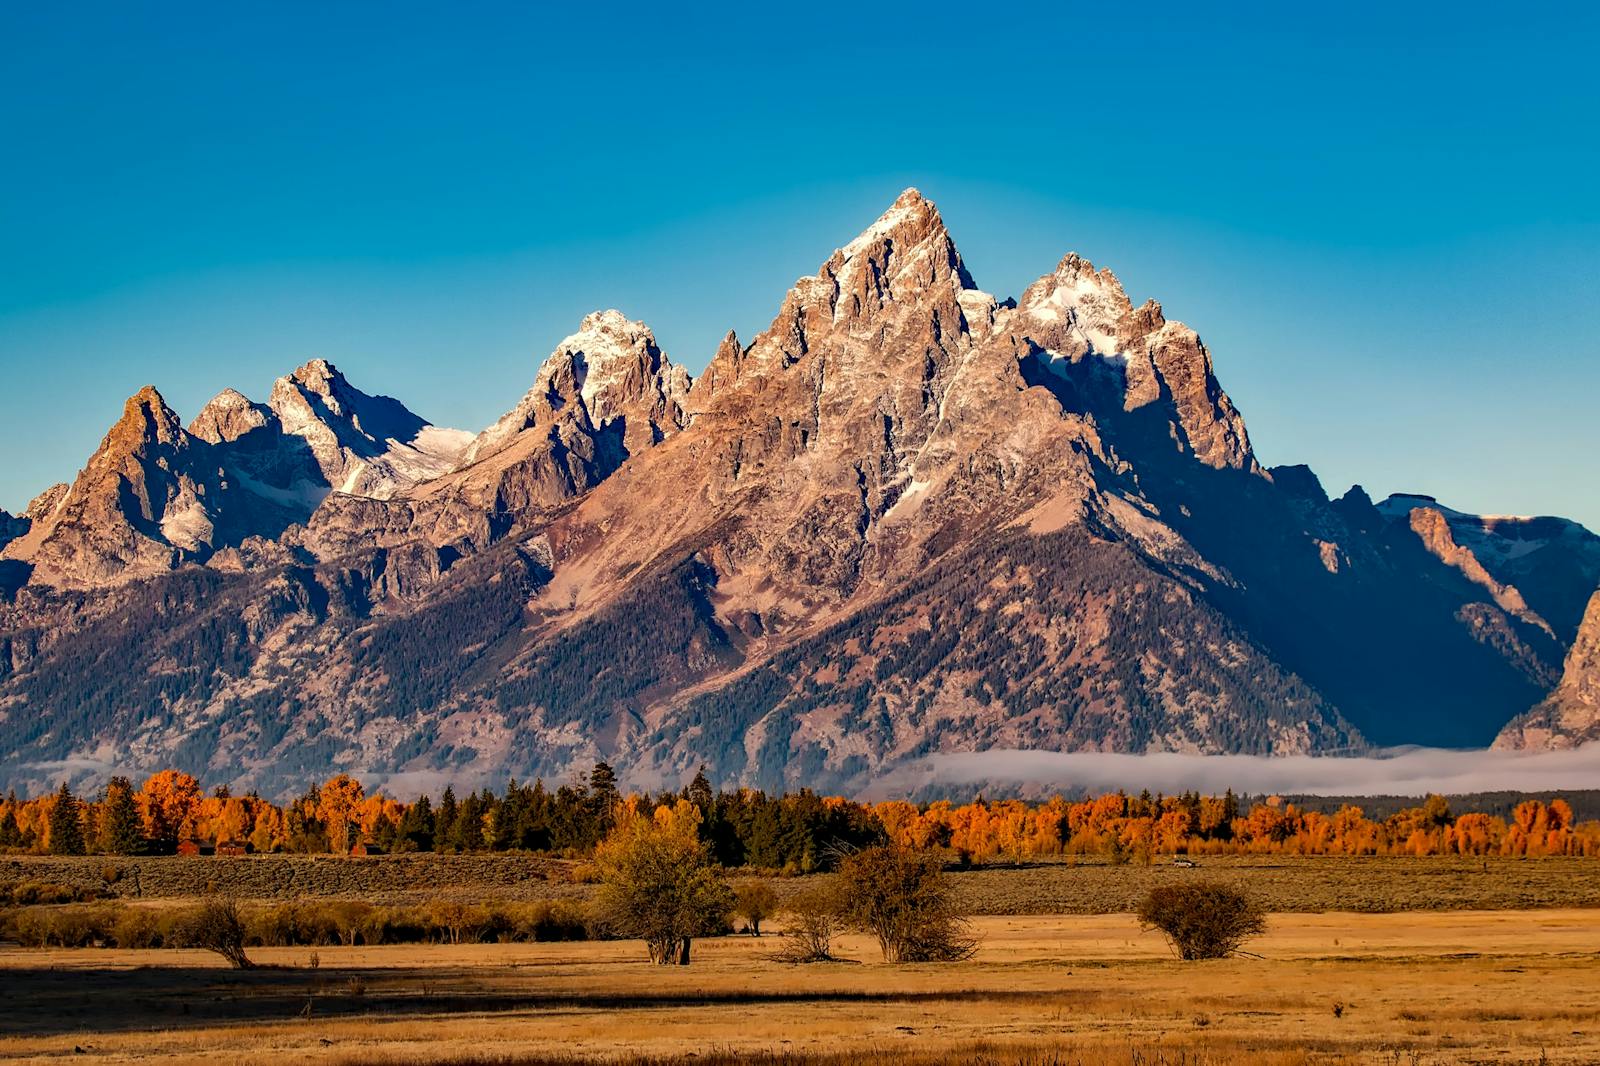
- Land area in extreme to exceptional drought: 12.3%
- Normal rainfall, October 1901-2000: 1.0 inches
- Rainfall, October 2024: 0.1 inches
20. Charleston, WV

- Land area in extreme to exceptional drought: 12.7%
- Normal rainfall, October 1901-2000: 2.9 inches
- Rainfall, October 2024: 0.7 inches
19. Lake Havasu City-Kingman, AZ

- Land area in extreme to exceptional drought: 13.8%
- Normal rainfall, October 1901-2000: 0.7 inches
- Rainfall, October 2024: 0.2 inches
18. Tuscaloosa, AL

- Land area in extreme to exceptional drought: 14.3%
- Normal rainfall, October 1901-2000: 2.8 inches
- Rainfall, October 2024: 0.1 inches
17. Philadelphia-Camden-Wilmington, PA-NJ-DE-MD

- Land area in extreme to exceptional drought: 15.5%
- Normal rainfall, October 1901-2000: 3.1 inches
- Rainfall, October 2024: 0.0 inches
16. Columbus, OH

- Land area in extreme to exceptional drought: 15.7%
- Normal rainfall, October 1901-2000: 2.4 inches
- Rainfall, October 2024: 0.5 inches
15. Pittsburgh, PA

- Land area in extreme to exceptional drought: 19.6%
- Normal rainfall, October 1901-2000: 2.8 inches
- Rainfall, October 2024: 1.4 inches
14. Helena, MT
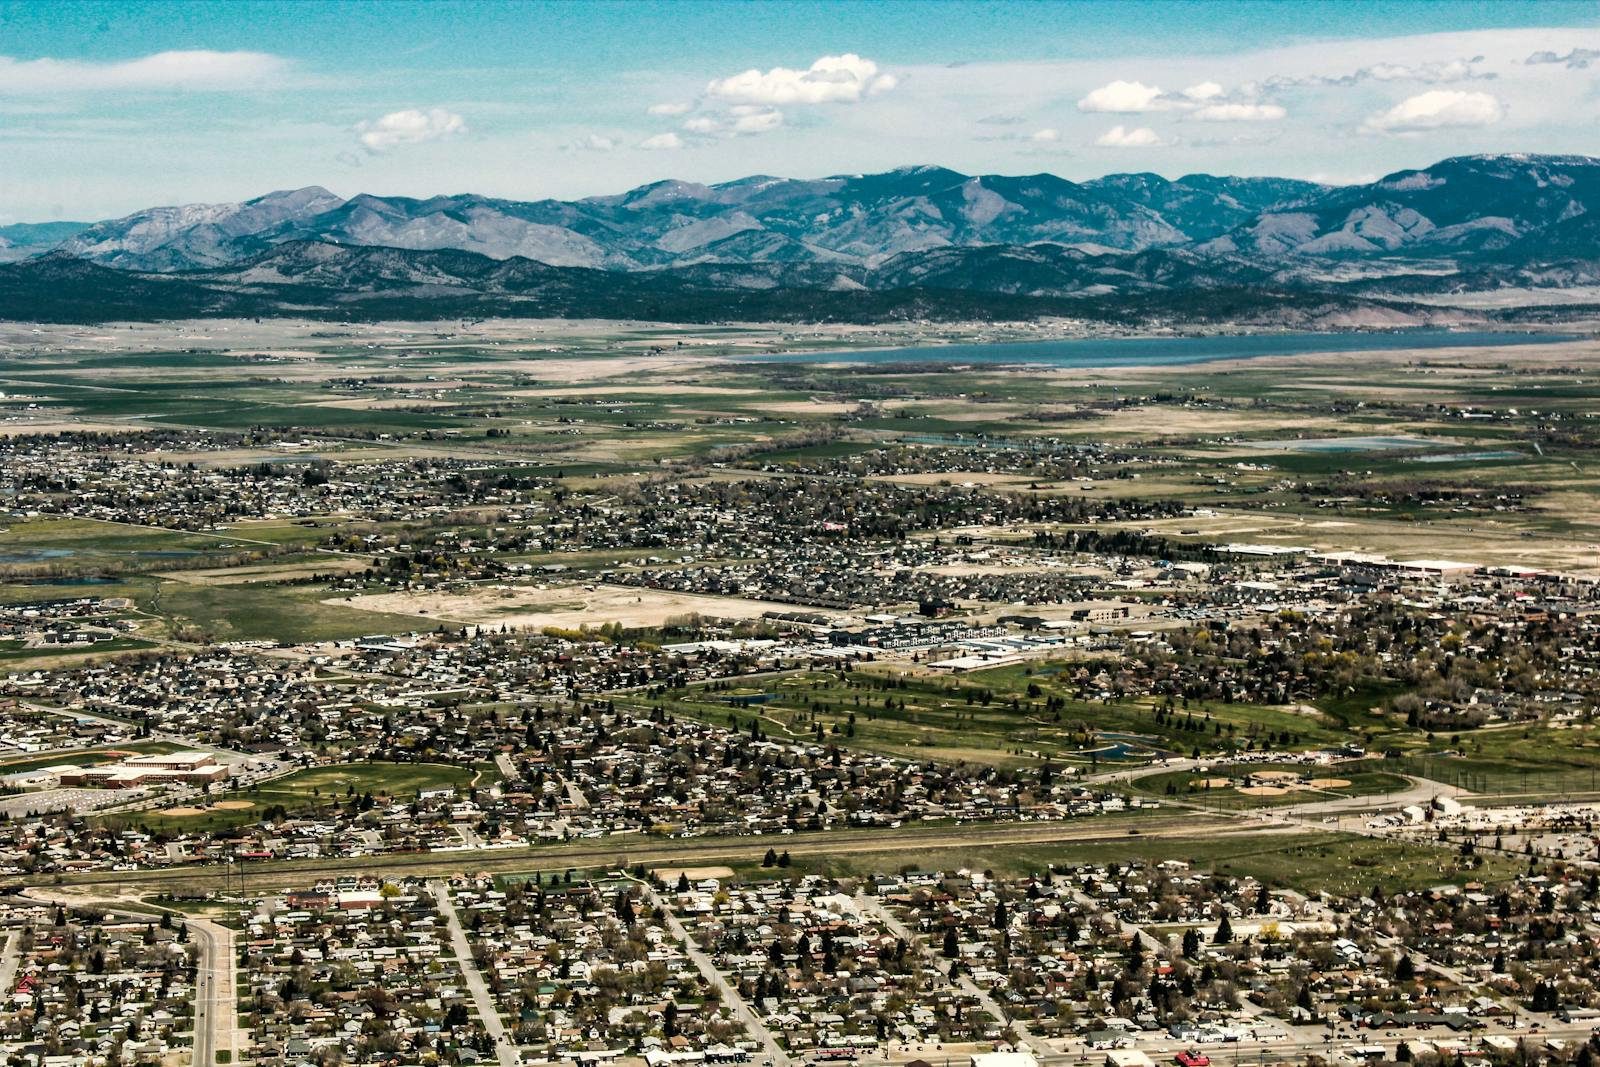
- Land area in extreme to exceptional drought: 19.8%
- Normal rainfall, October 1901-2000: 1.2 inches
- Rainfall, October 2024: 0.3 inches
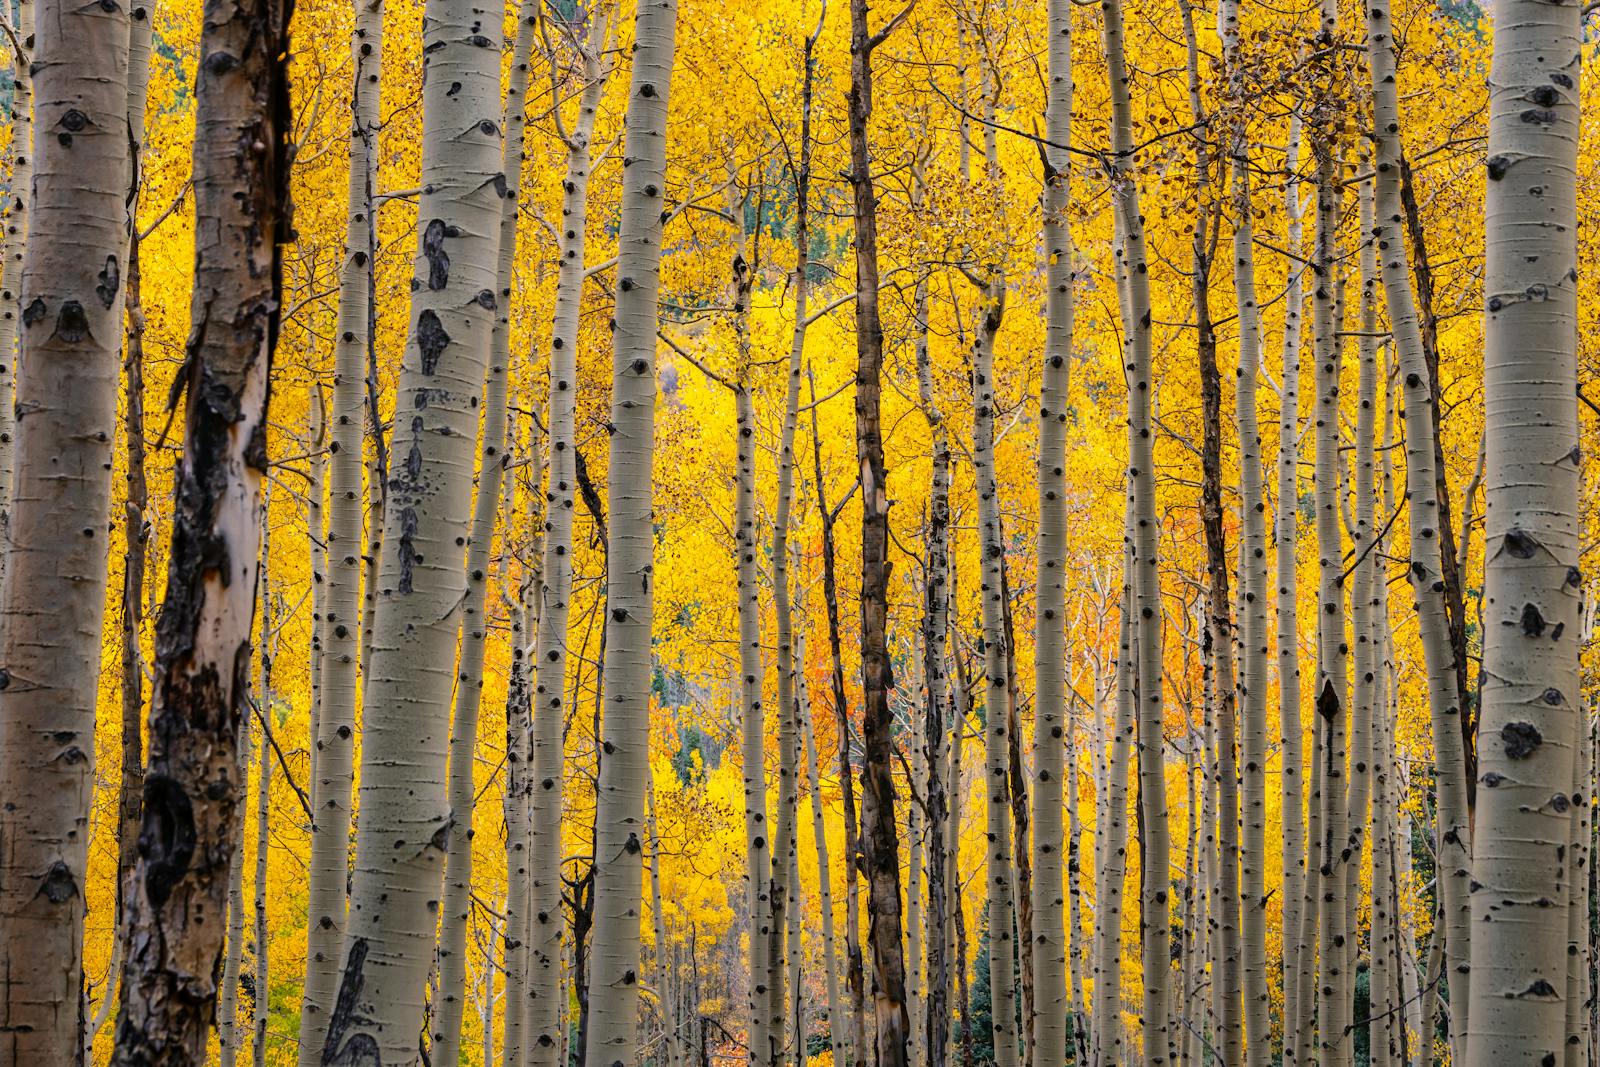
13. Fort Collins-Loveland, CO
- Land area in extreme to exceptional drought: 21.0%
- Normal rainfall, October 1901-2000: 1.4 inches
- Rainfall, October 2024: 0.5 inches
12. Missoula, MT
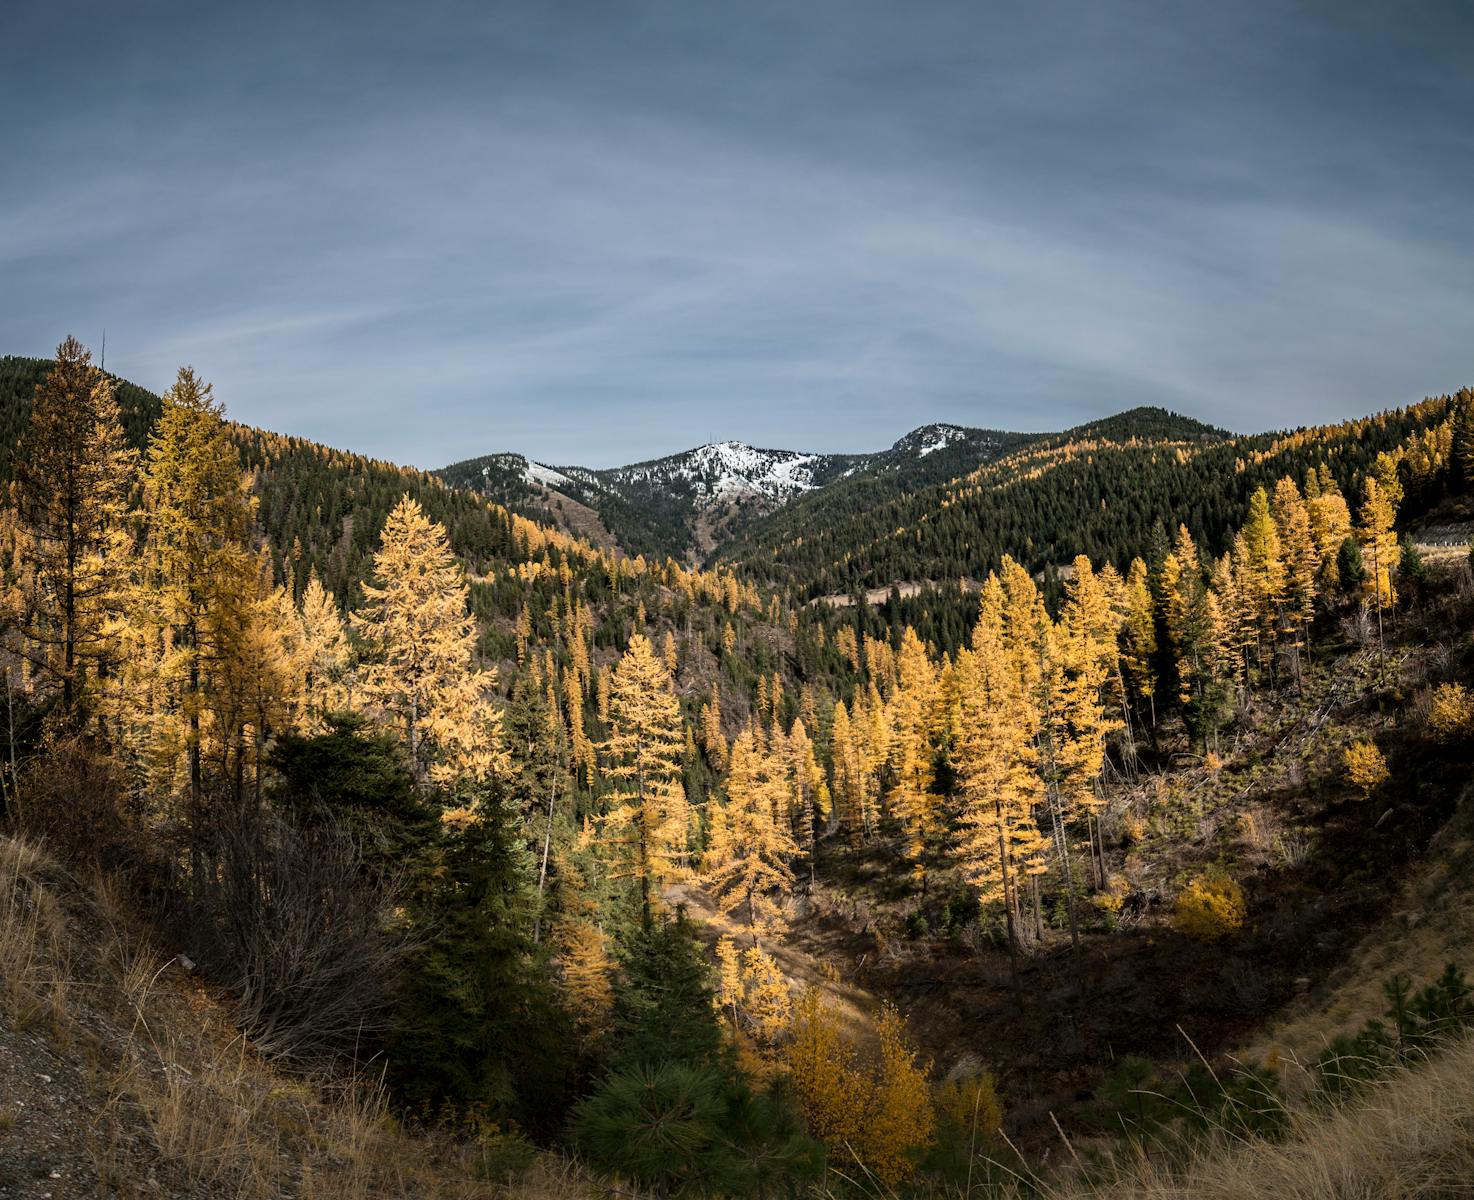
- Land area in extreme to exceptional drought: 22.8%
- Normal rainfall, October 1901-2000: 2.6 inches
- Rainfall, October 2024: 1.3 inches
11. Yuma, AZ
- Land area in extreme to exceptional drought: 26.3%
- Normal rainfall, October 1901-2000: 0.4 inches
- Rainfall, October 2024: 0.0 inches
10. Austin-Round Rock-San Marcos, TX
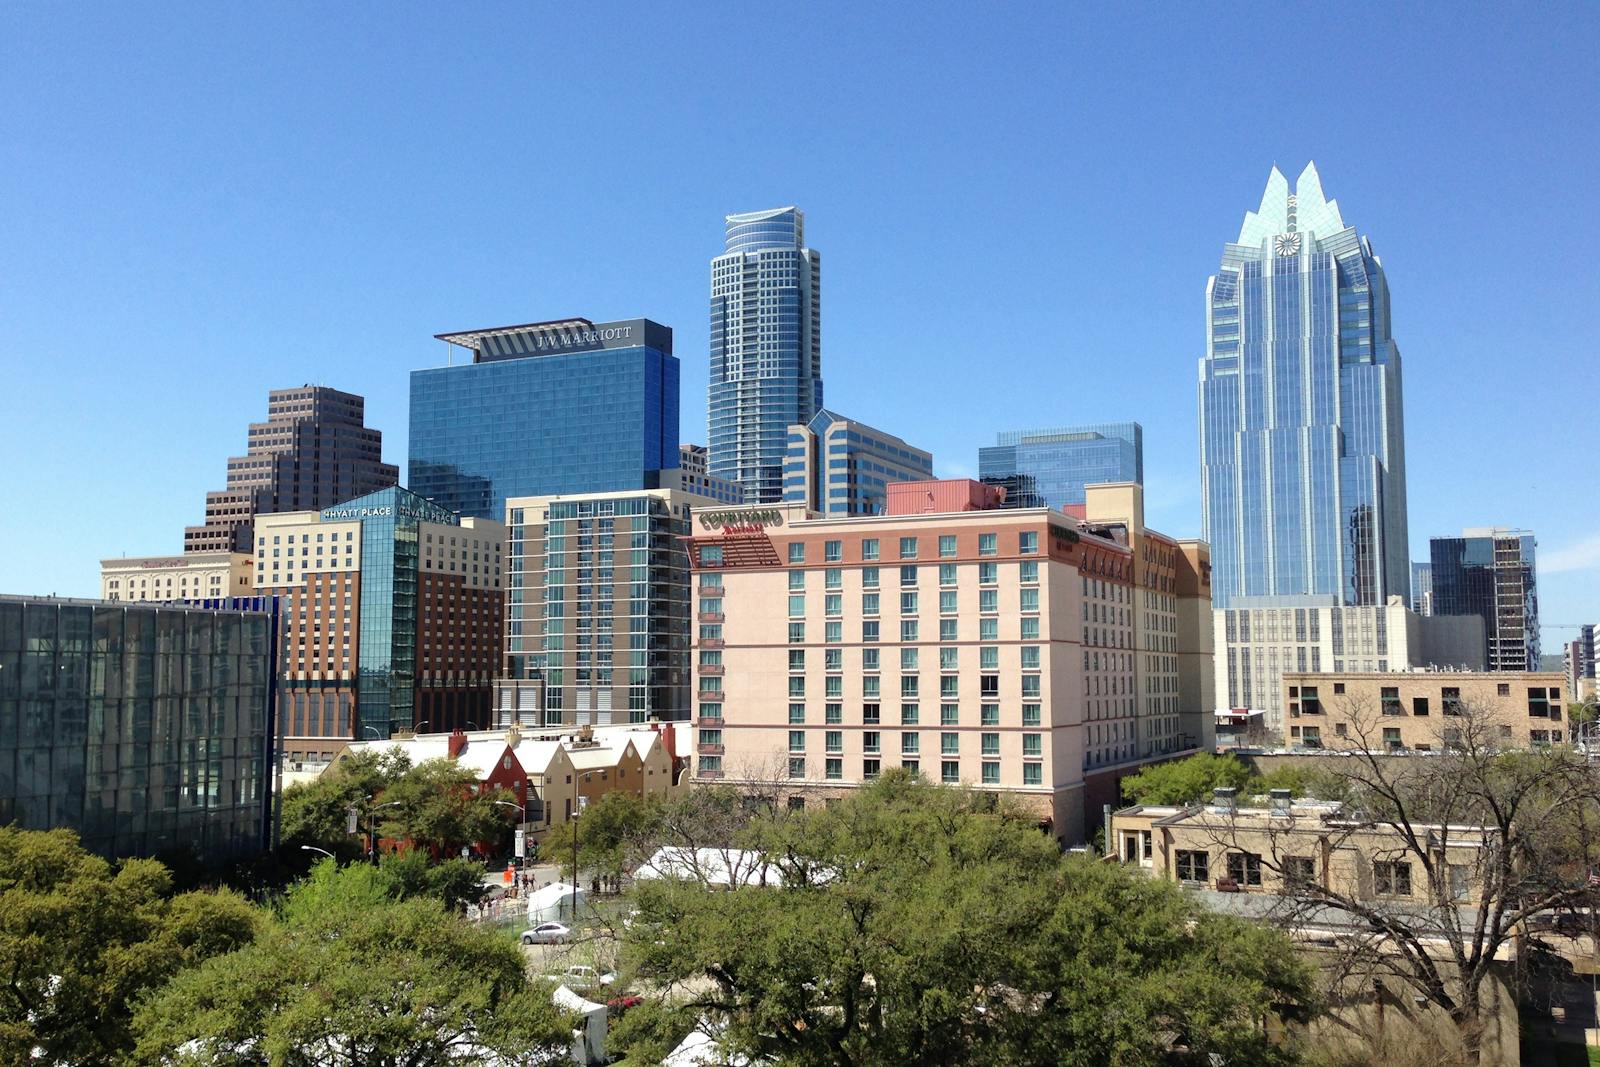
- Land area in extreme to exceptional drought: 27.3%
- Normal rainfall, October 1901-2000: 3.4 inches
- Rainfall, October 2024: 0.0 inches
9. Huntsville, AL

- Land area in extreme to exceptional drought: 27.9%
- Normal rainfall, October 1901-2000: 3.1 inches
- Rainfall, October 2024: 0.3 inches
8. Rapid City, SD
- Land area in extreme to exceptional drought: 28.1%
- Normal rainfall, October 1901-2000: 1.1 inches
- Rainfall, October 2024: 0.4 inches
7. Vineland, NJ

- Land area in extreme to exceptional drought: 38.0%
- Normal rainfall, October 1901-2000: 3.1 inches
- Rainfall, October 2024: 0.0 inches
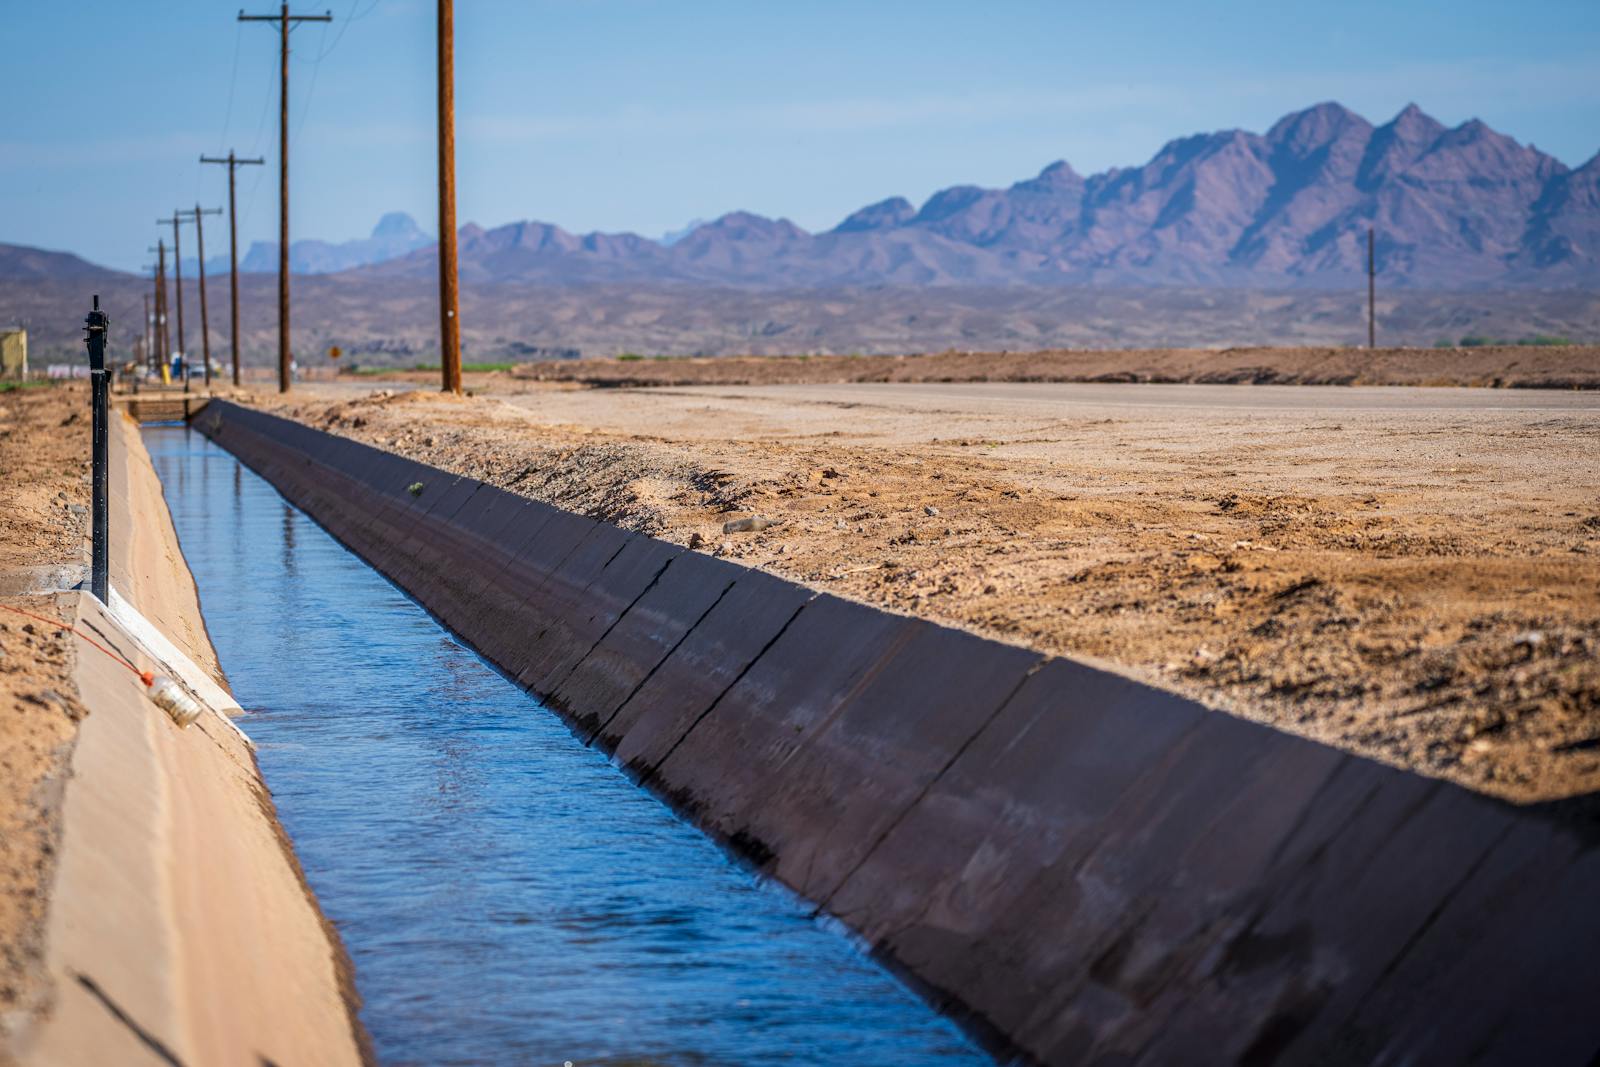
6. Las Cruces, NM

- Land area in extreme to exceptional drought: 43.7%
- Normal rainfall, October 1901-2000: 0.9 inches
- Rainfall, October 2024: 0.2 inches
5. Morgantown, WV
- Land area in extreme to exceptional drought: 46.3%
- Normal rainfall, October 1901-2000: 3.0 inches
- Rainfall, October 2024: 1.8 inches
4. Atlantic City-Hammonton, NJ

- Land area in extreme to exceptional drought: 55.3%
- Normal rainfall, October 1901-2000: 3.1 inches
- Rainfall, October 2024: 0.0 inches
3. San Antonio-New Braunfels, TX
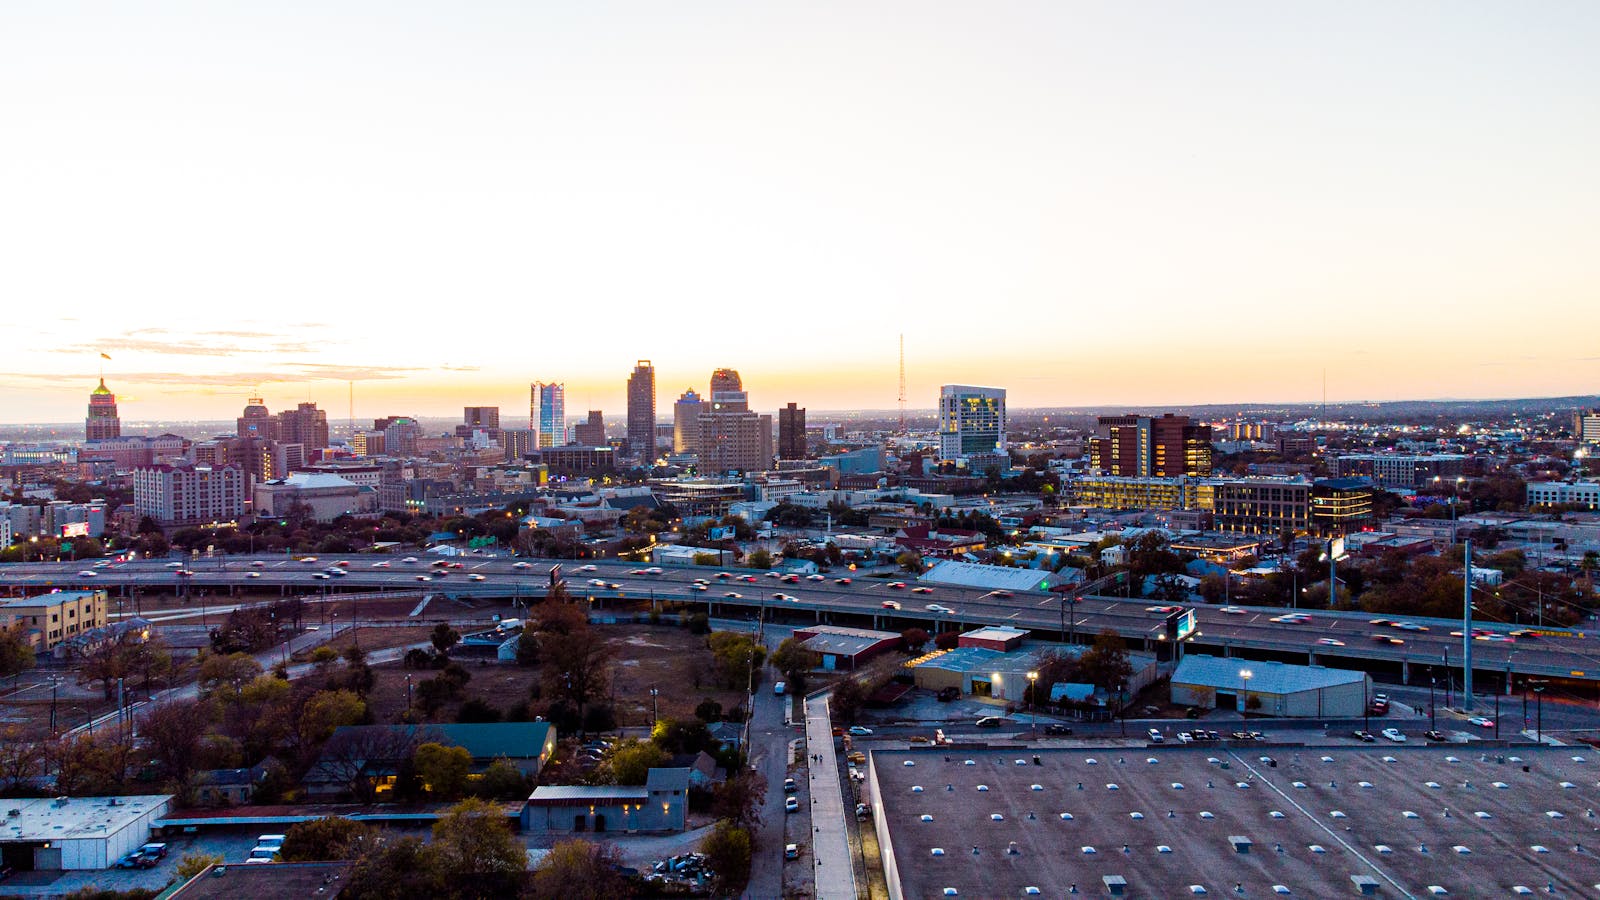
- Land area in extreme to exceptional drought: 60.2%
- Normal rainfall, October 1901-2000: 3.1 inches
- Rainfall, October 2024: 0.0 inches
2. Wheeling, WV-OH

- Land area in extreme to exceptional drought: 84.6%
- Normal rainfall, October 1901-2000: 2.7 inches
- Rainfall, October 2024: 0.6 inches
1. El Paso, TX
- Land area in extreme to exceptional drought: 89.3%
- Normal rainfall, October 1901-2000: 0.9 inches
- Rainfall, October 2024: 0.1 inches
Sponsor
Find a Vetted Financial Advisor
- Finding a fiduciary financial advisor doesn't have to be hard. SmartAsset's free tool matches you with up to 3 financial advisors that serve your area in 5 minutes.
- Each advisor has been vetted by SmartAsset and is held to a fiduciary standard to act in your best interests. Get on the path toward achieving your financial goals!