From Seattle to North Carolina, These Are the 25 Rainiest Cities in America
 https://climatecrisis247.com/wp-content/uploads/2024/12/1695056-150x150.jpeg
The United States has one of the most diverse climates of any country. While the Köppen climate classification system categorizes the U.S. into six main climate types, the EPA has over 900 classifications for different ecoregions coexisting within the country.
Whence the next pandemic? Cities Where the Next Pandemic Is Most Likely to Break Out
New border crisis? Climate Change Pushing Vampire Bats North Into Texas
One of the largest regional variations in climate is precipitation. While a number of counties in the Pacific Northwest see over 100 inches of rain per year on average, some counties in the Southwest see less than 10 inches of precipitation in a normal year. A look at NOAA data reveals which cities get the most rain every year.
To determine the rainiest cities in America, Climate Crisis 247 reviewed historical data on monthly precipitation from the NOAA. County seats were ranked based on average monthly rainfall amounts from 1924 to 2023. All data is at the county level.
25. Vancouver, WA (Clark County)

- Average monthly precipitation, 1924-2023: 5.49 inches
- Rainiest month: December 1933 (25.40 inches)
24. Dallas, OR (Polk County)

- Average monthly precipitation, 1924-2023: 5.52 inches
- Rainiest month: December 1996 (27.02 inches)
23. Coquille, OR (Coos County)

- Average monthly precipitation, 1924-2023: 5.66 inches
- Rainiest month: November 1973 (28.42 inches)
22. Clayton, GA (Rabun County)

- Average monthly precipitation, 1924-2023: 5.74 inches
- Rainiest month: August 1901 (20.65 inches)
21. Bellingham, WA (Whatcom County)

- Average monthly precipitation, 1924-2023: 5.75 inches
- Rainiest month: December 1917 (26.54 inches)
20. Albany, OR (Linn County)

- Average monthly precipitation, 1924-2023: 5.77 inches
- Rainiest month: November 1896 (27.22 inches)
19. Brevard, NC (Transylvania County)
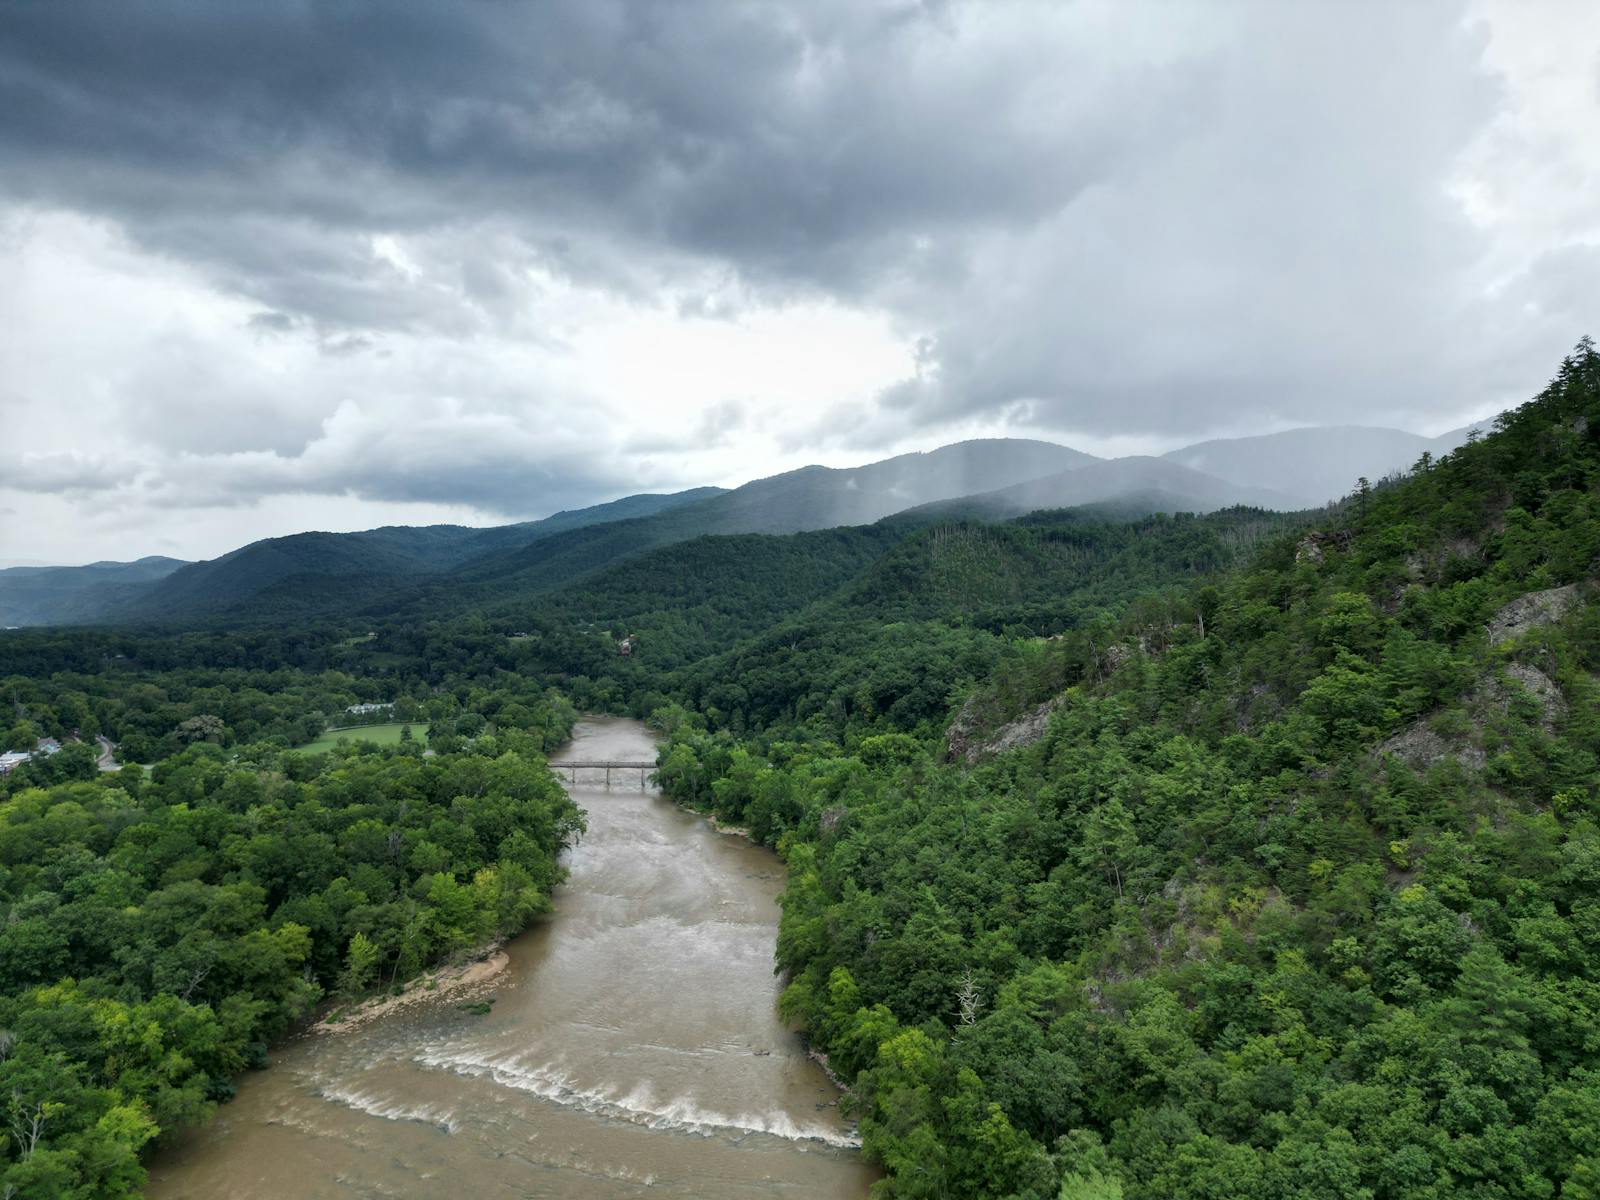
- Average monthly precipitation, 1924-2023: 5.85 inches
- Rainiest month: August 1901 (26.78 inches)
18. Chehalis, WA (Lewis County)

- Average monthly precipitation, 1924-2023: 6.01 inches
- Rainiest month: December 1933 (35.67 inches)
17. Seattle, WA (King County)

- Average monthly precipitation, 1924-2023: 6.13 inches
- Rainiest month: December 1933 (30.55 inches)
16. Oregon City, OR (Clackamas County)

- Average monthly precipitation, 1924-2023: 6.19 inches
- Rainiest month: November 1896 (27.50 inches)
15. Kelso, WA (Cowlitz County)

- Average monthly precipitation, 1924-2023: 6.39 inches
- Rainiest month: December 1933 (31.67 inches)
14. Mount Vernon, WA (Skagit County)

- Average monthly precipitation, 1924-2023: 6.42 inches
- Rainiest month: December 1917 (30.86 inches)
13. Crescent City, CA (Del Norte County)

- Average monthly precipitation, 1924-2023: 6.53 inches
- Rainiest month: November 1973 (37.20 inches)
12. Cathlamet, WA (Wahkiakum County)

- Average monthly precipitation, 1924-2023: 6.81 inches
- Rainiest month: December 1933 (36.35 inches)
11. Everett, WA (Snohomish County)

- Average monthly precipitation, 1924-2023: 6.85 inches
- Rainiest month: December 1933 (29.16 inches)
10. Gold Beach, OR (Curry County)
- Average monthly precipitation, 1924-2023: 7.07 inches
- Rainiest month: November 1973 (36.72 inches)
9. Port Angeles, WA (Clallam County)

- Average monthly precipitation, 1924-2023: 7.34 inches
- Rainiest month: January 1953 (31.04 inches)
8. Astoria, OR (Clatsop County)
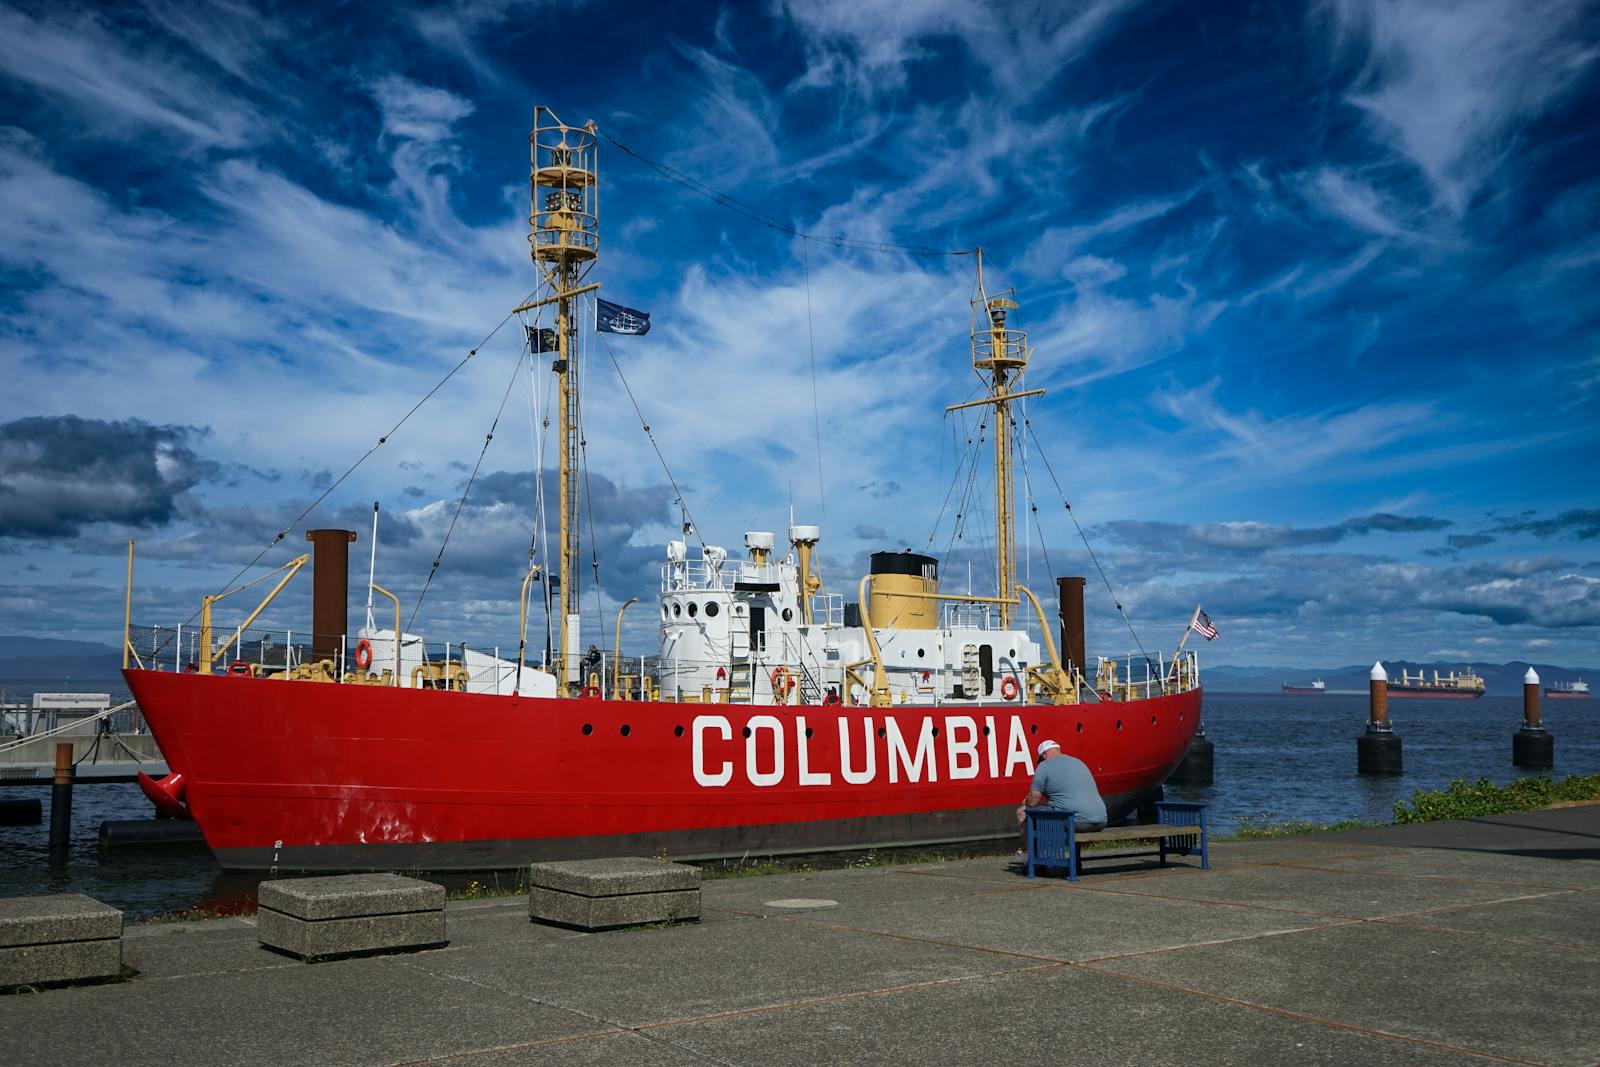
- Average monthly precipitation, 1924-2023: 7.35 inches
- Rainiest month: December 1933 (38.46 inches)
7. South Bend, WA (Pacific County)

- Average monthly precipitation, 1924-2023: 7.36 inches
- Rainiest month: December 1933 (40.22 inches)
6. Shelton, WA (Mason County)

- Average monthly precipitation, 1924-2023: 7.43 inches
- Rainiest month: December 1933 (38.70 inches)
5. Newport, OR (Lincoln County)

- Average monthly precipitation, 1924-2023: 7.45 inches
- Rainiest month: November 1896 (31.45 inches)
4. Stevenson, WA (Skamania County)

- Average monthly precipitation, 1924-2023: 7.61 inches
- Rainiest month: December 1933 (44.76 inches)
3. Montesano, WA (Grays Harbor County)

- Average monthly precipitation, 1924-2023: 7.94 inches
- Rainiest month: December 1933 (35.94 inches)
2. Tillamook, OR (Tillamook County)

- Average monthly precipitation, 1924-2023: 8.36 inches
- Rainiest month: December 1933 (38.90 inches)
1. Port Townsend, WA (Jefferson County)

- Average monthly precipitation, 1924-2023: 9.01 inches
- Rainiest month: January 1953 (37.44 inches)
More from ClimateCrisis 247
- 11 US Cities Where Summer Temperatures Have Surged in the Last 50 Years
- 13 US Counties That Suffered Historic Heat Last Month
- States Where the Government is Underestimating Flood Risk
- With the Passage of Trump’s Bill, These Teslas and Other EVs Will Lose Their $7,500 Tax Credit