These Countries Are Getting a Larger Say in Setting the World’s Climate Priorities
 https://climate-crisis-247-bucket.nyc3.cdn.digitaloceanspaces.com/wp-content/uploads/2024/11/08000503/2990610-150x150.jpg
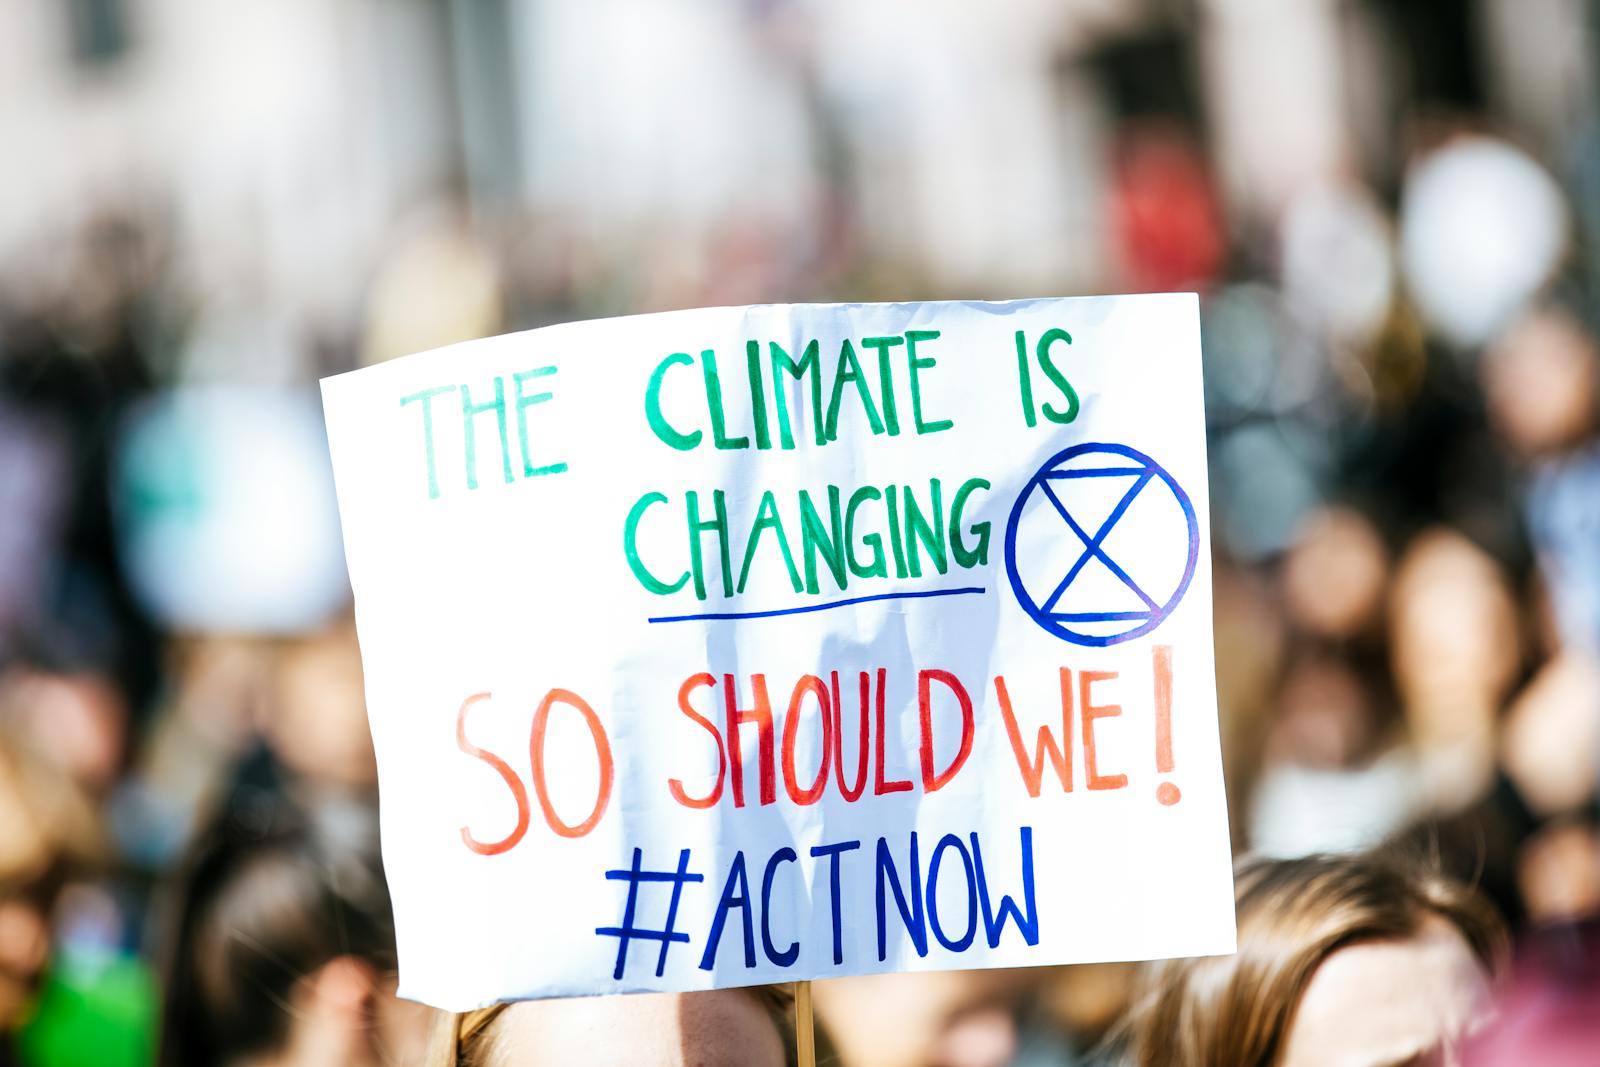
Every year, tens of thousands of diplomats, environmental advocates, and other world stakeholders convene at the United Nations COP summit to negotiate and set the Earth’s climate priorities. While the first COP in 1995 was a relatively small gathering of mostly diplomats and NGO representatives, the COP has since grown to include lobbyists, media, and other observer groups.
Whence the next pandemic? Cities Where the Next Pandemic Is Most Likely to Break Out
New border crisis? Climate Change Pushing Vampire Bats North Into Texas
The number and size of national delegations has also changed. In recent years, many of the countries most vulnerable to climate disaster – fast-warming sub-Saharan African nations and flood-prone states in South Asia – are sending more delegates and getting a larger say in the global climate agenda. At the same time, petrostates like Oman and Qatar are also getting a bigger seat at the table. A closer look at the data reveals the countries where COP attendance is increasing the fastest.
To determine the countries getting more representation at global climate talks, Climate Crisis 247 reviewed data on party size from the United Nations Framework Convention on Climate Change and historical data on COP attendance from the October 2024 paper “Individual attendance data for over 30 years of international climate change talks” published in Scientific Data. Countries were ranked based on the average annual percentage increase in COP party size from 1995 to 2024. While the UNFCCC has published both main party and party overflow attendee lists for all countries since COP 28, only main party attendees were considered in our analysis. Only countries with at least 50 main party attendees in the last three COP summits were included.
25. Oman
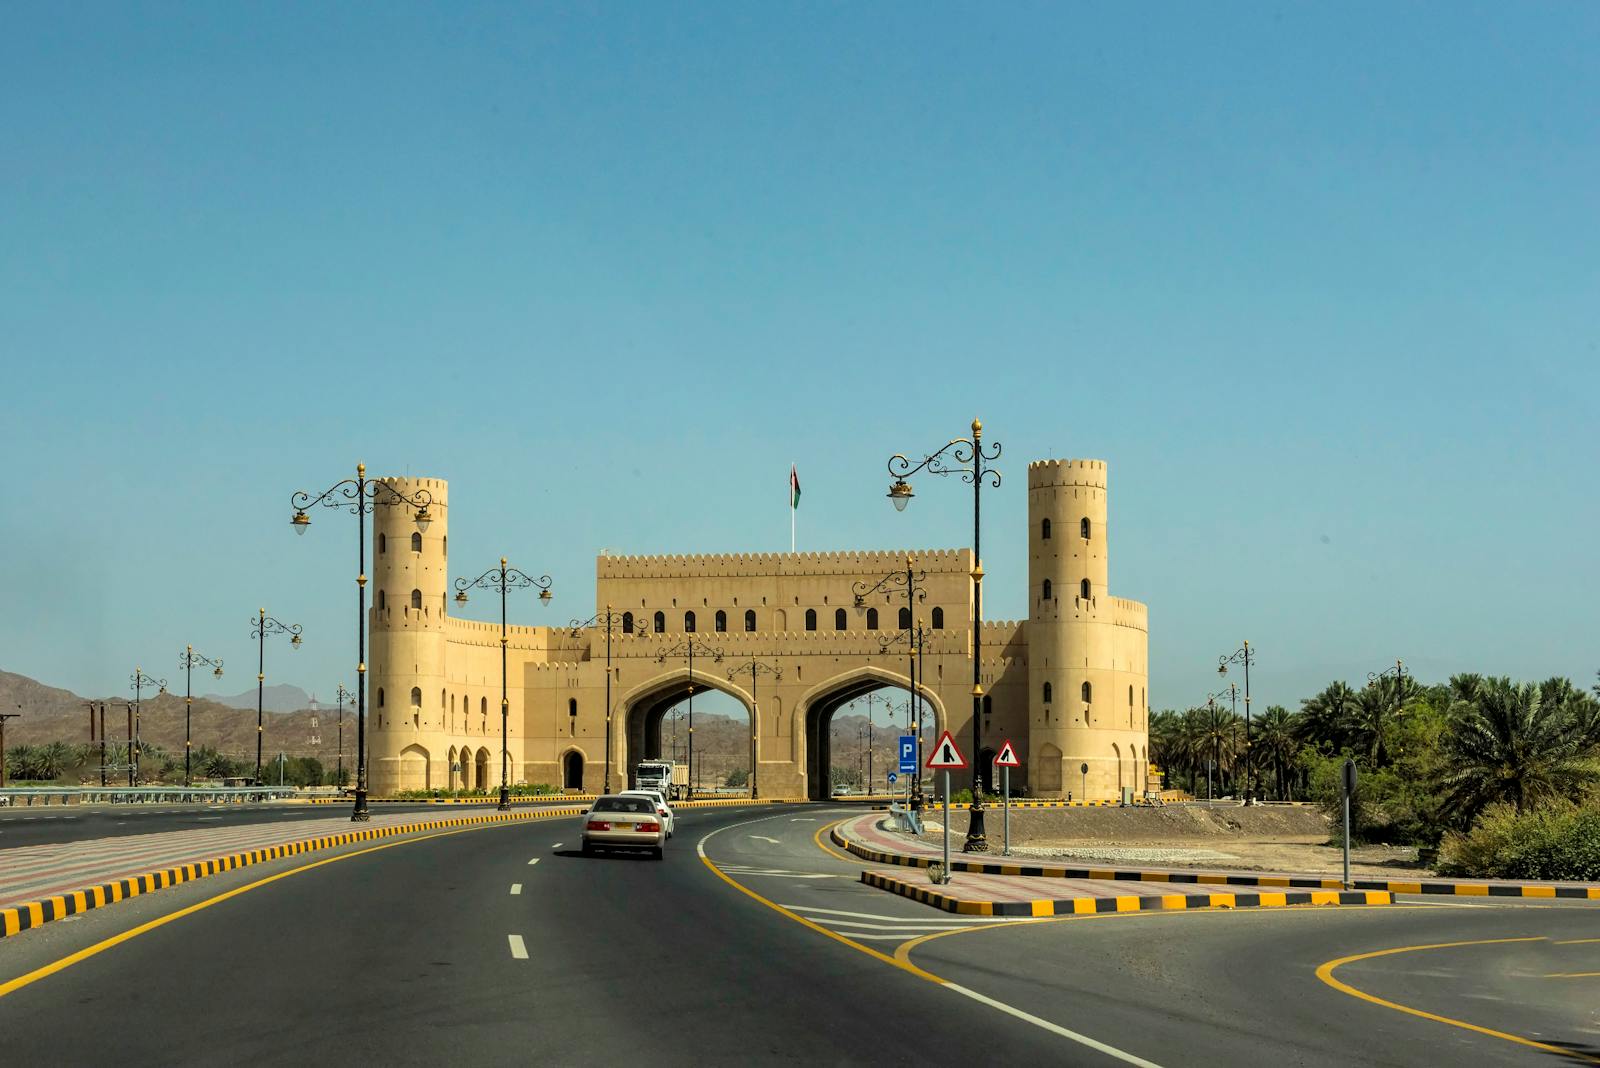
- Average annual increase in COP attendees, 1995 to 2024: +63.9%
- COP29 party size: 199 delegates (4.3 per 100,000 residents)
- Most attended year: COP29 (Baku 2024)
24. Guinea

- Average annual increase in COP attendees, 1995 to 2024: +64.9%
- COP29 party size: 120 delegates (0.8 per 100,000 residents)
- Most attended year: COP28 (Dubai 2023)
23. Qatar
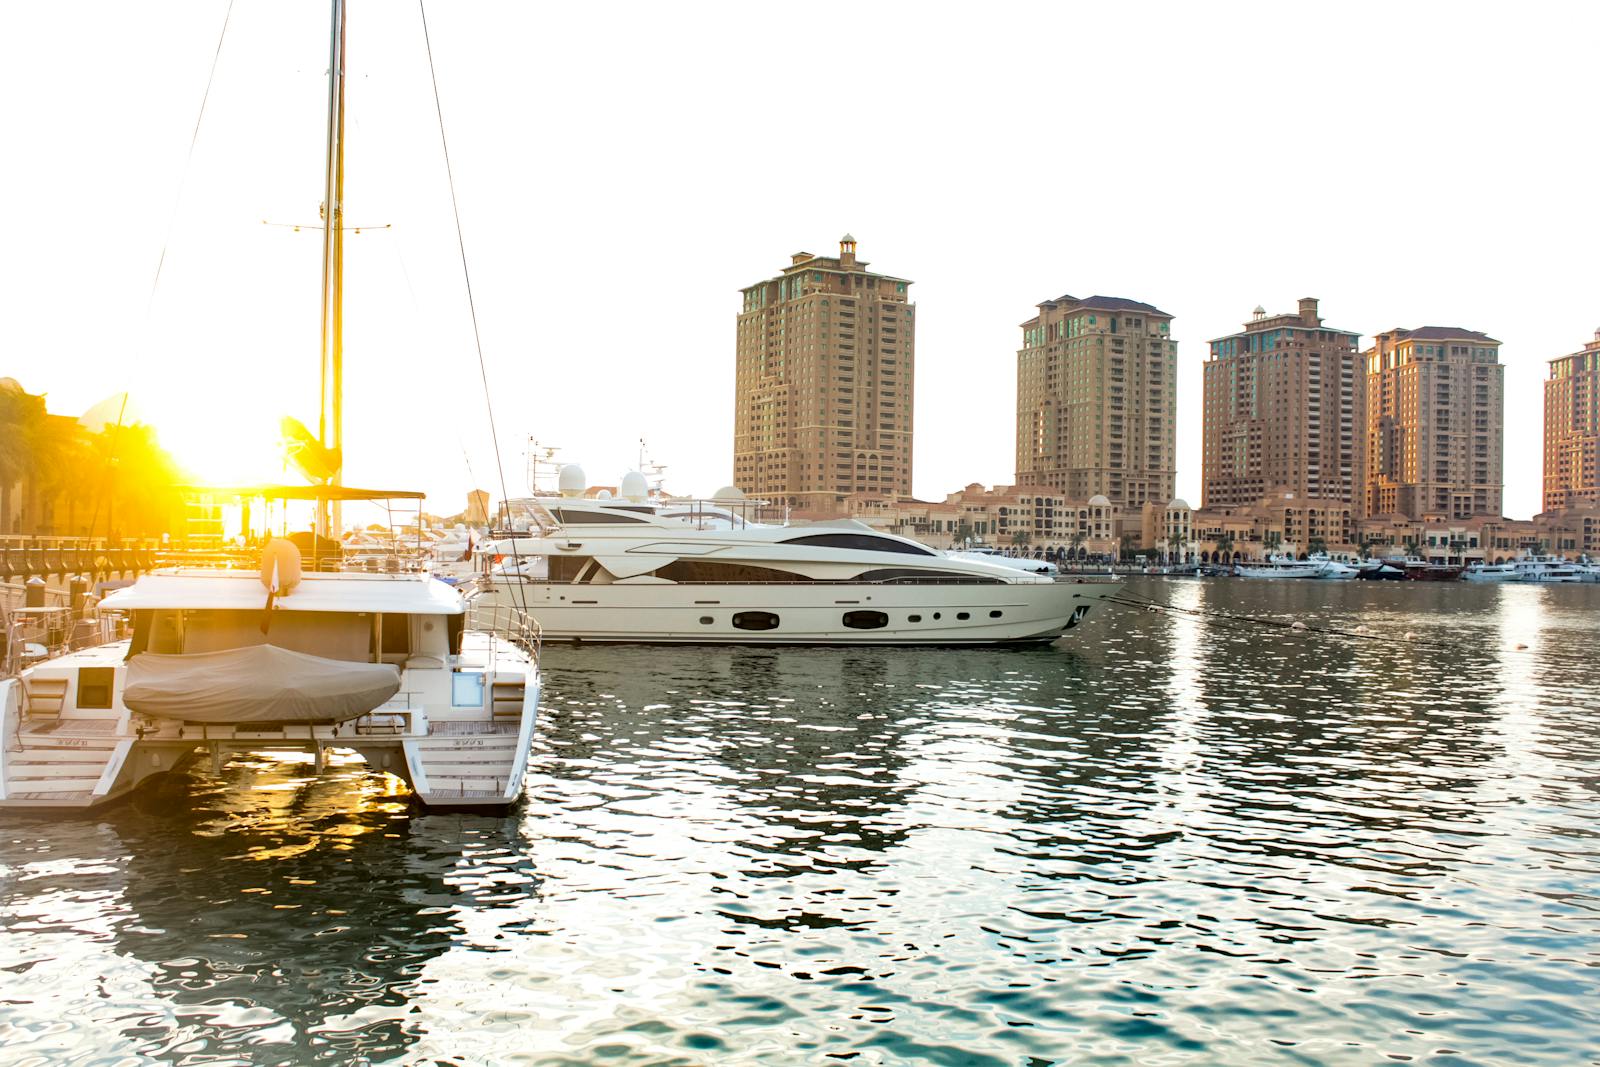
- Average annual increase in COP attendees, 1995 to 2024: +65.0%
- COP29 party size: 113 delegates (4.2 per 100,000 residents)
- Most attended year: COP28 (Dubai 2023)
22. Tajikistan
- Average annual increase in COP attendees, 1995 to 2024: +66.1%
- COP29 party size: 104 delegates (1.0 per 100,000 residents)
- Most attended year: COP28 (Dubai 2023)
21. Rwanda
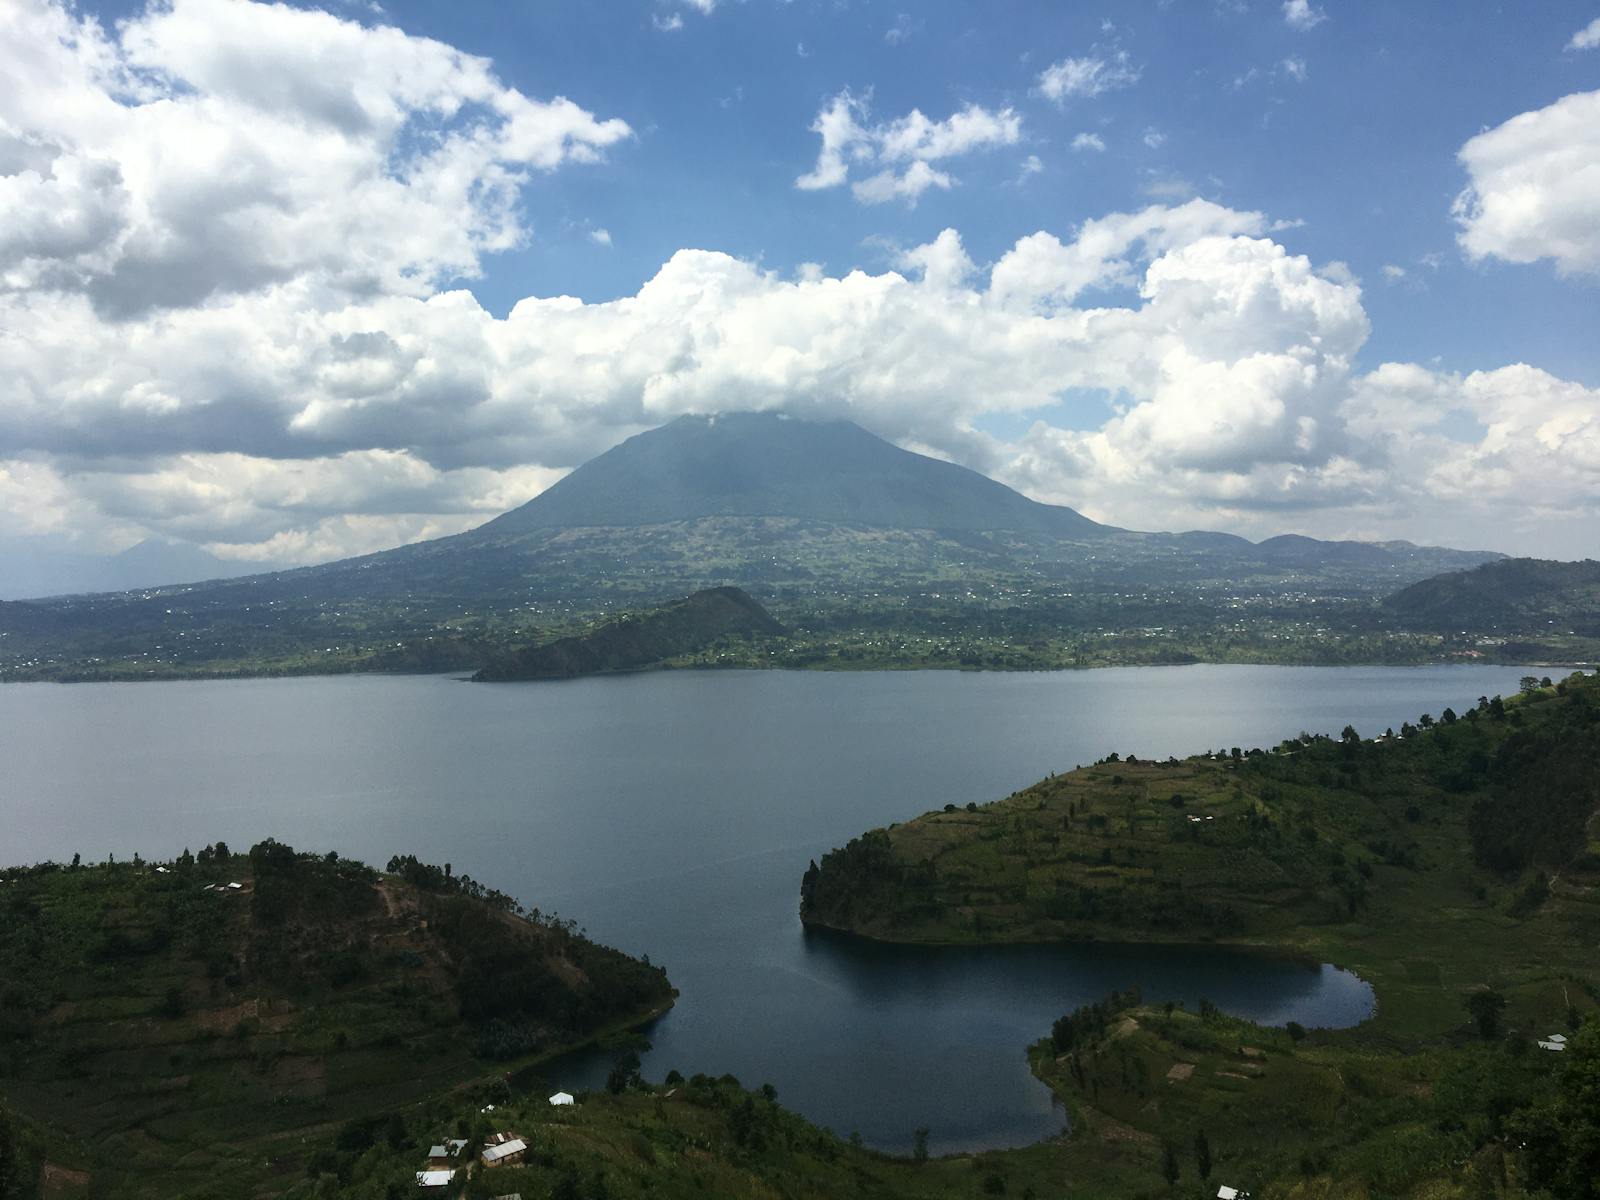
- Average annual increase in COP attendees, 1995 to 2024: +67.2%
- COP29 party size: 113 delegates (0.8 per 100,000 residents)
- Most attended year: COP28 (Dubai 2023)
20. Pakistan
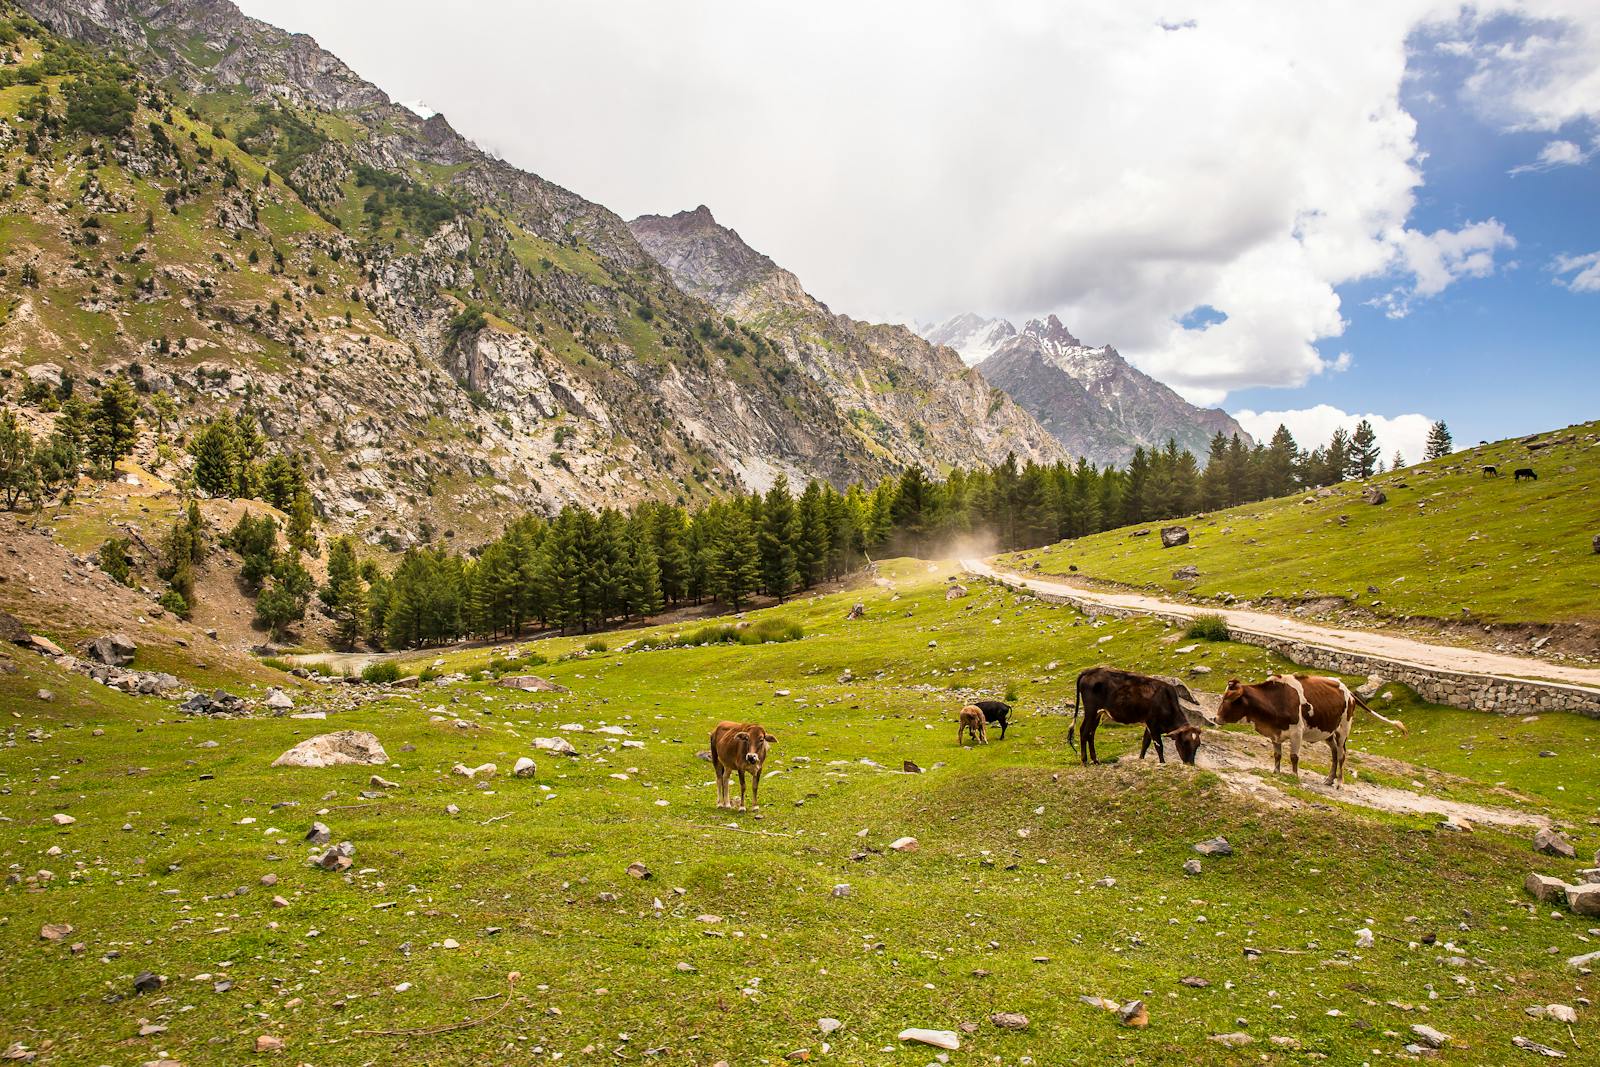
- Average annual increase in COP attendees, 1995 to 2024: +70.2%
- COP29 party size: 113 delegates (0.0 per 100,000 residents)
- Most attended year: COP29 (Baku 2024)
19. Senegal
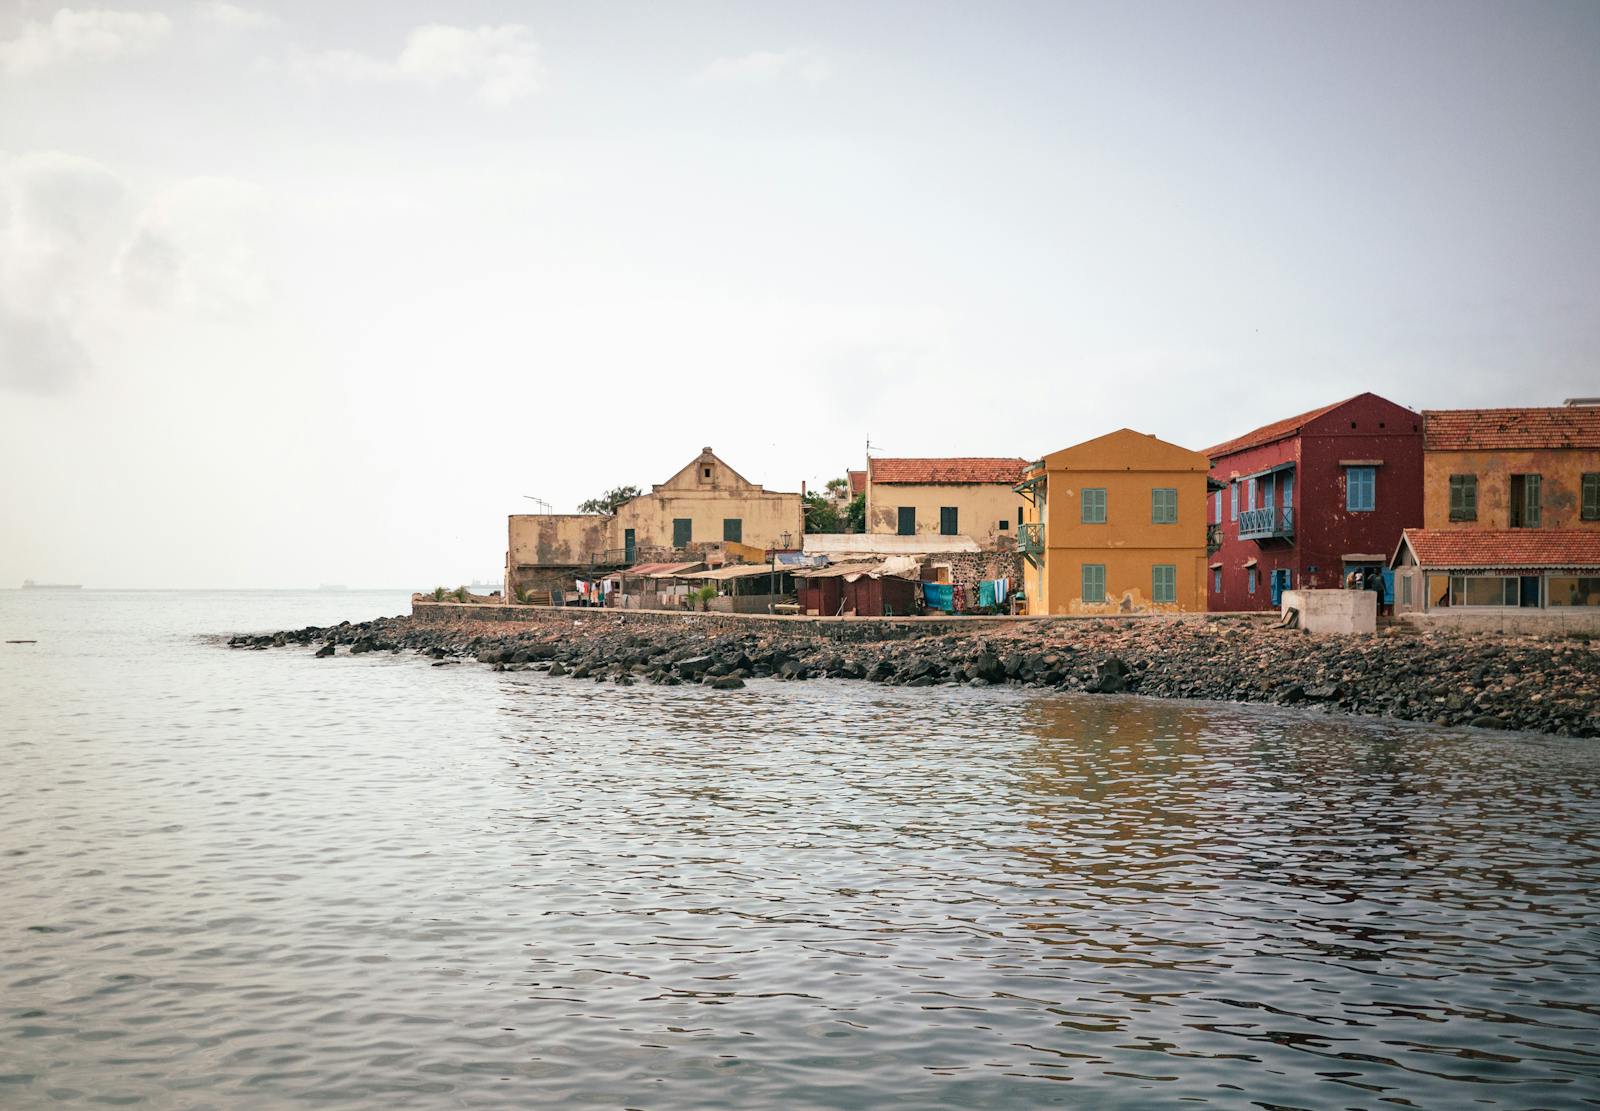
- Average annual increase in COP attendees, 1995 to 2024: +70.7%
- COP29 party size: 173 delegates (1.0 per 100,000 residents)
- Most attended year: COP28 (Dubai 2023)
18. Benin
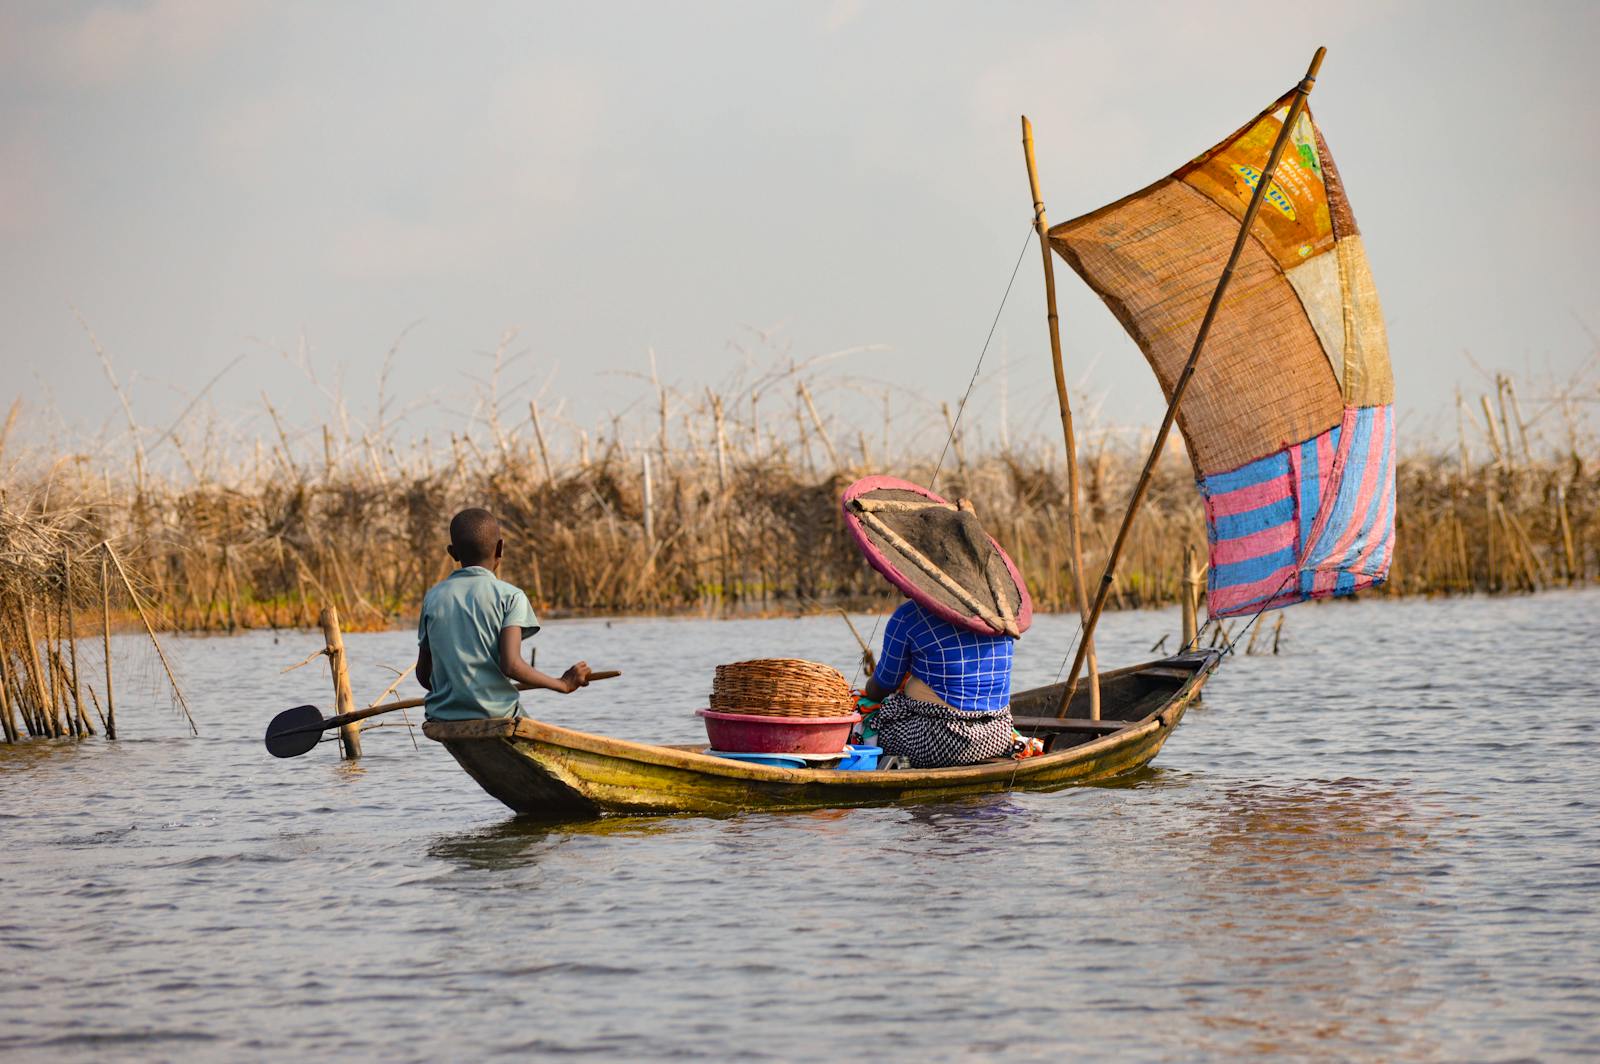
- Average annual increase in COP attendees, 1995 to 2024: +72.7%
- COP29 party size: 121 delegates (0.9 per 100,000 residents)
- Most attended year: COP28 (Dubai 2023)
17. Russia

- Average annual increase in COP attendees, 1995 to 2024: +72.9%
- COP29 party size: 900 delegates (0.6 per 100,000 residents)
- Most attended year: COP29 (Baku 2024)
16. Mali
- Average annual increase in COP attendees, 1995 to 2024: +77.8%
- COP29 party size: 56 delegates (0.2 per 100,000 residents)
- Most attended year: COP22 (Marrakech 2016)
15. Mongolia
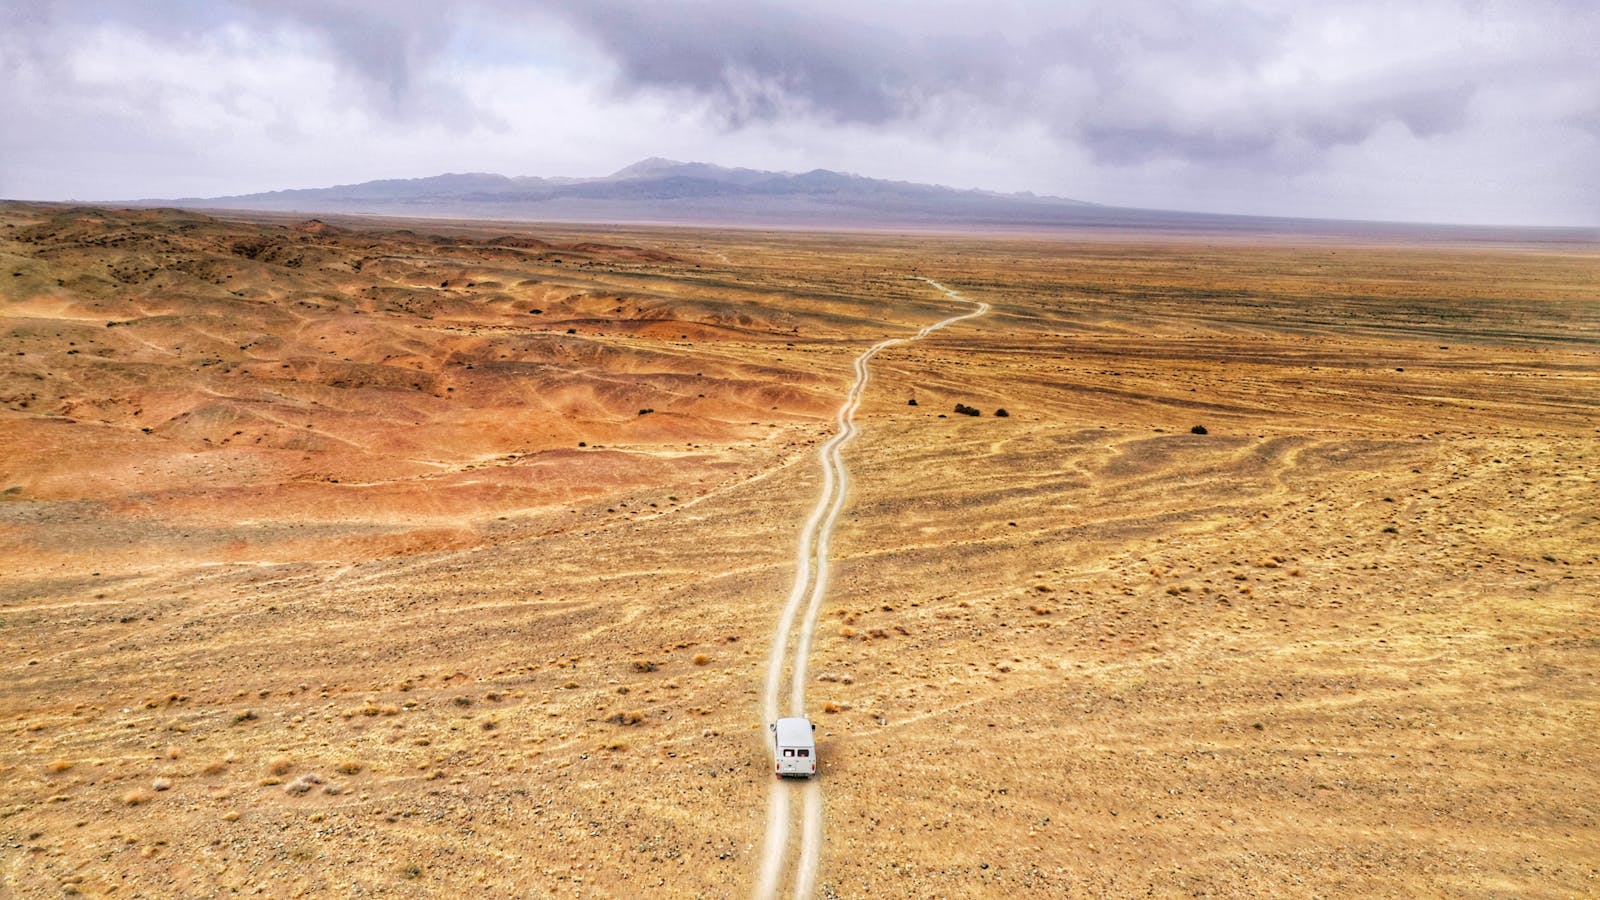
- Average annual increase in COP attendees, 1995 to 2024: +89.5%
- COP29 party size: 83 delegates (2.4 per 100,000 residents)
- Most attended year: COP29 (Baku 2024)
14. Morocco
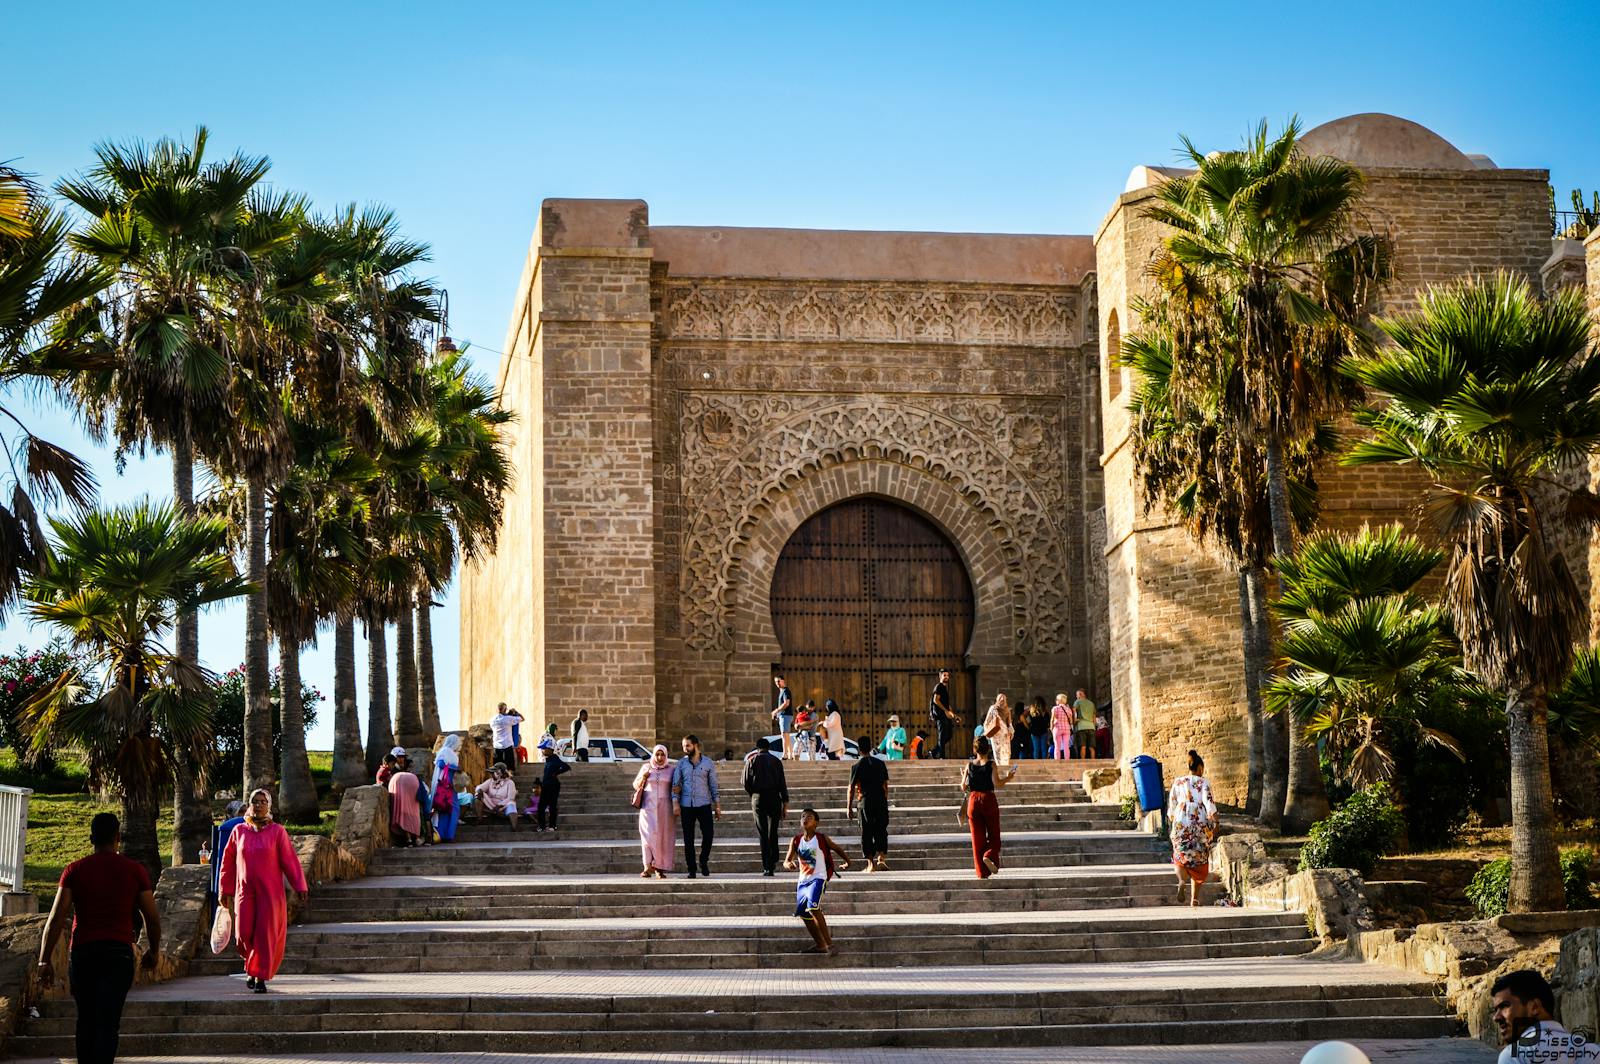
- Average annual increase in COP attendees, 1995 to 2024: +90.6%
- COP29 party size: 194 delegates (0.5 per 100,000 residents)
- Most attended year: COP22 (Marrakech 2016)
13. Zimbabwe
- Average annual increase in COP attendees, 1995 to 2024: +91.7%
- COP29 party size: 238 delegates (1.4 per 100,000 residents)
- Most attended year: COP28 (Dubai 2023)
12. Jordan
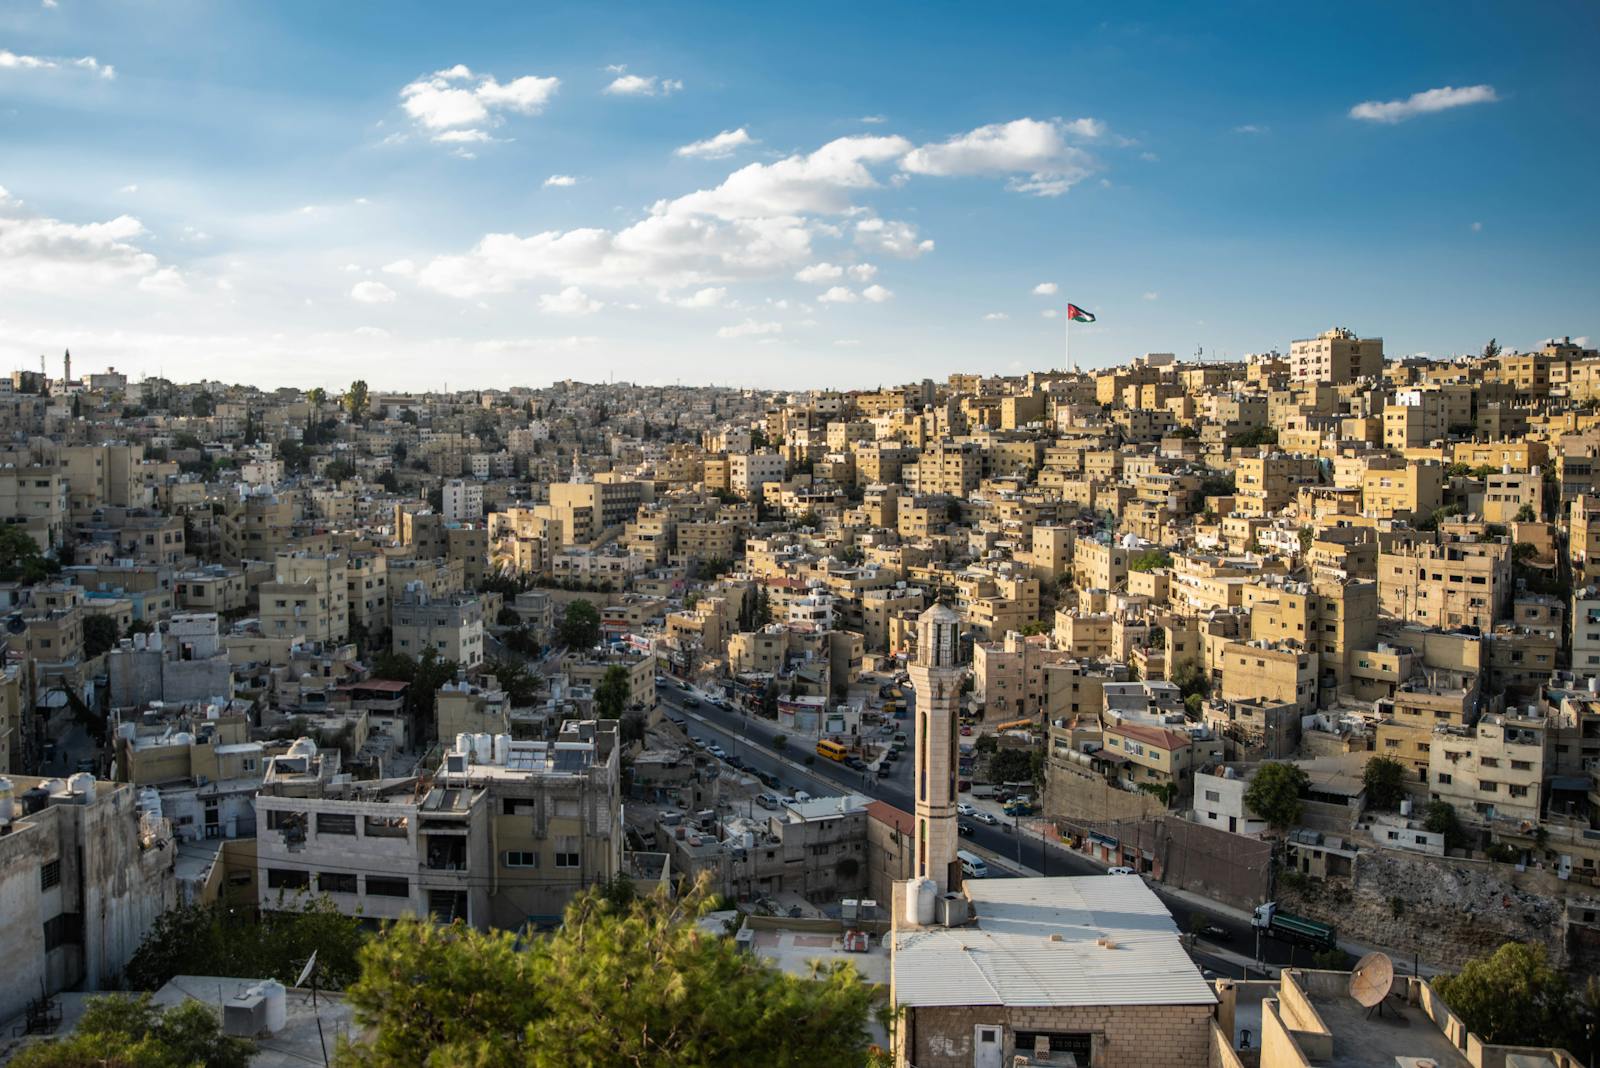
- Average annual increase in COP attendees, 1995 to 2024: +94.3%
- COP29 party size: 89 delegates (0.8 per 100,000 residents)
- Most attended year: COP28 (Dubai 2023)
11. Madagascar

- Average annual increase in COP attendees, 1995 to 2024: +95.7%
- COP29 party size: 125 delegates (0.4 per 100,000 residents)
- Most attended year: COP29 (Baku 2024)
10. Somalia
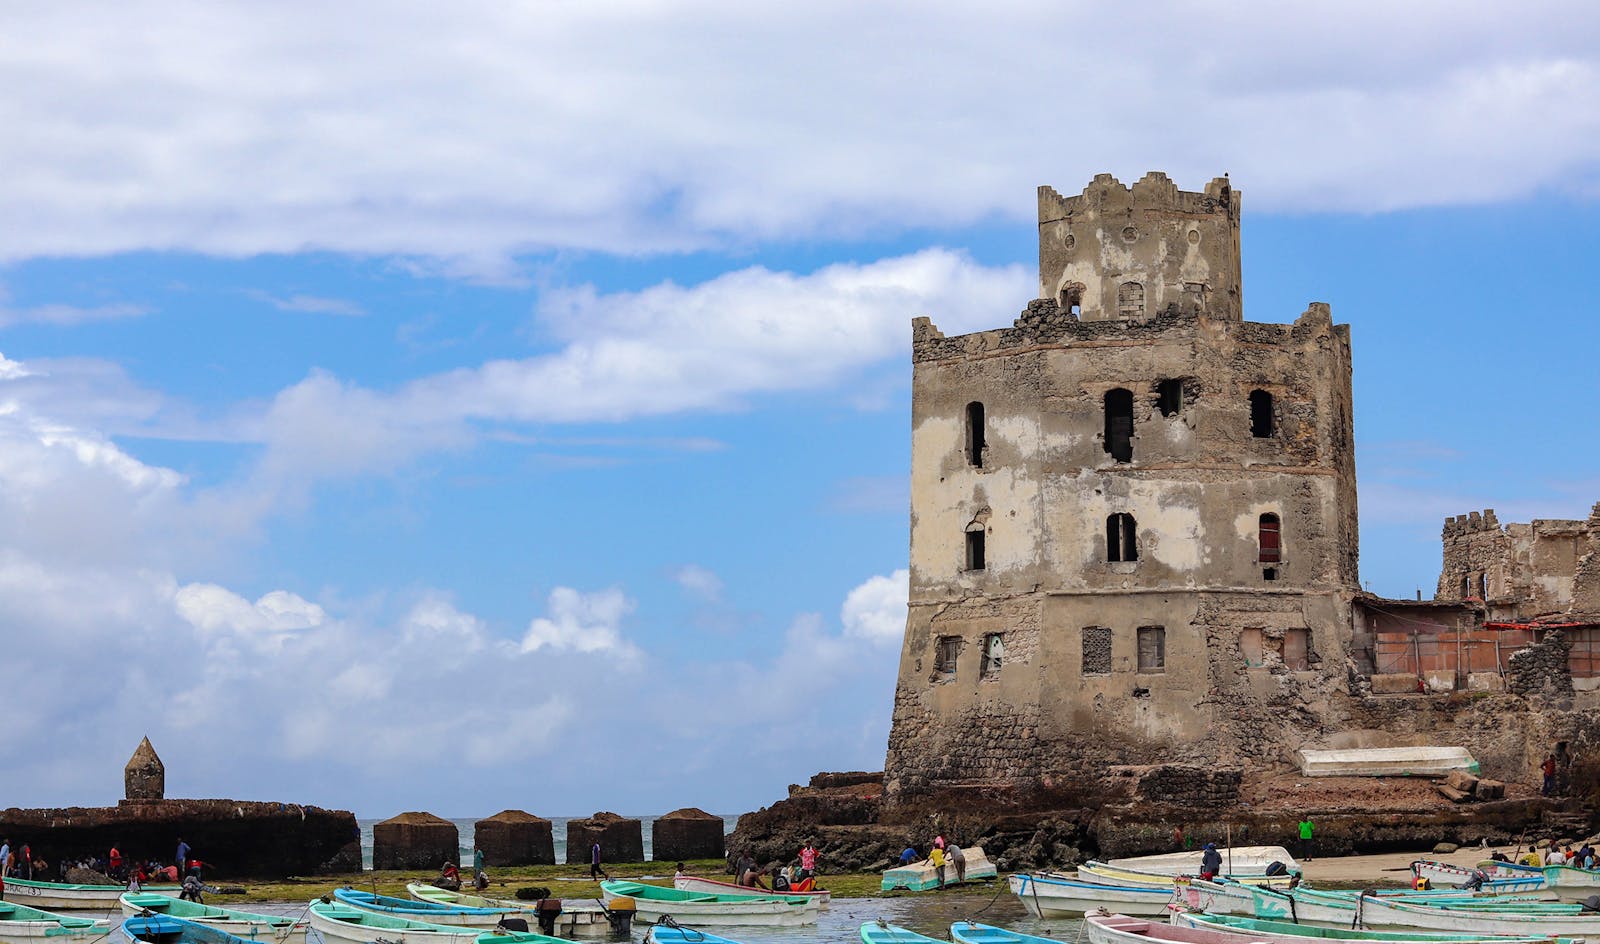
- Average annual increase in COP attendees, 1995 to 2024: +100.2%
- COP29 party size: 168 delegates (0.9 per 100,000 residents)
- Most attended year: COP28 (Dubai 2023)
9. Cameroon
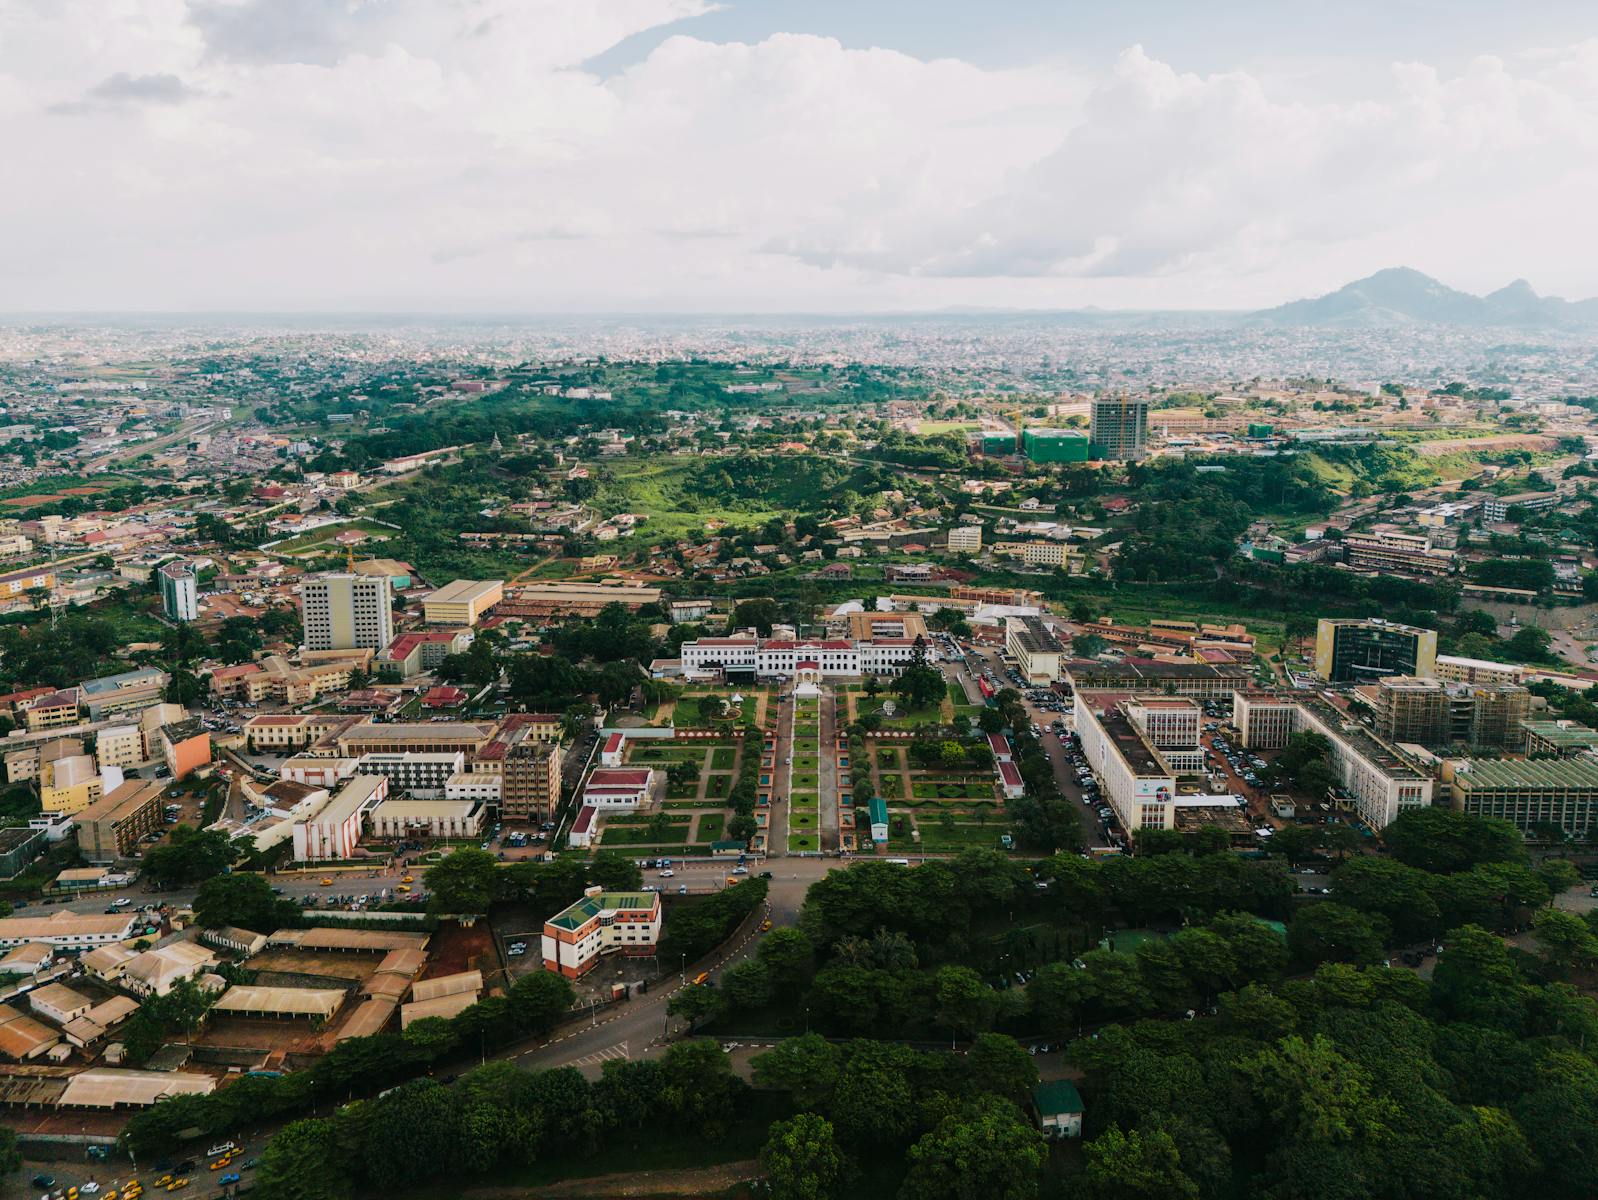
- Average annual increase in COP attendees, 1995 to 2024: +103.9%
- COP29 party size: 73 delegates (0.3 per 100,000 residents)
- Most attended year: COP21 (Paris 2015)
8. Central African Republic

- Average annual increase in COP attendees, 1995 to 2024: +111.3%
- COP29 party size: 56 delegates (1.0 per 100,000 residents)
- Most attended year: COP28 (Dubai 2023)
7. Chad
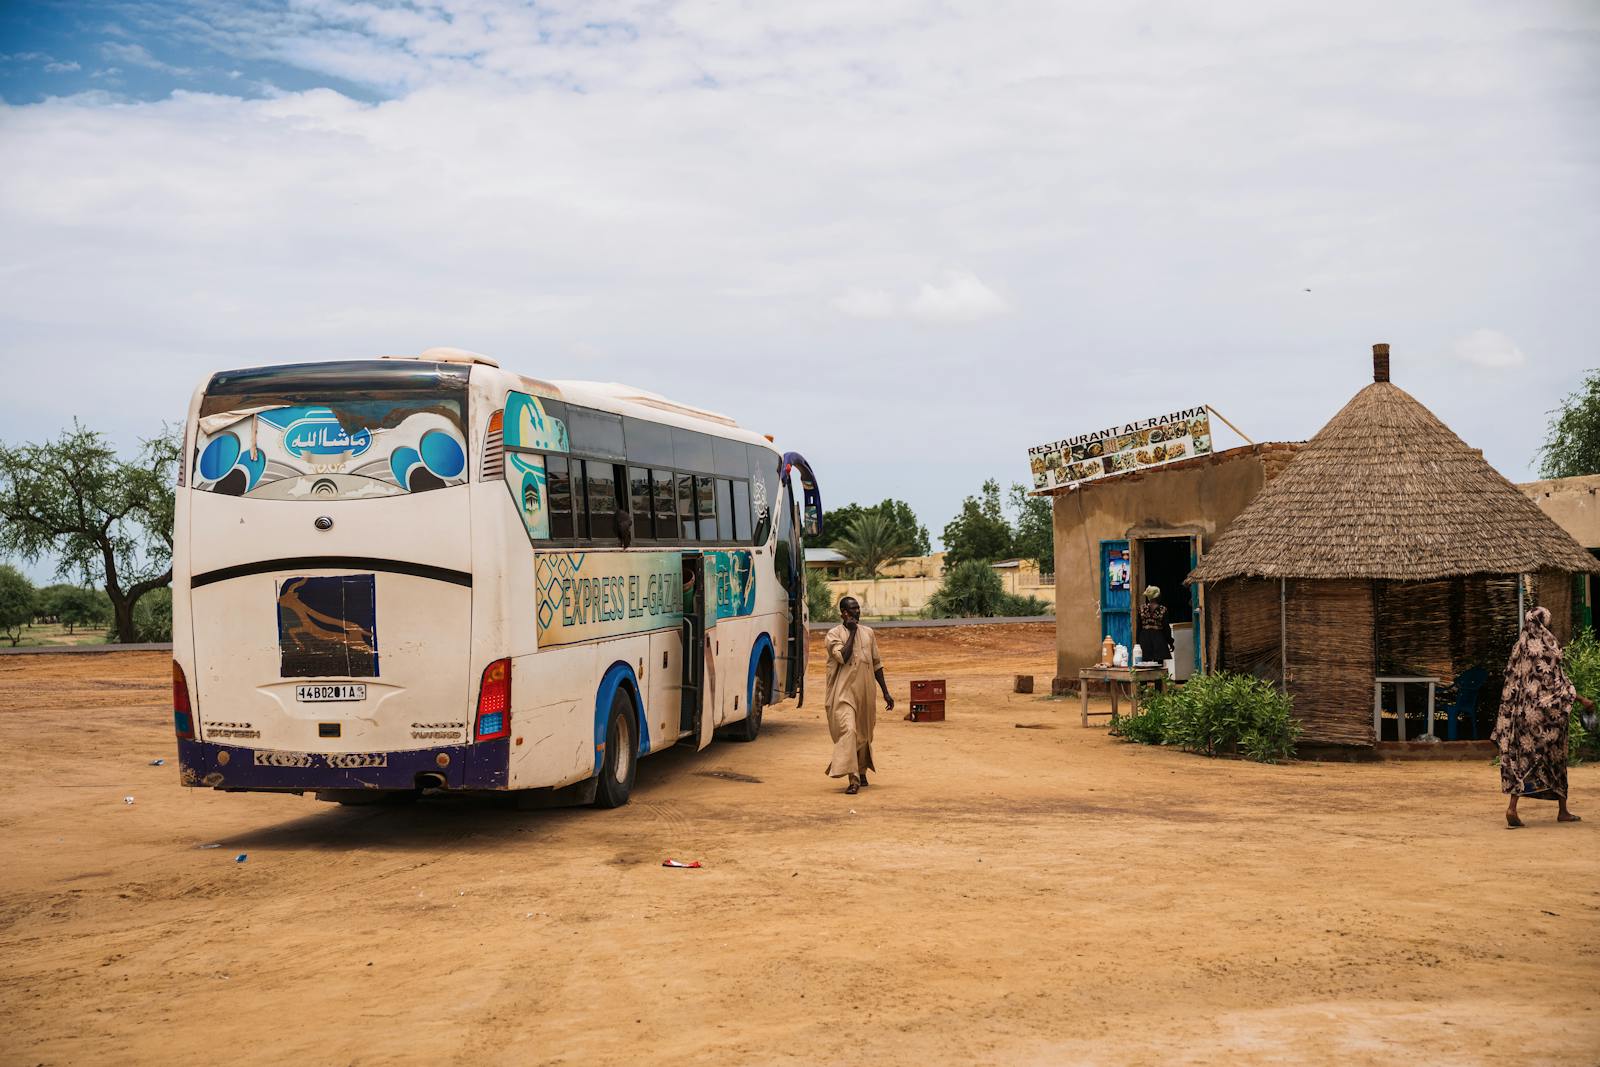
- Average annual increase in COP attendees, 1995 to 2024: +116.9%
- COP29 party size: 126 delegates (0.7 per 100,000 residents)
- Most attended year: COP28 (Dubai 2023)
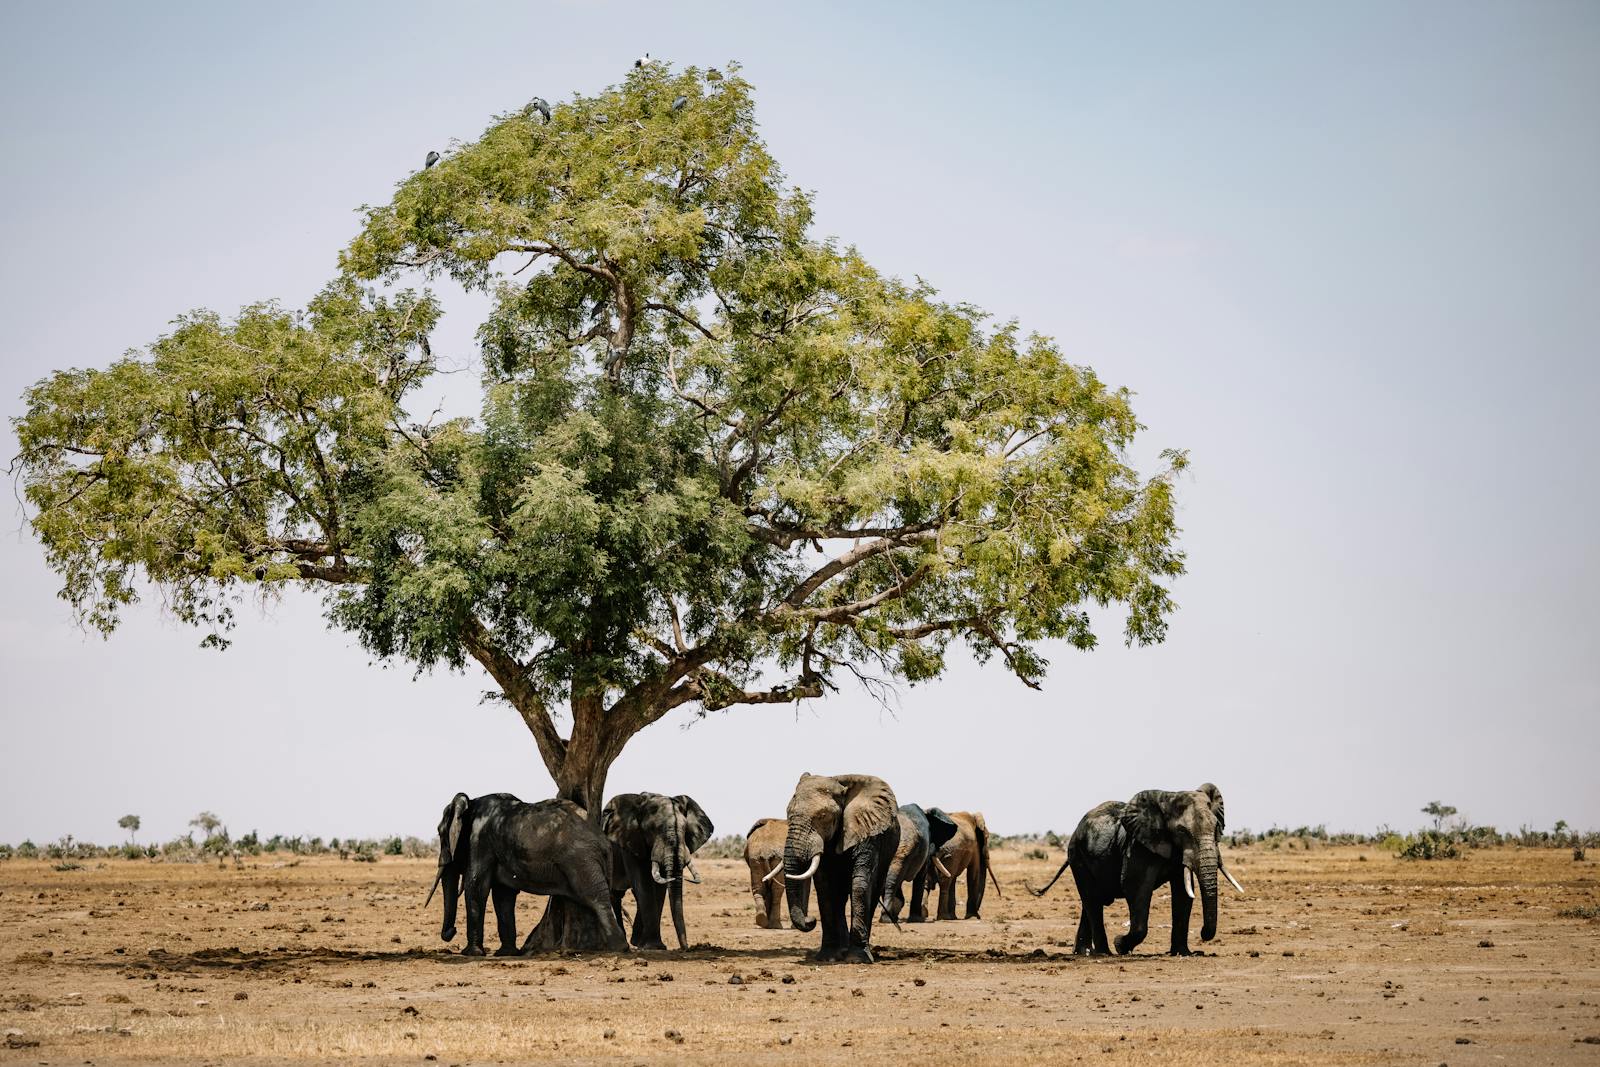
6. Kenya

- Average annual increase in COP attendees, 1995 to 2024: +123.4%
- COP29 party size: 215 delegates (0.4 per 100,000 residents)
- Most attended year: COP28 (Dubai 2023)
5. Israel
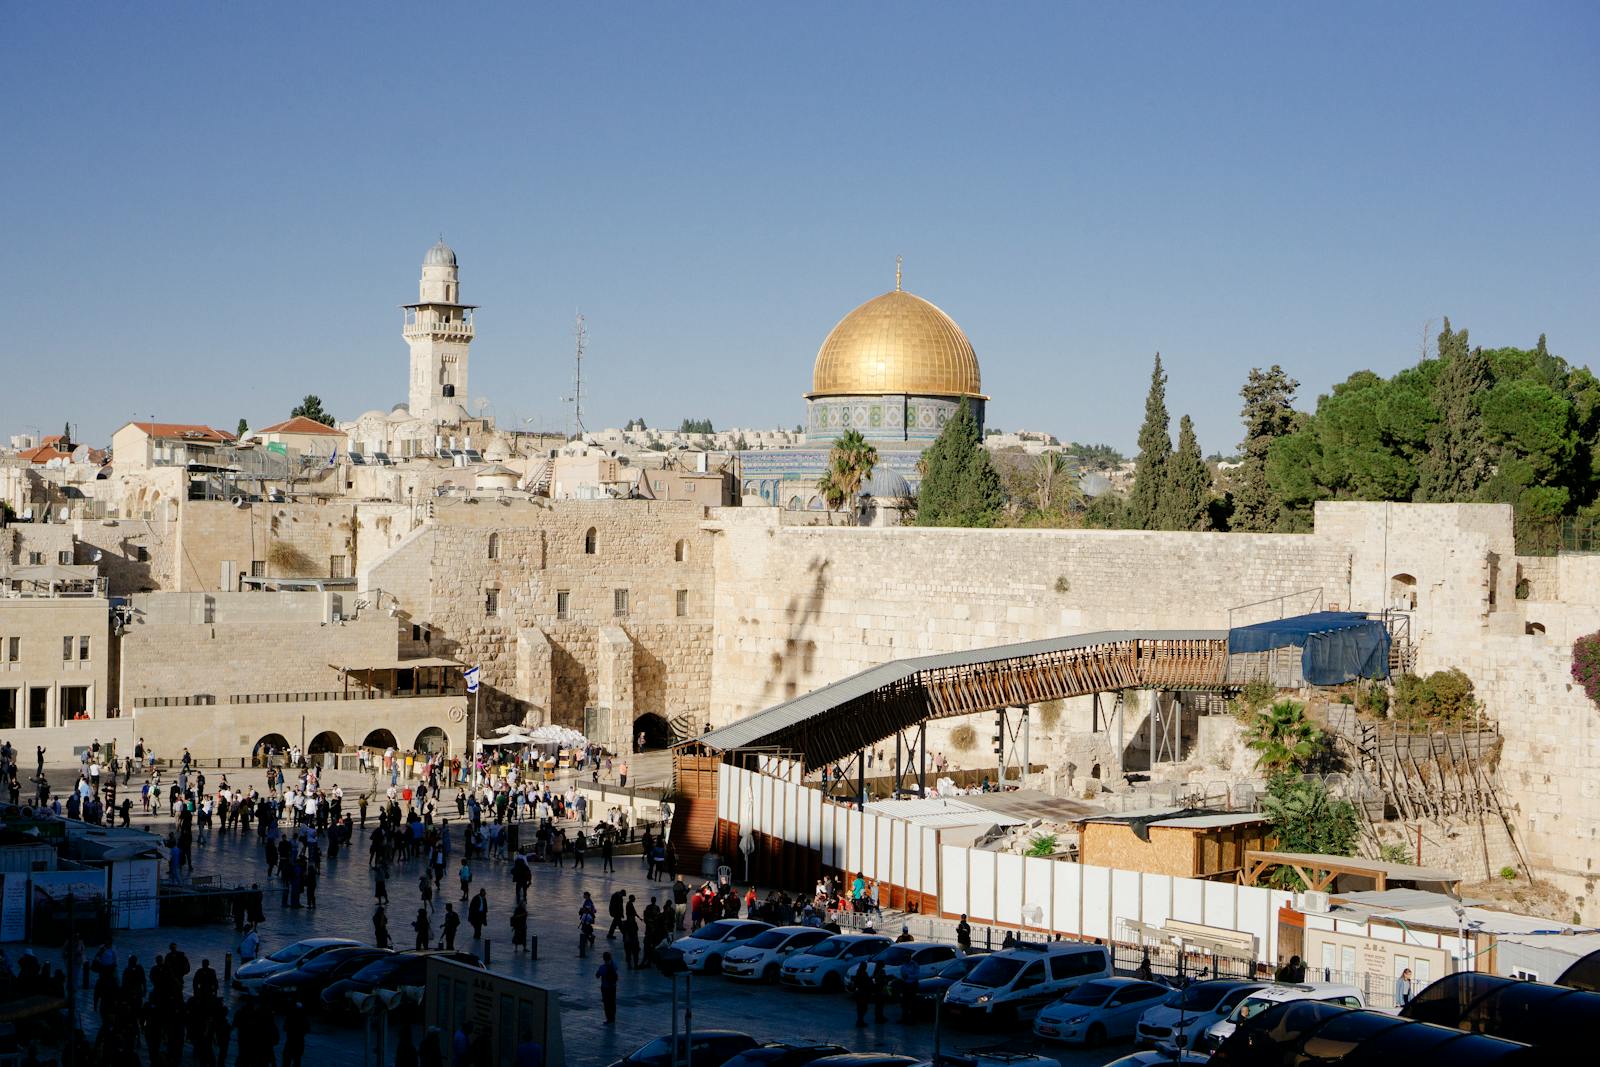
- Average annual increase in COP attendees, 1995 to 2024: +126.4%
- COP29 party size: 221 delegates (2.3 per 100,000 residents)
- Most attended year: COP28 (Dubai 2023)
4. Burkina Faso
- Average annual increase in COP attendees, 1995 to 2024: +127.5%
- COP29 party size: 181 delegates (0.8 per 100,000 residents)
- Most attended year: COP28 (Dubai 2023)
3. Mauritania
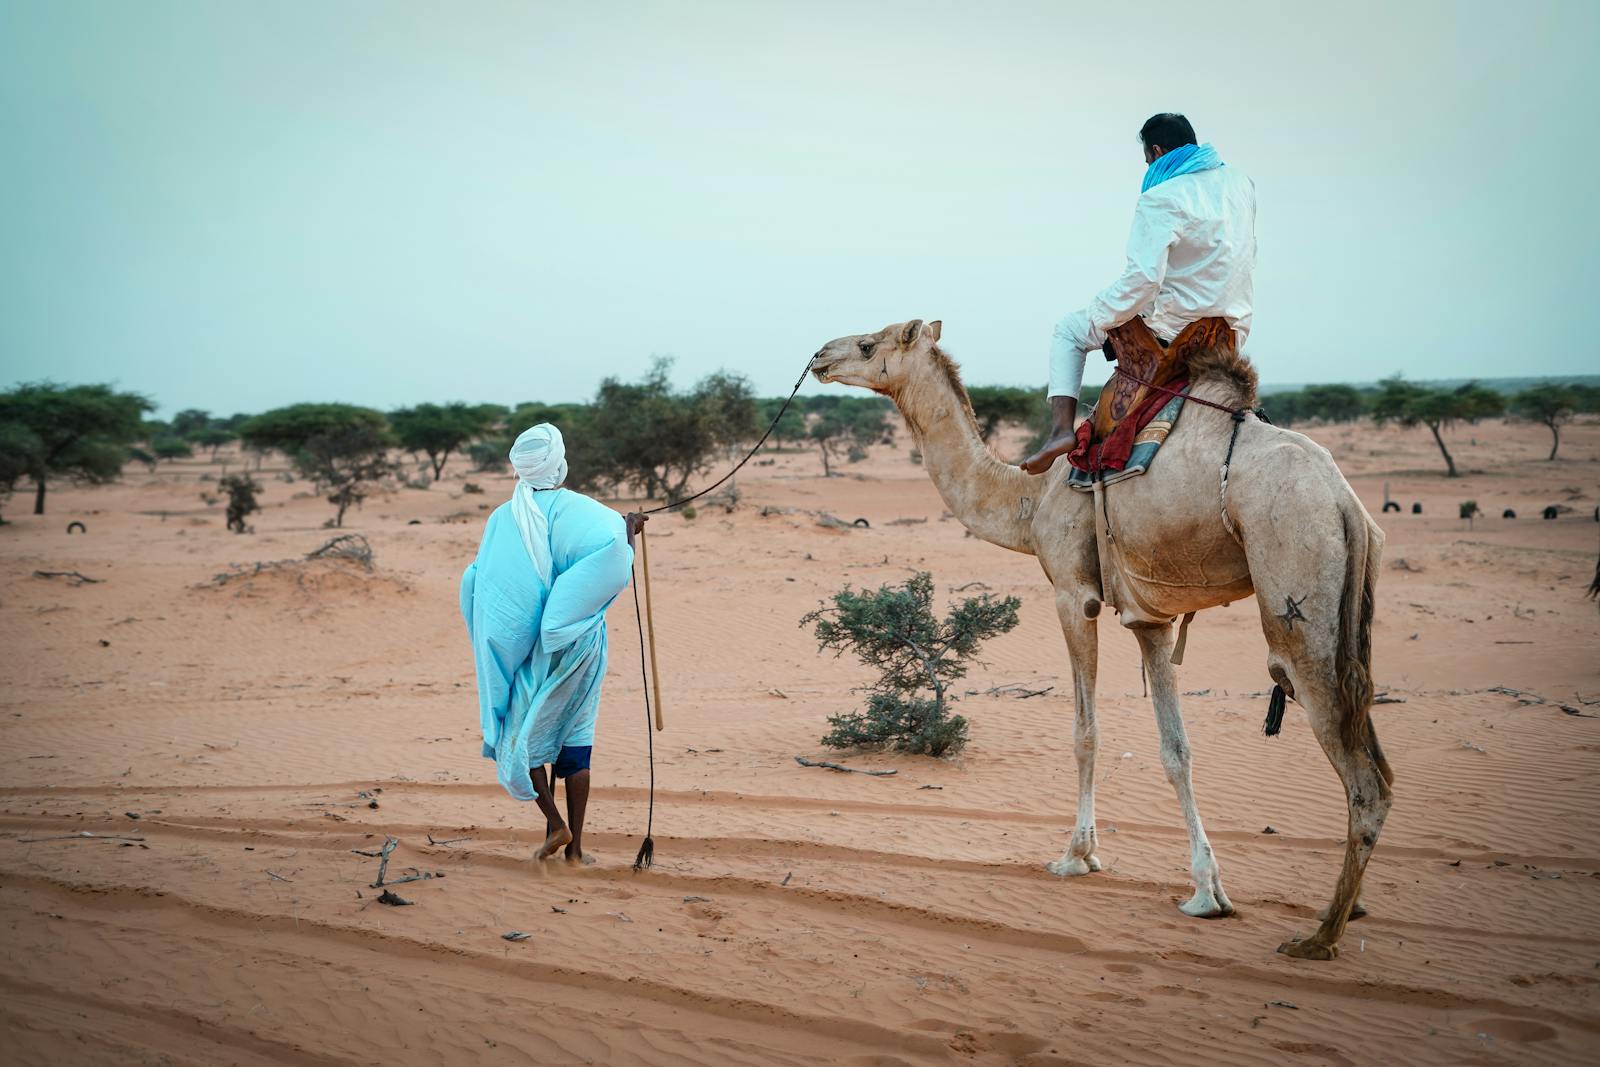
- Average annual increase in COP attendees, 1995 to 2024: +179.6%
- COP29 party size: 178 delegates (3.7 per 100,000 residents)
- Most attended year: COP28 (Dubai 2023)
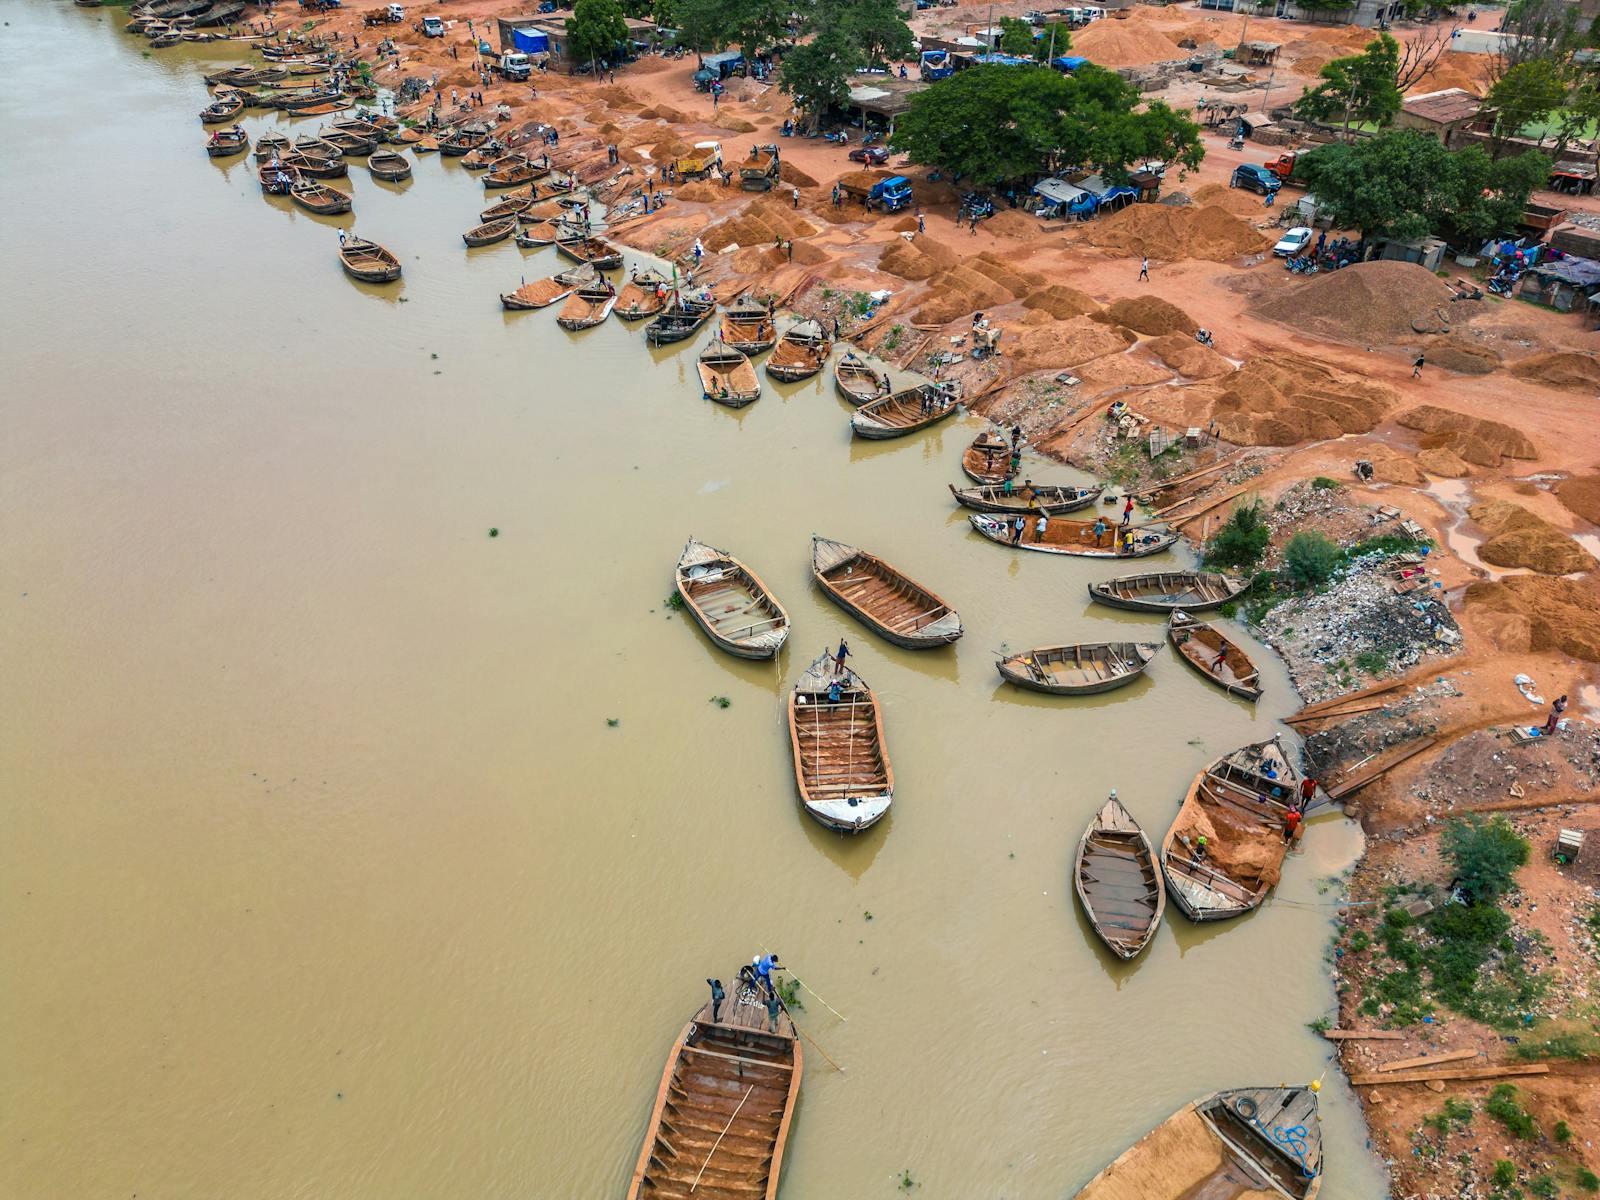
2. Republic of the Congo
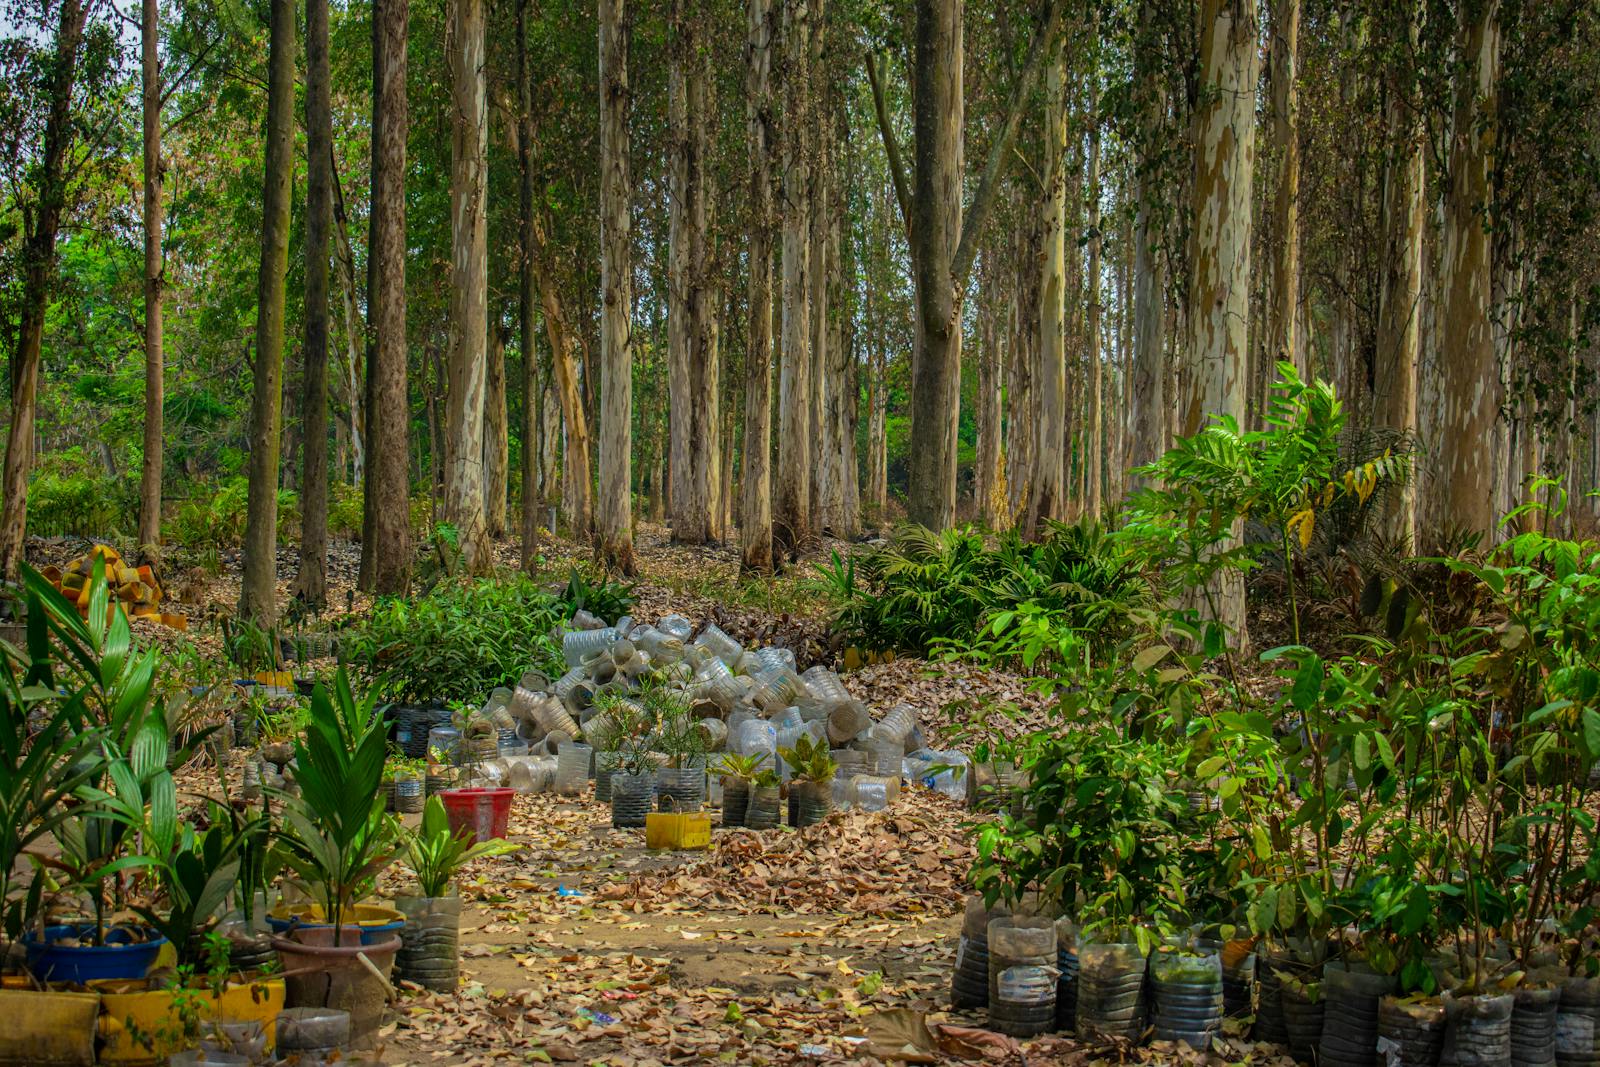
- Average annual increase in COP attendees, 1995 to 2024: +266.0%
- COP29 party size: 199 delegates (3.3 per 100,000 residents)
- Most attended year: COP28 (Dubai 2023)
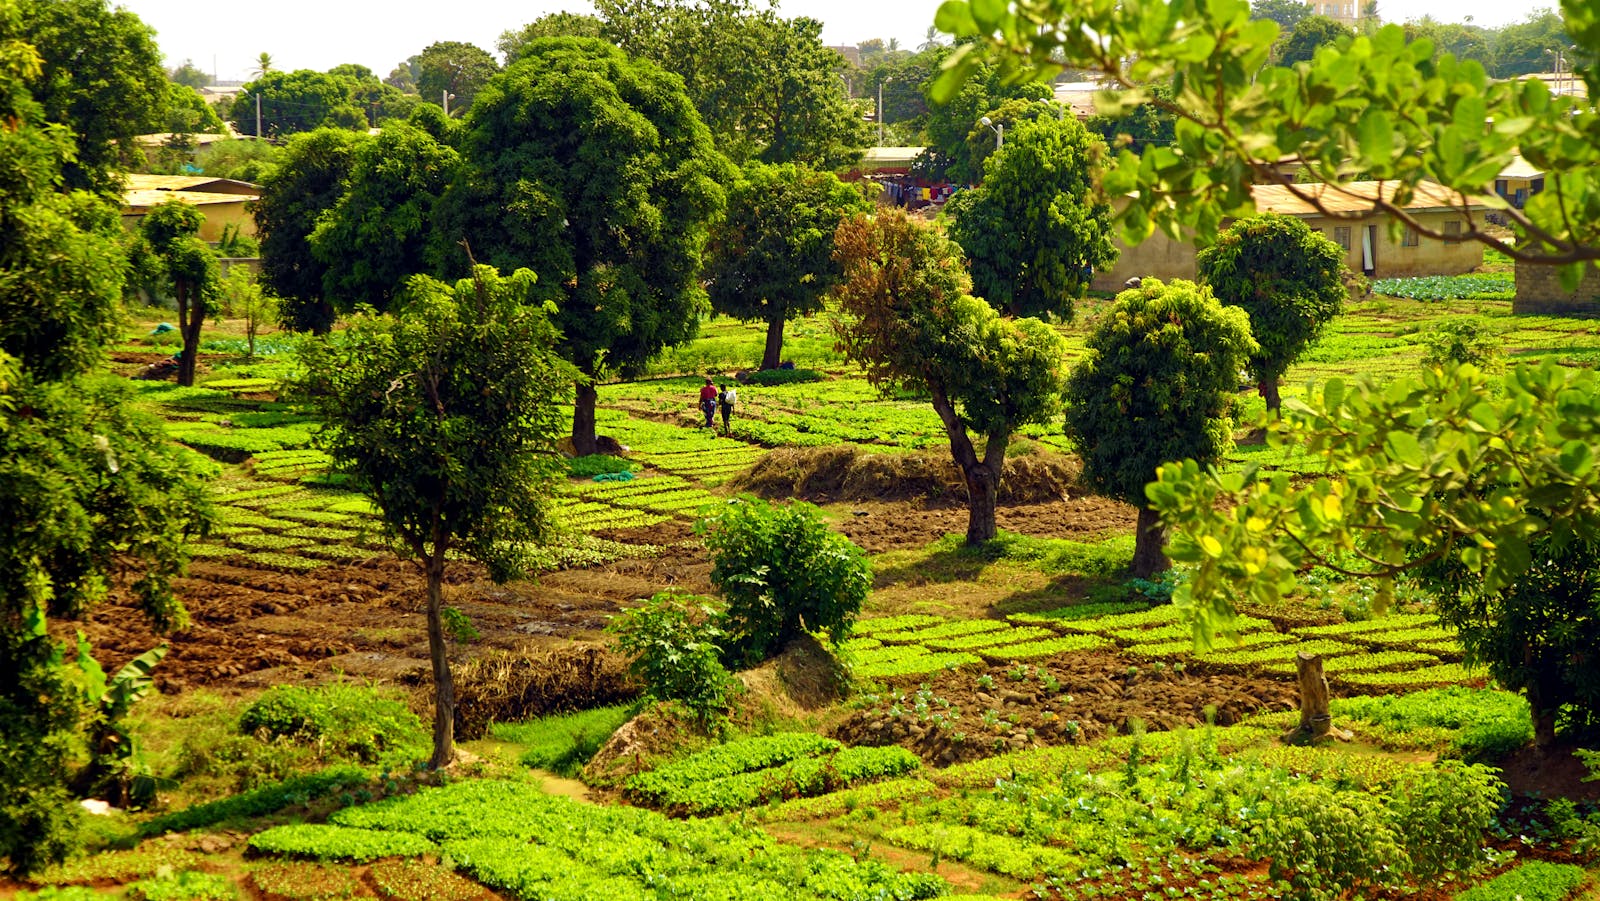
1. Côte d'Ivoire
- Average annual increase in COP attendees, 1995 to 2024: +278.3%
- COP29 party size: 221 delegates (0.8 per 100,000 residents)
- Most attended year: COP22 (Marrakech 2016)