
10 U.S. Cities With the Dirtiest Air
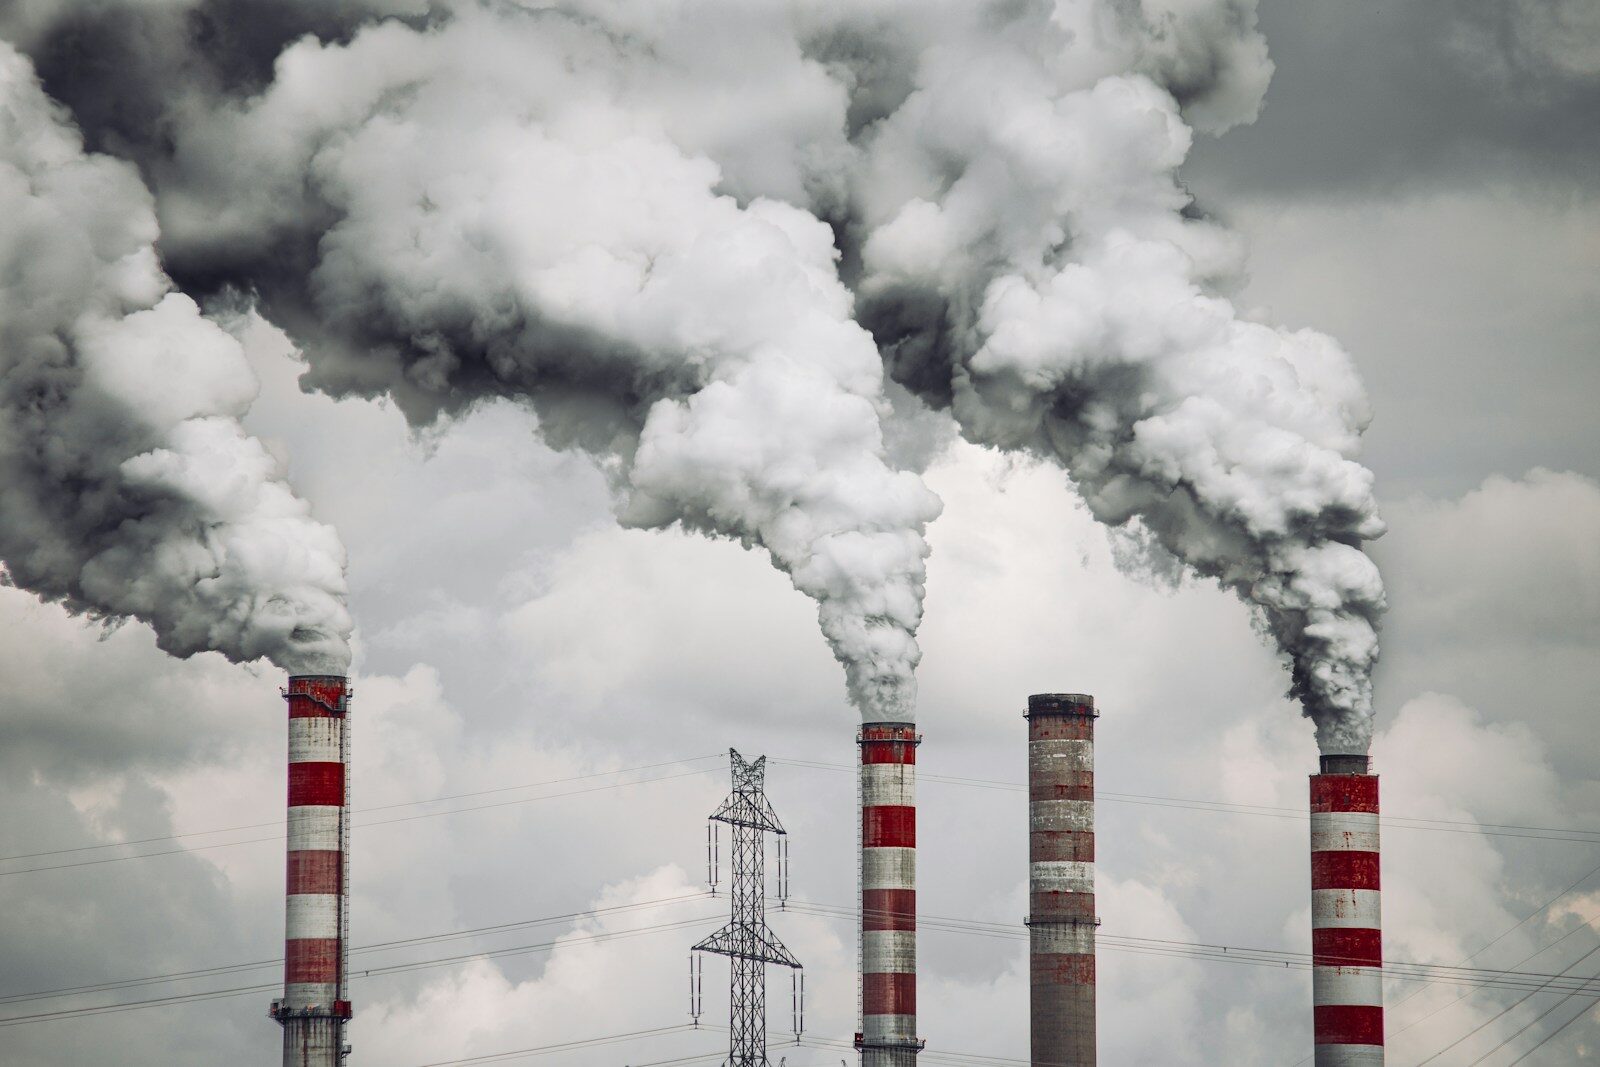
Heat trapping greenhouse gasses generated through fossil fuel consumption have been identified as a leading driver of the global warming phenomenon. But fossil fuel by-products are not only harming the environment and altering the global climate, they also present a significant threat to public health.
The air pollution created by burning fossil fuels contains microscopic particles which, in high enough quantities, can reduce air quality and degrade health outcomes across large populations. According to the National Institutes of Health, air pollution contributes to an estimated 6.5 million deaths globally each year. One of the most dangerous atmospheric pollutants is a category of fine particulate matter measuring 2.5 micrometers or less – about one-30th the diameter of a human hair – commonly known as PM2.5. Most PM2.5 is released into the atmosphere from industrial activity, power plants, and automobiles.
Even short-term exposure to high concentrations of PM2.5 has been linked to multiple respiratory and heart conditions, which can often require urgent medical attention, and even cause premature death. Certain demographic groups, including children, older adults, and those with heart or lung conditions are especially vulnerable.
Encouragingly, PM2.5 concentrations have been falling globally in recent years. Still, across the United States, there are multiple major cities where residents are regularly exposed to dangerous levels of air pollution.
Using data from the American Lung Association’s 2026 State of the Air Report, Climate Crisis 247 identified the 10 U.S. cities with the dirtiest air. We ranked all metro areas included in the study on the average number of days each year when concentrations of PM2.5 are deemed unhealthy for sensitive groups, unhealthy for the general population, very unhealthy, or hazardous, as determined by the Environmental Protection Agency’s Air Quality Index. Rankings are based on a weighted annualized average that assigns higher values to greater PM2.5 concentrations using data from 2022 through 2024. Supplemental data on average annual PM2.5 concentrations and county level air pollution are also from the ALA. Population data are from the U.S. Census Bureau’s 2024 American Community Survey. A complete methodology is available directly from the report.
The 10 metro areas on this list are collectively home to over 21.6 million people. Among them, the weighted average number of days with unhealthy levels of air pollution ranges from about 10 to 38 per year. Places that have an average annual PM2.5 concentration that exceeds 9 micrograms per cubic meter were assigned a failing grade from the ALA, and notably, air pollution in only two metro areas on this list fell below that threshold.
10. McAllen-Edinburg, Texas
- Days with unhealthy concentrations of PM2.5 (weighted average): 9.8 days per year
- Average annual concentration of PM2.5: 10.3 micrograms per cubic meter (Fail)
- County in metro area with the highest PM2.5 concentrations: Hidalgo County, Texas
- Metro area population: 914,820
9. Bismarck, North Dakota
- Days with unhealthy concentrations of PM2.5 (weighted average): 10.0 days per year
- Average annual concentration of PM2.5: 8.5 micrograms per cubic meter (Pass)
- County in metro area with the highest PM2.5 concentrations: Burleigh County, North Dakota
- Metro area population: 138,774
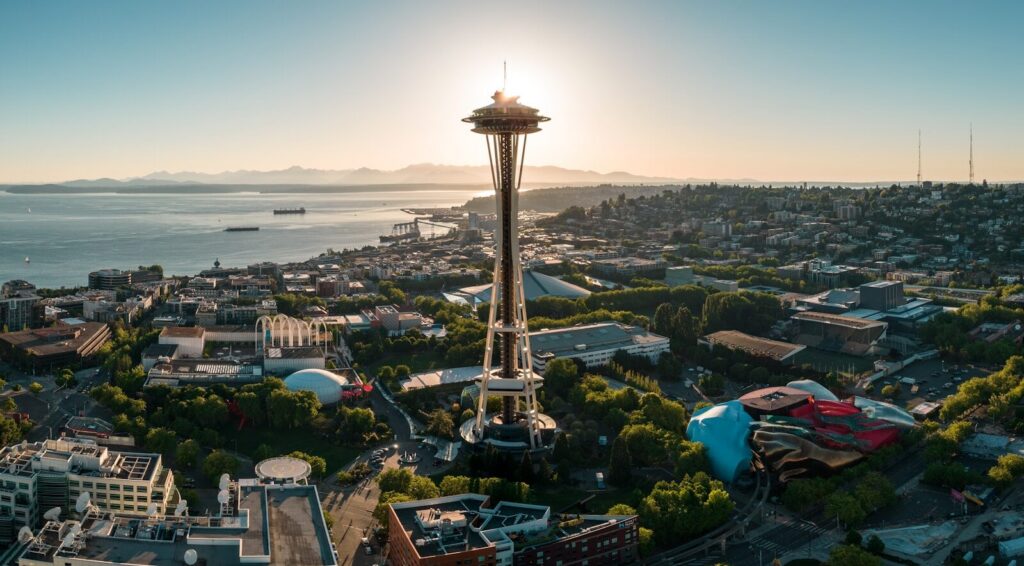
8. Seattle-Tacoma, Washington
- Days with unhealthy concentrations of PM2.5 (weighted average): 11.3 days per year
- Average annual concentration of PM2.5: 8.5 micrograms per cubic meter (Pass)
- County in metro area with the highest PM2.5 concentrations: Snohomish County, Washington
- Metro area population: 4,145,494
7. Los Angeles-Long Beach, California
- Days with unhealthy concentrations of PM2.5 (weighted average): 13.0 days per year
- Average annual concentration of PM2.5: 12.9 micrograms per cubic meter (Fail)
- County in metro area with the highest PM2.5 concentrations: Riverside County, California
- Metro area population: 12,927,614
6. Fresno-Hanford-Corcoran, California
- Days with unhealthy concentrations of PM2.5 (weighted average): 16.5 days per year
- Average annual concentration of PM2.5: 13.6 micrograms per cubic meter (Fail)
- County in metro area with the highest PM2.5 concentrations: Fresno County, California
- Metro area population: 1,189,557
5. Visalia, California
- Days with unhealthy concentrations of PM2.5 (weighted average): 19.0 days per year
- Average annual concentration of PM2.5: 13.2 micrograms per cubic meter (Fail)
- County in metro area with the highest PM2.5 concentrations: Tulare County, California
- Metro area population: 483,546
4. Brownsville-Harlingen-Raymondville, Texas
- Days with unhealthy concentrations of PM2.5 (weighted average): 23.7 days per year
- Average annual concentration of PM2.5: 14.4 micrograms per cubic meter (Fail)
- County in metro area with the highest PM2.5 concentrations: Cameron County, Texas
- Metro area population: 431,874
3. Bakersfield-Delano, California
- Days with unhealthy concentrations of PM2.5 (weighted average): 26.2 days per year
- Average annual concentration of PM2.5: 14.7 micrograms per cubic meter (Fail)
- County in metro area with the highest PM2.5 concentrations: Kern County, California
- Metro area population: 922,529
2. Eugene-Springfield, Oregon
- Days with unhealthy concentrations of PM2.5 (weighted average): 33.5 days per year
- Average annual concentration of PM2.5: 13.9 micrograms per cubic meter (Fail)
- County in metro area with the highest PM2.5 concentrations: Lane County, Oregon
- Metro area population: 382,396
1. Fairbanks-College, Alaska
- Days with unhealthy concentrations of PM2.5 (weighted average): 38.3 days per year
- Average annual concentration of PM2.5: 12.3 micrograms per cubic meter (Fail)
- County in metro area with the highest PM2.5 concentrations: Fairbanks North Star Borough, Alaska
- Metro area population: 94,951
More from ClimateCrisis 247
- Climate Denial in America’s Fastest Warming Congressional Districts
- Congressional Candidates With the Strongest Environmental Records
- Fastest Warming Congressional Districts Where Politician is Funded by Fossil Fuel Industry
- America’s Best And Worst Cities To Own An EV





