
10 US Cities Where Climate Change is Making Mosquito Season Much Longer
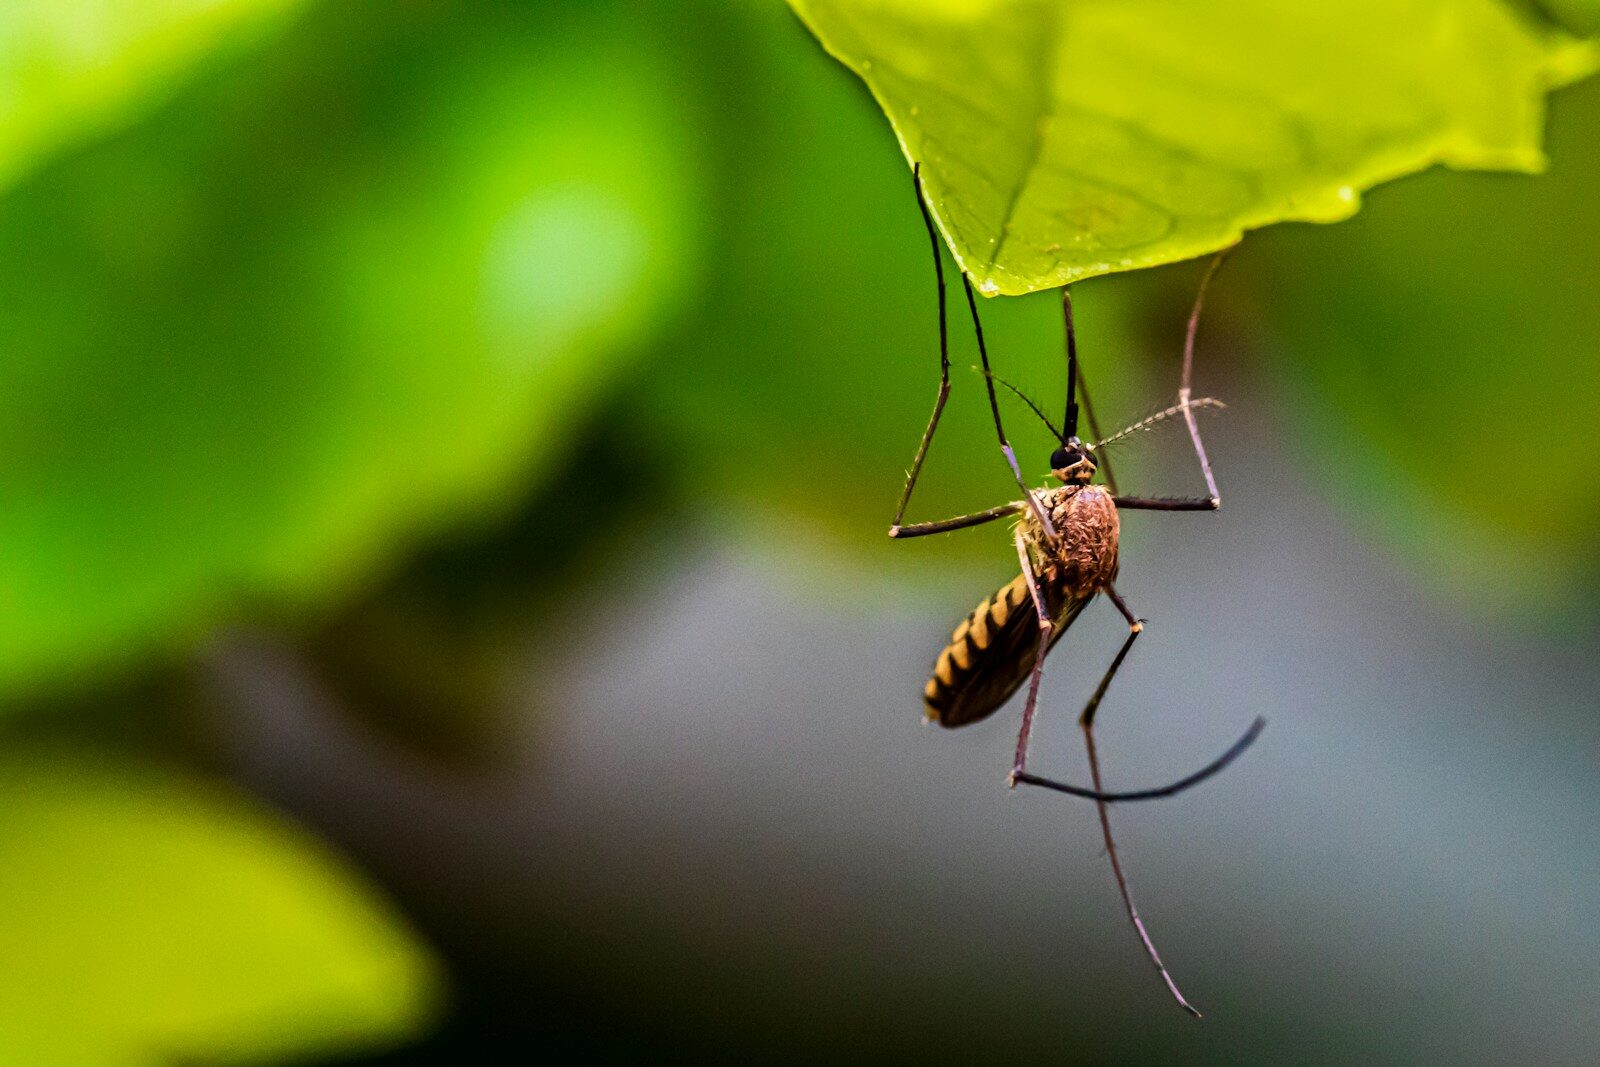
In many parts of the world, the ongoing – and decades old – global warming trend is contributing to rising sea levels, longer droughts, and severe storms of increasing frequency and intensity. A recent report from the research and advocacy group Climate Central also shows that emerging conditions linked to shifting weather patterns are also raising the threat of mosquito-born illness in many parts of the United States.
Each year, mosquitos kill more people globally than any other animal. In the United States, West Nile virus is the most common disease carried by mosquitos. According to the Centers for Disease Control and Prevention, there were 63,155 documented cases of West Nile virus in the U.S. between 1999 and 2025, resulting in 3,315 fatalities. As the climate warms, higher temperatures are fueling longer mosquito seasons, creating the conditions for mosquitos – and the pathogens they carry – to survive and reproduce for a longer stretch of the year.
A recent report from Climate Central found that, among the 239 cities surveyed, 227 have a longer mosquito season now than they did in the early 1970s, with an average increase of 18 days. In some parts of the country, mosquito season is now longer by a month or more.
Using data from Climate Central, Climate Crisis 247 identified the U.S. cities where mosquito disease days have surged the most over the last five decades. We ranked all cities included in the study on the average annual increase in the number of days with temperatures suitable for West Nile transmission from a mosquito. Temperature changes were calculated using multi-year averages. Only the top 10 cities are listed. Data on average annual temperatures by city are from the National Oceanic and Atmospheric Administration. All other supplemental data are from Climate Central.
It is important to note that, because the change in mosquito days were calculated using multi-year averages, they do not reflect the absolute difference between the discrete years of 1970 and 2025.
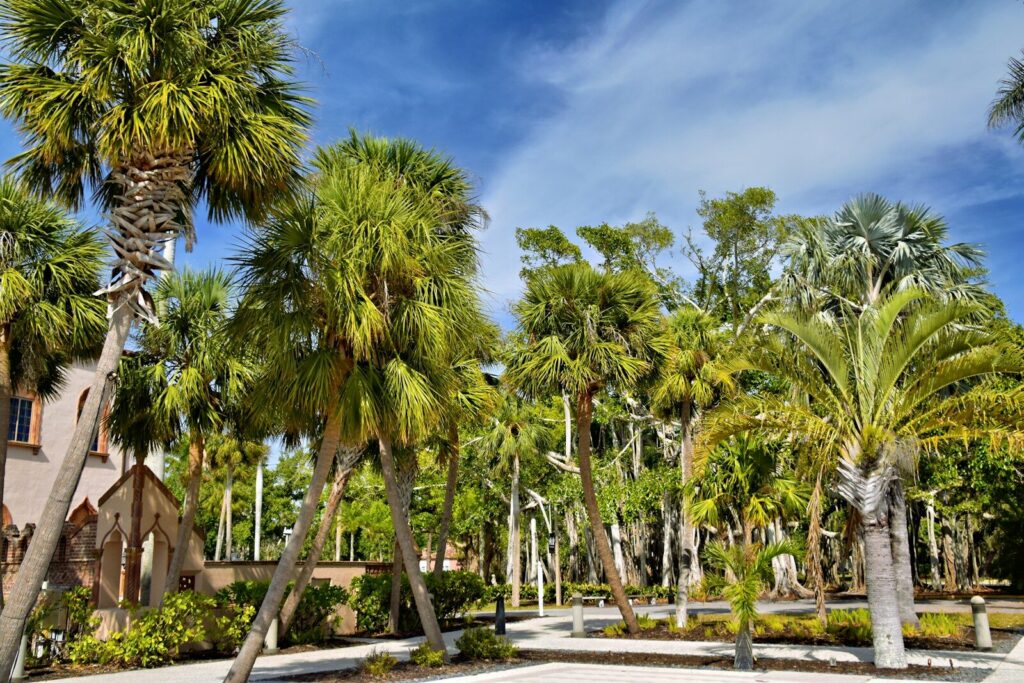
10. Sarasota, Florida
- Increase in number of mosquito days, multi-year average; 1970s-present: +31 days
- Number of mosquito days by year: 301 in 2025, 263 in 1970
- Temperature range of local mosquito species: 66.2°F – 89.2°F
- Average annual local temperature: 74.1°F (83.3°F daily high, 64.8°F daily low)
9. Hattiesburg, Mississippi
- Increase in number of mosquito days, multi-year average; 1970s-present: +31 days
- Number of mosquito days by year: 235 in 2025, 189 in 1970
- Temperature range of local mosquito species: 62.2°F – 94.8°F
- Average annual local temperature: 66.5°F (77.6°F daily high, 55.4°F daily low)
8. Chattanooga, Tennessee
- Increase in number of mosquito days, multi-year average; 1970s-present: +35 days
- Number of mosquito days by year: 182 in 2025, 154 in 1970
- Temperature range of local mosquito species: 66.2°F – 89.2°F
- Average annual local temperature: 61.9°F (72.2°F daily high, 51.5°F daily low)
7. Burlington, Vermont
- Increase in number of mosquito days, multi-year average; 1970s-present: +35 days
- Number of mosquito days by year: 124 in 2025, 90 in 1970
- Temperature range of local mosquito species: 62.2°F – 94.8°F
- Average annual local temperature: 47.6°F (56.6°F daily high, 38.6°F daily low)
6. Erie, Pennsylvania
- Increase in number of mosquito days, multi-year average; 1970s-present: +37 days
- Number of mosquito days by year: 126 in 2025, 103 in 1970
- Temperature range of local mosquito species: 62.2°F – 94.8°F
- Average annual local temperature: 50.8°F (58.8°F daily high, 42.7°F daily low)
5. Salinas, California
- Increase in number of mosquito days, multi-year average; 1970s-present: +40 days
- Number of mosquito days by year: 290 in 2025, 256 in 1970
- Temperature range of local mosquito species: 53.8°F – 89.6°F
- Average annual local temperature: 57.8°F (68.5°F daily high, 47.1°F daily low)
4. Albany, Georgia
- Increase in number of mosquito days, multi-year average; 1970s-present: +41 days
- Number of mosquito days by year: 208 in 2025, 187 in 1970
- Temperature range of local mosquito species: 66.2°F – 89.2°F
- Average annual local temperature: 67.7°F (79.0°F daily high, 56.3°F daily low)
3. Santa Maria, California
- Increase in number of mosquito days, multi-year average; 1970s-present: +49 days
- Number of mosquito days by year: 295 in 2025, 264 in 1970
- Temperature range of local mosquito species: 53.8°F – 89.6°F
- Average annual local temperature: 58.6°F (69.6°F daily high, 47.6°F daily low)
2. Reno, Nevada
- Increase in number of mosquito days, multi-year average; 1970s-present: +50 days
- Number of mosquito days by year: 199 in 2025, 143 in 1970
- Temperature range of local mosquito species: 53.8°F – 89.6°F
- Average annual local temperature: 54.4°F (66.9°F daily high, 42.0°F daily low)
1. San Francisco, California
- Increase in number of mosquito days, multi-year average; 1970s-present: +52 days
- Number of mosquito days by year: 282 in 2025, 279 in 1970
- Temperature range of local mosquito species: 53.8°F – 89.6°F
- Average annual local temperature: 58.7°F (66.9°F daily high, 50.6°F daily low)
More from ClimateCrisis 247
- Fastest Warming Congressional Districts Where Politician is Funded by Fossil Fuel Industry
- America’s Best And Worst Cities To Own An EV
- Climate Change Is Increasing Simultaneous Exposure to Heat Waves and Wildfire Smoke
- Wildlife Populations Have Plunged Globally, But Some Buck the Trend





