
From NJ to Hawaii, The US Cities Hit Hardest by Coastal Flooding In Last 10 Years
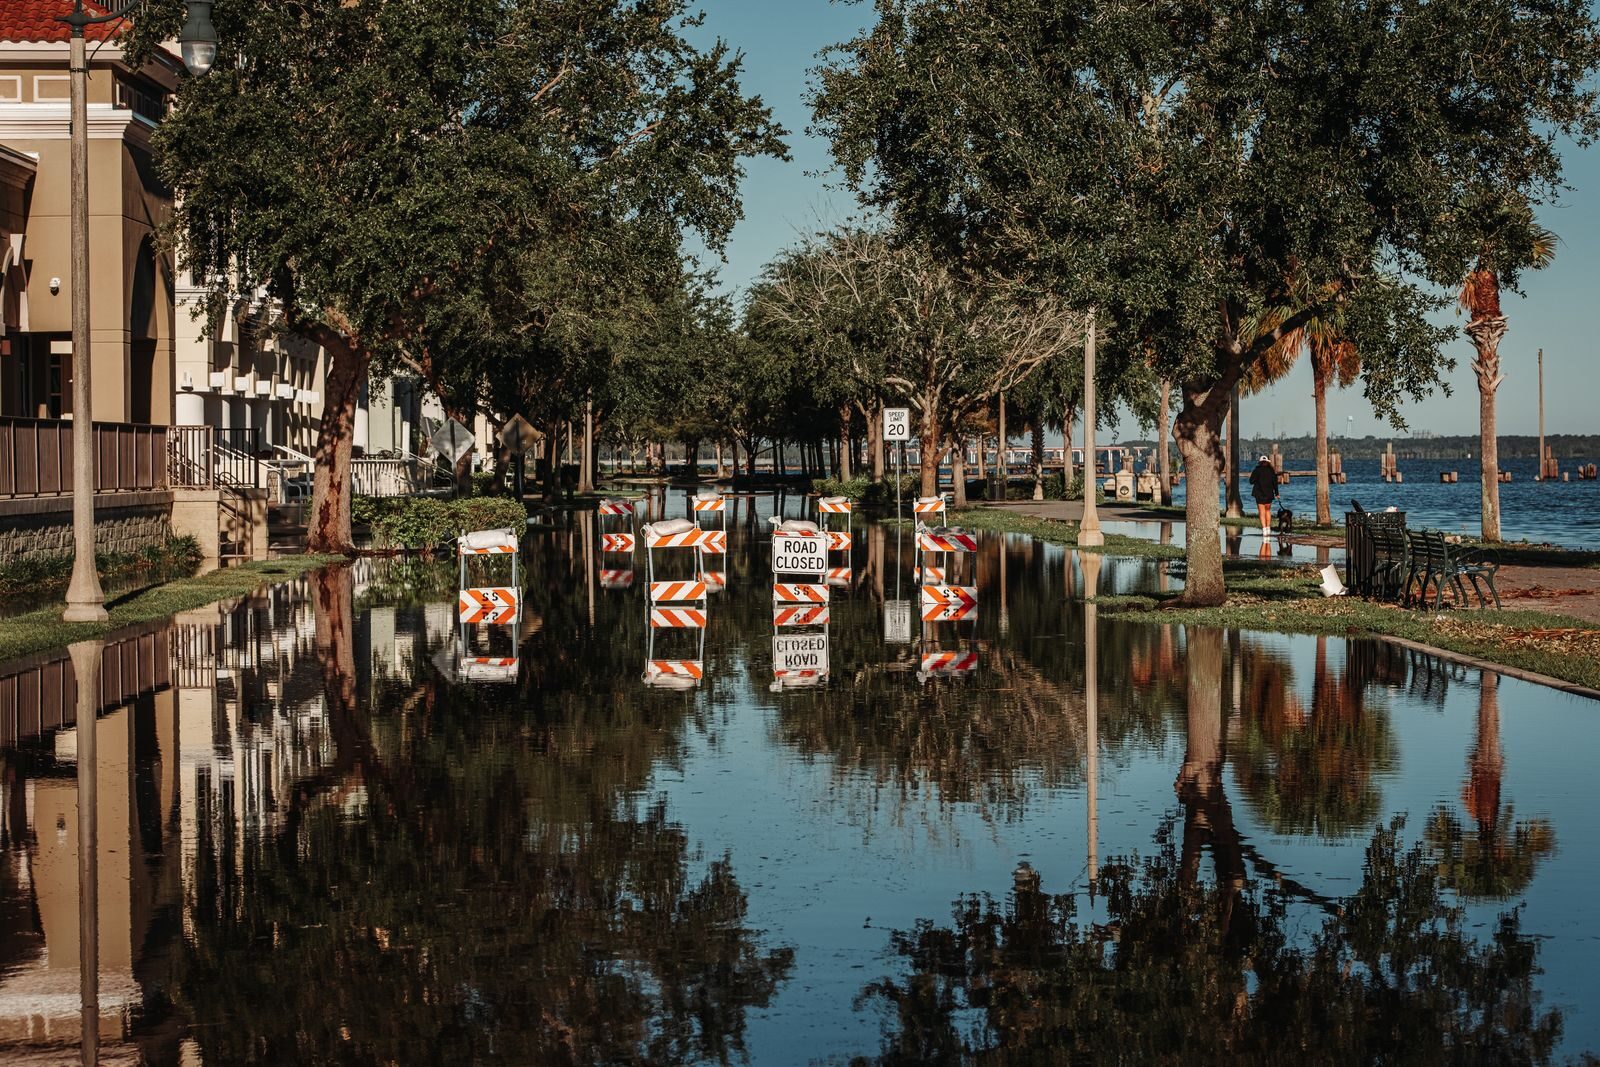
With borders along the Atlantic, Pacific, and Gulf Coasts, the United States has more than 95,000 miles of shoreline – and these areas are home to nearly one-third of the U.S. population. In the era of climate change, many densely populated coastal communities are exposed to the rapidly growing threat of sea-level rise.
A recent report from the research and advocacy group Climate Central analyzed the total number of days with coastal flooding in 71 American cities and towns along the ocean. According to the study, there were an average of about 14 coastal flooding days per year in these places between 2020 and 2025 – more than three times the observed rate between 2000 and 2009.
The report also found that sea-level rise linked to human-caused climate change is driving the increase. An average of about 80% of coastal flooding days in the studied communities were attributable to human-caused sea level rise.
Using data from Climate Central, Climate Crisis 247 identified the American cities and towns hit hardest by coastal flooding. We ranked all places included in the report on the total number of observed coastal flooding days between 2016 and 2025. Coastal communities outside of the 50 states, and places with incomplete data from the last decade, were excluded from this analysis. All supplemental data, including the estimated number of coastal flooding days in a counterfactual scenario without human-caused sea level rise are from Climate Central.
10. Springmaid Beach, SC
- Total number of days with coastal flooding, 2016-2025: 286 days (avg. of 29.0 days per year)
- Share of coastal flooding days attributable to human-caused sea level rise, 2016-2025: 75.5% (216 days total)
- Avg. annual number of coastal flooding days, 2020-2025: 32.5 observed days (9.3 estimated days, absent human-caused sea level rise)
- Avg. annual number of coastal flooding days in the 1970s (earliest decade of data): 2.1 observed days (1.0 estimated days, absent human-caused sea level rise)
9. Sandy Hook, NJ
- Total number of days with coastal flooding, 2016-2025: 340 days (avg. of 34.0 days per year)
- Share of coastal flooding days attributable to human-caused sea level rise, 2016-2025: 68.8% (234 days total)
- Avg. annual number of coastal flooding days, 2020-2025: 33.2 observed days (9.5 estimated days, absent human-caused sea level rise)
- Avg. annual number of coastal flooding days in the 1950s (earliest decade of data): 2.1 observed days (1.8 estimated days, absent human-caused sea level rise)
8. Lewes, DE
- Total number of days with coastal flooding, 2016-2025: 370 days (avg. of 37.0 days per year)
- Share of coastal flooding days attributable to human-caused sea level rise, 2016-2025: 68.1% (252 days total)
- Avg. annual number of coastal flooding days, 2020-2025: 41.2 observed days (12.0 estimated days, absent human-caused sea level rise)
- Avg. annual number of coastal flooding days in the 1950s (earliest decade of data): 3.2 observed days (1.7 estimated days, absent human-caused sea level rise)
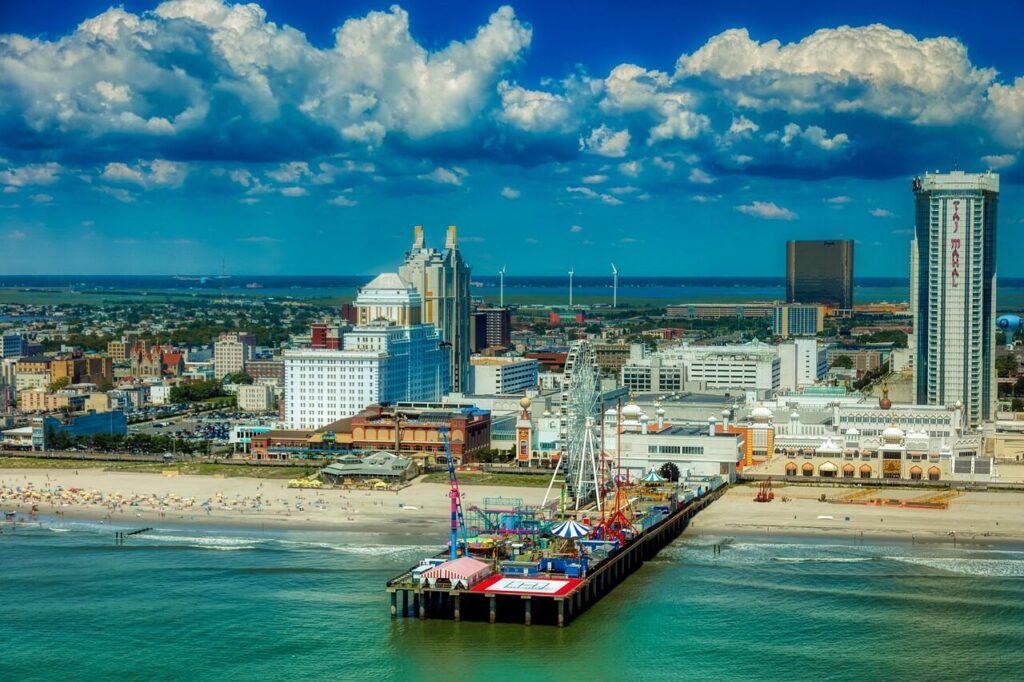
7. Atlantic City, NJ
- Total number of days with coastal flooding, 2016-2025: 378 days (avg. of 37.8 days per year)
- Share of coastal flooding days attributable to human-caused sea level rise, 2016-2025: 67.5% (255 days total)
- Avg. annual number of coastal flooding days, 2020-2025: 40.8 observed days (11.7 estimated days, absent human-caused sea level rise)
- Avg. annual number of coastal flooding days in the 1950s (earliest decade of data): 1.8 observed days (0.9 estimated days, absent human-caused sea level rise)
6. Hilo, Hilo Bay, Kuhio Bay, HI
- Total number of days with coastal flooding, 2016-2025: 389 days (avg. of 38.9 days per year)
- Share of coastal flooding days attributable to human-caused sea level rise, 2016-2025: 97.9% (381 days total)
- Avg. annual number of coastal flooding days, 2020-2025: 43.5 observed days (0.7 estimated days, absent human-caused sea level rise)
- Avg. annual number of coastal flooding days in the 1950s (earliest decade of data): 0.1 observed days (0.0 estimated days, absent human-caused sea level rise)
5. Kahului, HI
- Total number of days with coastal flooding, 2016-2025: 446 days (avg. of 44.6 days per year)
- Share of coastal flooding days attributable to human-caused sea level rise, 2016-2025: 99.6% (444 days total)
- Avg. annual number of coastal flooding days, 2020-2025: 51.0 observed days (0.3 estimated days, absent human-caused sea level rise)
- Avg. annual number of coastal flooding days in the 1950s (earliest decade of data): 0.8 observed days (0.0 estimated days, absent human-caused sea level rise)
4. Port Isabel, TX
- Total number of days with coastal flooding, 2016-2025: 463 days (avg. of 46.3 days per year)
- Share of coastal flooding days attributable to human-caused sea level rise, 2016-2025: 84.0% (389 days total)
- Avg. annual number of coastal flooding days, 2020-2025: 52.5 observed days (8.7 estimated days, absent human-caused sea level rise)
- Avg. annual number of coastal flooding days in the 1950s (earliest decade of data): 0.9 observed days (0.0 estimated days, absent human-caused sea level rise)
3. Charleston, SC
- Total number of days with coastal flooding, 2016-2025: 503 days (avg. of 50.3 days per year)
- Share of coastal flooding days attributable to human-caused sea level rise, 2016-2025: 72.0% (362 days total)
- Avg. annual number of coastal flooding days, 2020-2025: 51.8 observed days (15.0 estimated days, absent human-caused sea level rise)
- Avg. annual number of coastal flooding days in the 1950s (earliest decade of data): 2.2 observed days (0.7 estimated days, absent human-caused sea level rise)
2. Cape May, NJ
- Total number of days with coastal flooding, 2016-2025: 516 days (avg. of 51.6 days per year)
- Share of coastal flooding days attributable to human-caused sea level rise, 2016-2025: 73.4% (379 days total)
- Avg. annual number of coastal flooding days, 2020-2025: 57.5 observed days (14.3 estimated days, absent human-caused sea level rise)
- Avg. annual number of coastal flooding days in the 1960s (earliest decade of data): 7.0 observed days (3.5 estimated days, absent human-caused sea level rise)
1. Wilmington, NC
- Total number of days with coastal flooding, 2016-2025: 1,081 days (avg. of 108.1 days per year)
- Share of coastal flooding days attributable to human-caused sea level rise, 2016-2025: 75.9% (820 days total)
- Avg. annual number of coastal flooding days, 2020-2025: 114.0 observed days (26.3 estimated days, absent human-caused sea level rise)
- Avg. annual number of coastal flooding days in the 1950s (earliest decade of data): 0.9 observed days (0.4 estimated days, absent human-caused sea level rise)
More from ClimateCrisis 247
- Fastest Warming Congressional Districts Where Politician is Funded by Fossil Fuel Industry
- America’s Best And Worst Cities To Own An EV
- Climate Change Is Increasing Simultaneous Exposure to Heat Waves and Wildfire Smoke
- Wildlife Populations Have Plunged Globally, But Some Buck the Trend





