How Today’s Gas Prices Compare to Historical Highs
Since late February 2026, when Israel and the United States began air strikes against Iran, oil prices have surged. The price of oil is determined by global market forces, and for nearly two months, the Iranian- controlled Strait of Hormuz – a critical shipping route for roughly 20% of the world’s oil supply – has been effectively closed. The Strait’s closure has sent shock waves through the global economy, and in the United States, the most tangible impact has been felt at the pump.
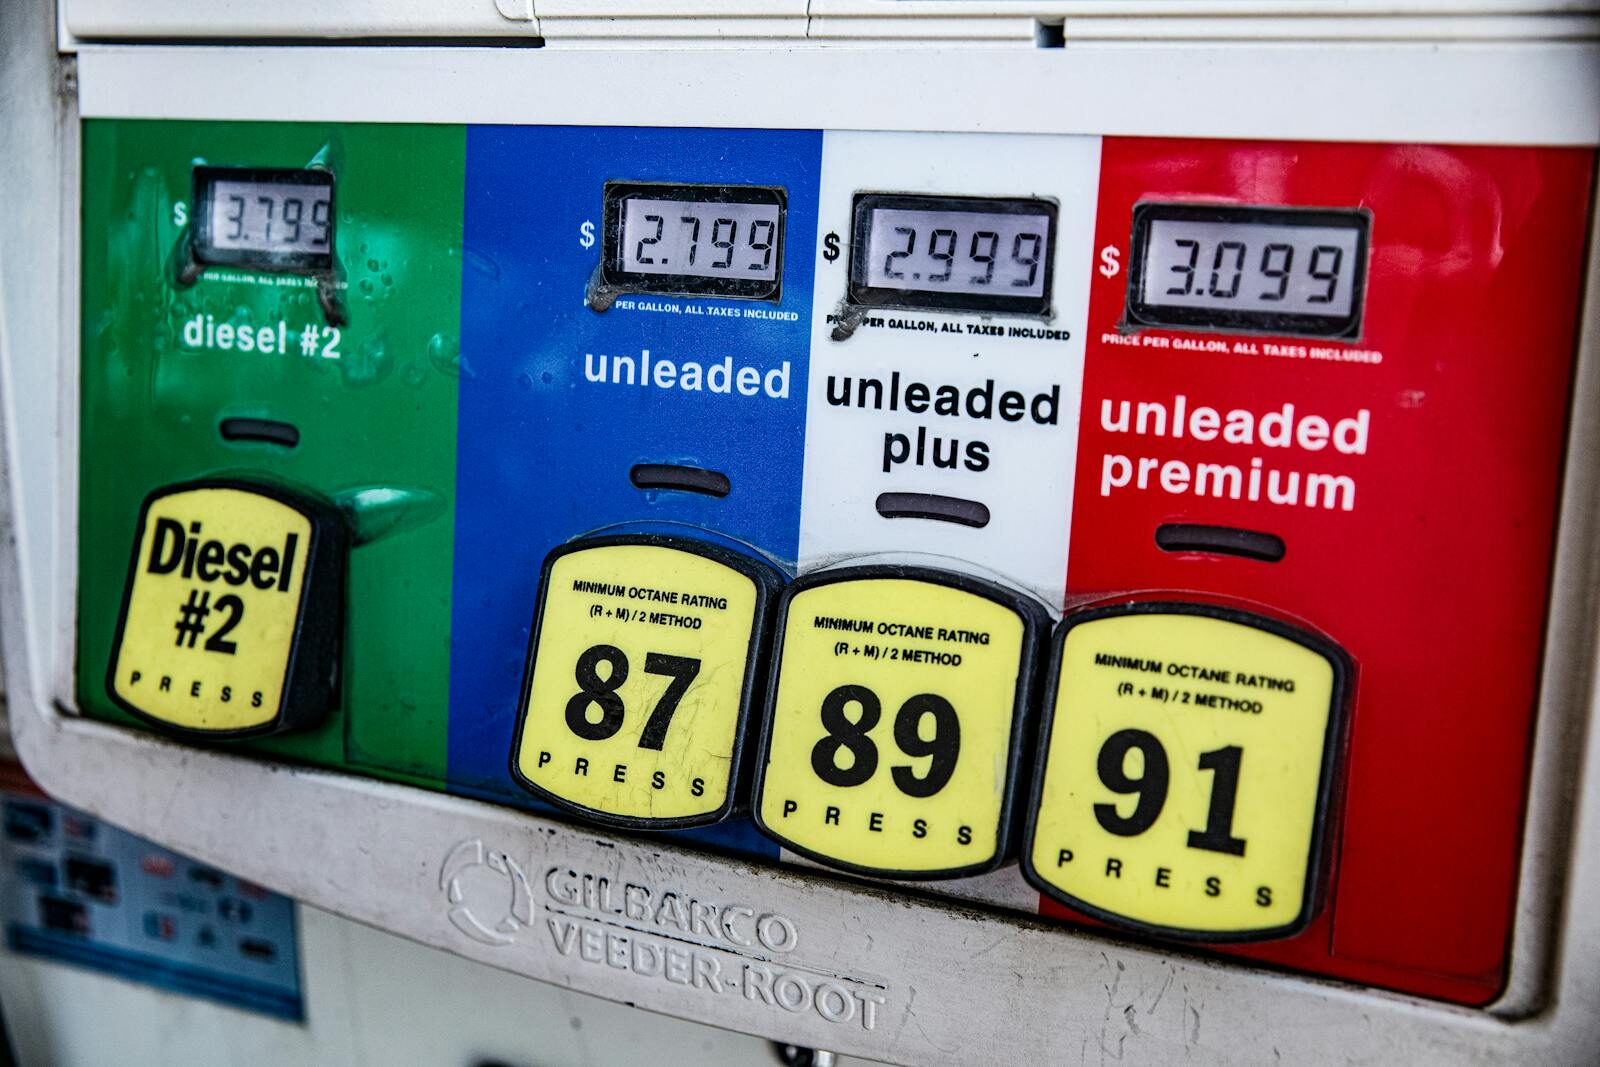
As of April 30, 2026, average price of a gallon of regular gasoline in the U.S. was $4.30, a 35% increase from one year ago, according to AAA. In certain states, including Nevada, Oregon, and Washington, the average price per gallon is now over $5.00, and in California, drivers are paying an average of $6.01 per gallon.
The rising cost of fuel is squeezing household budgets across the United States. Based on average annual roadway travel miles and average vehicle fuel economy, a typical American uses about 552 gallons of gas per year. At current prices, estimated annual gas expenditures per driver are now about $2,375 – $665 higher than in 2025.
Of course, this is not the first time that gasoline prices have been especially burdensome for American consumers. The only other time nominal gas prices topped $4.30 per gallon in the U.S. was four years ago, in 2022. But adjusting historical gas prices for inflation shows that, even at current levels, gas prices are still more favorable than they have been in other periods of recent U.S. history.
Using data from the U.S. Energy Information Administration, Climate Crisis 247 identified how today’s gas prices compare to previous historical highs. We reviewed the average price of a gallon of regular gasoline in the U.S. every year since 1992, and adjusted those prices to current U.S. dollars using the Bureau of Labor Statistics’ CPI Inflation Calculator. Only the 10 years with the highest average inflation-adjusted gasoline prices are ranked. For each year on this list, we also noted the highest average monthly price per gallon.
In each year on this list, average inflation-adjusted gas prices range from $3.84 to $5.21 per gallon. In seven of 10 years on this list, gas prices were higher in 2026 dollars than the $4.30 current national average.
10. 2005
- Avg. inflation adjusted price of a gallon of regular gas in 2005: $3.84 ($2.27 non-adjusted)
- Peak avg. inflation adjusted monthly gas price in 2005: $4.82 per gallon in September ($2.90 non-adjusted)
- U.S. President in 2005: George W. Bush
9. 2006
- Avg. inflation adjusted price of a gallon of regular gas in 2006: $4.17 ($2.57 non-adjusted)
- Peak avg. inflation adjusted monthly gas price in 2006: $4.84 per gallon in July ($2.98 non-adjusted)
- U.S. President in 2006: George W. Bush
8. 2010
- Avg. inflation adjusted price of a gallon of regular gas in 2010: $4.21 ($2.78 non-adjusted)
- Peak avg. inflation adjusted monthly gas price in 2010: $4.51 per gallon in December ($2.99 non-adjusted)
- U.S. President in 2010: Barack Obama
7. 2022
- Avg. inflation adjusted price of a gallon of regular gas in 2022: $4.40 ($3.95 non-adjusted)
- Peak avg. inflation adjusted monthly gas price in 2022: $5.49 per gallon in June ($4.93 non-adjusted)
- U.S. President in 2022: Joe Biden
6. 2007
- Avg. inflation adjusted price of a gallon of regular gas in 2007: $4.43 ($2.80 non-adjusted)
- Peak avg. inflation adjusted monthly gas price in 2007: $5.00 per gallon in May ($3.15 non-adjusted)
- U.S. President in 2007: George W. Bush
5. 2014
- Avg. inflation adjusted price of a gallon of regular gas in 2014: $4.65 ($3.36 non-adjusted)
- Peak avg. inflation adjusted monthly gas price in 2014: $5.12 per gallon in June ($3.69 non-adjusted)
- U.S. President in 2014: Barack Obama
4. 2008
- Avg. inflation adjusted price of a gallon of regular gas in 2008: $4.87 ($3.25 non-adjusted)
- Peak avg. inflation adjusted monthly gas price in 2008: $6.12 per gallon in June ($4.05 non-adjusted)
- U.S. President in 2008: George W. Bush
3. 2013
- Avg. inflation adjusted price of a gallon of regular gas in 2013: $4.95 ($3.51 non-adjusted)
- Peak avg. inflation adjusted monthly gas price in 2013: $5.26 per gallon in March ($3.71 non-adjusted)
- U.S. President in 2013: Barack Obama
2. 2011
- Avg. inflation adjusted price of a gallon of regular gas in 2011: $5.15 ($3.52 non-adjusted)
- Peak avg. inflation adjusted monthly gas price in 2011: $5.71 per gallon in May ($3.91 non-adjusted)
- U.S. President in 2011: Barack Obama
1. 2012
- Avg. inflation adjusted price of a gallon of regular gas in 2012: $5.21 ($3.62 non-adjusted)
- Peak avg. inflation adjusted monthly gas price in 2012: $5.60 per gallon in April ($3.90 non-adjusted)
- U.S. President in 2012: Barack Obama
More from ClimateCrisis 247
- Cities Expected To Have 100 Degree Heat This Week
- Celebrities With Largest Carbon Imprints
- Ford and Tesla EV Sales Collapse
- These Major US Cities Threatened By Dangerous Coastal Flooding in The Coming Years


