These Types of Weather Disasters In The US Totaled $2.9 Trillion from 1980 to 2024
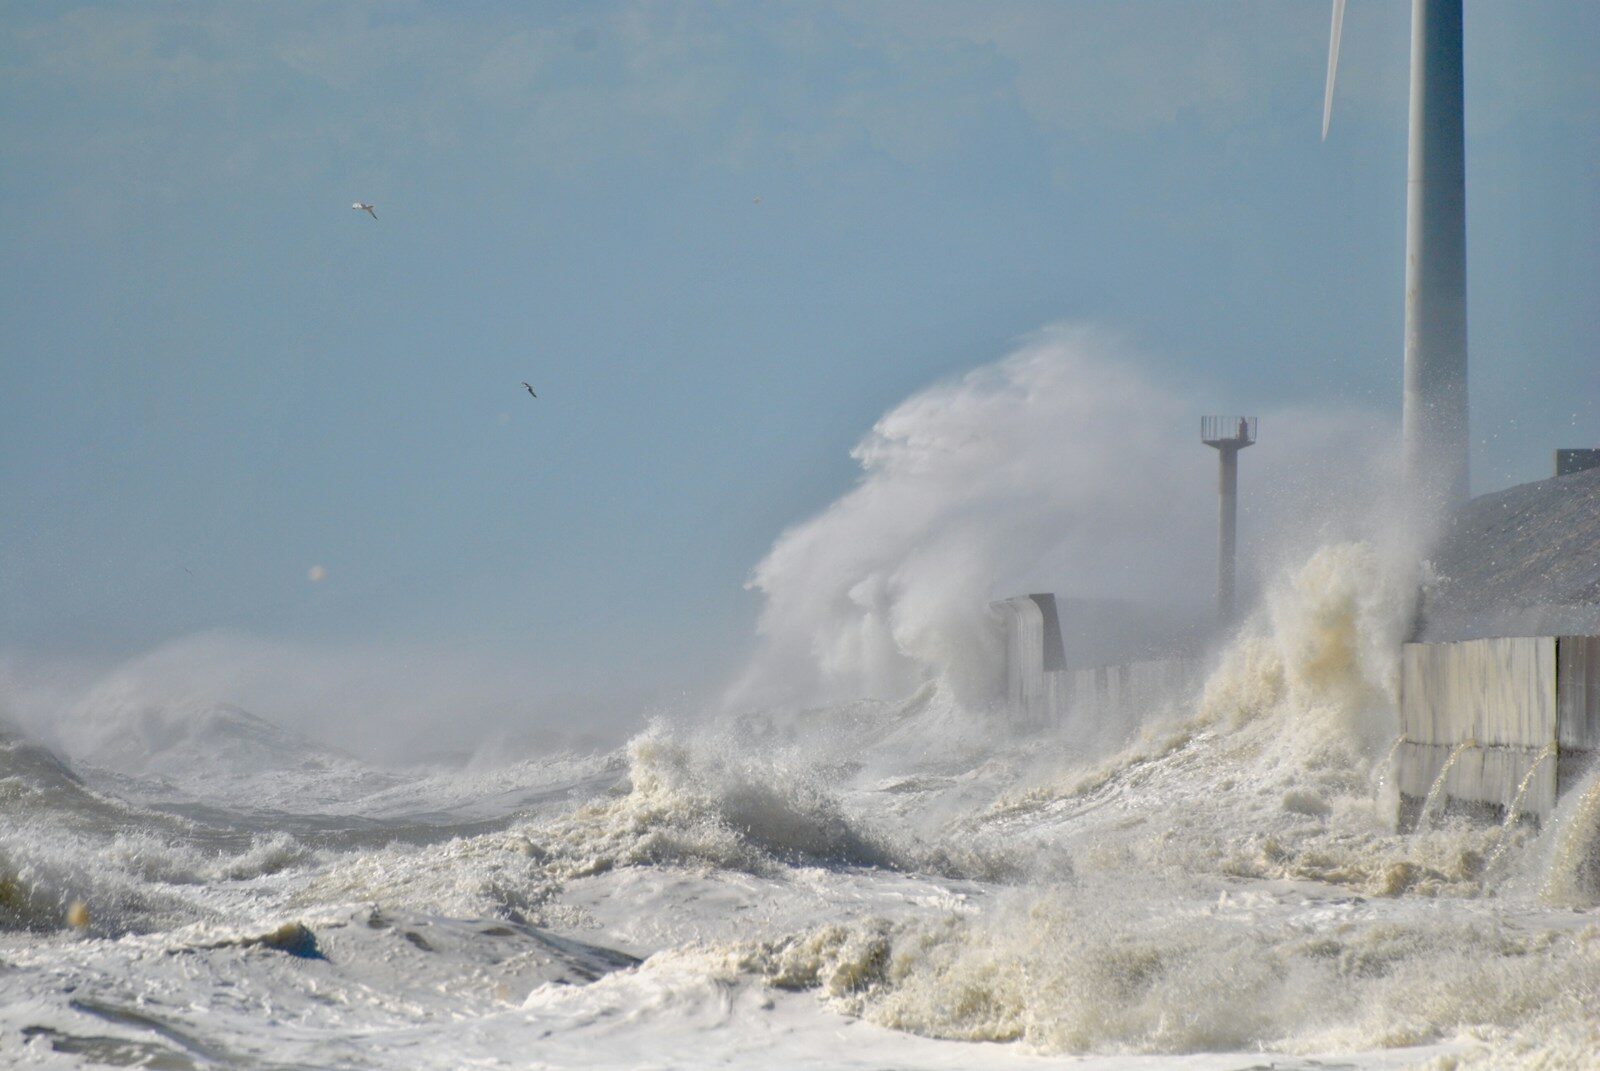
Almost all weather-related damage in the US falls into five categories: hurricanes, severe storms (usually tornadoes, thunderstorms, and hail), droughts, floods, and wildfires. According to NOAA’s report “Billion-Dollar Weather and Climate Disasters,” which tracks events that each caused $1 billion or more in damage, hurricanes accounted for about half of the total cost between 1980 and 2024. The total for all such events over that period is $2.92 trillion. Events that caused less than $1 billion in damage are not included. If they were, the total would be much larger, likely by hundreds of billions of dollars.
The report sorts each year’s events by disaster type. For example, the opening of the 2024 report reads: “In 2024, there have been 27 confirmed U.S. billion-dollar weather and climate disaster events. These events include: seventeen severe storm events (tornado outbreaks, high wind, hailstorms), five tropical cyclones, one wildfire, one drought/heat wave and two winter storm/cold wave events.” The report also names climate change as one of the risks.
One of the study’s most notable findings is how quickly the number of very expensive disasters is rising. The report provides CPI-adjusted figures and breaks events down by type. Over the last ten years, much of the growth in the number of disasters has come from severe storms. Of the billion-dollar events between 1980 and 2024, more than half were severe storms. Severe storms also ranked second in accumulated damages, at $514 billion, behind hurricanes and tropical storms at $1.54 trillion. However, hurricanes and tropical storms accounted for only 67 events over the period.

From 1980 to 2024, NOAA counted 403 US weather and climate disasters that each caused at least $1 billion in damage. Together they cost $2.92 trillion, adjusted for inflation. The totals for each type are below.
| Rank | Disaster type | Events | Total cost, 1980–2024 | Share of total | Average per event |
|---|---|---|---|---|---|
| 1 | Tropical cyclones (hurricanes and tropical storms) | 67 | $1,543.3 billion | 52.9% | $23.0 billion |
| 2 | Severe storms | 203 | $514.4 billion | 17.6% | $2.5 billion |
| 3 | Droughts | 32 | $367.6 billion | 12.6% | $11.5 billion |
| 4 | Flooding | 45 | $203.3 billion | 7.0% | $4.5 billion |
| 5 | Wildfires | 23 | $147.9 billion | 5.1% | $6.4 billion |
| 6 | Winter storms | 24 | $104.2 billion | 3.6% | $4.3 billion |
| 7 | Freezes | 9 | $37.4 billion | 1.3% | $4.2 billion |
| All disasters | 403 | $2,918.1 billion | 100% | $7.2 billion |
More from ClimateCrisis 247
- States Releasing the Most Toxic Waste
- Counties Where Forests Have Vanished
- Cities Least Likely To Get Snow This Year
- The 15 Countries That Have Seen Pollution Increase The Most