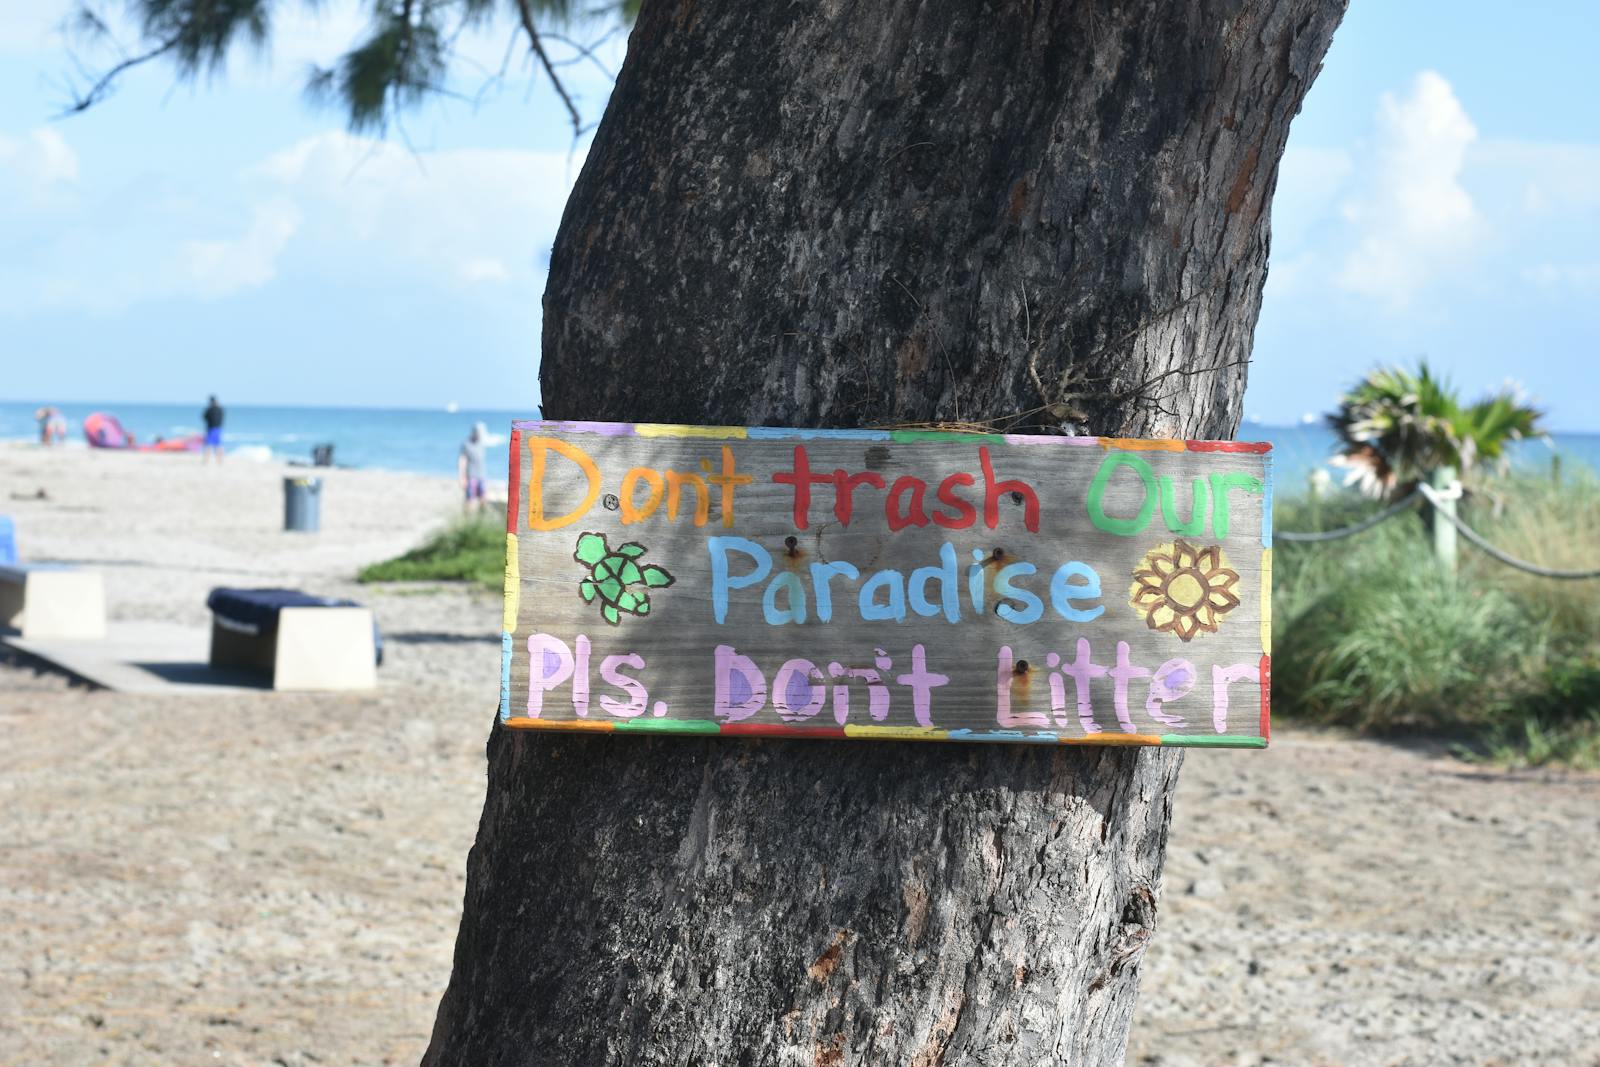
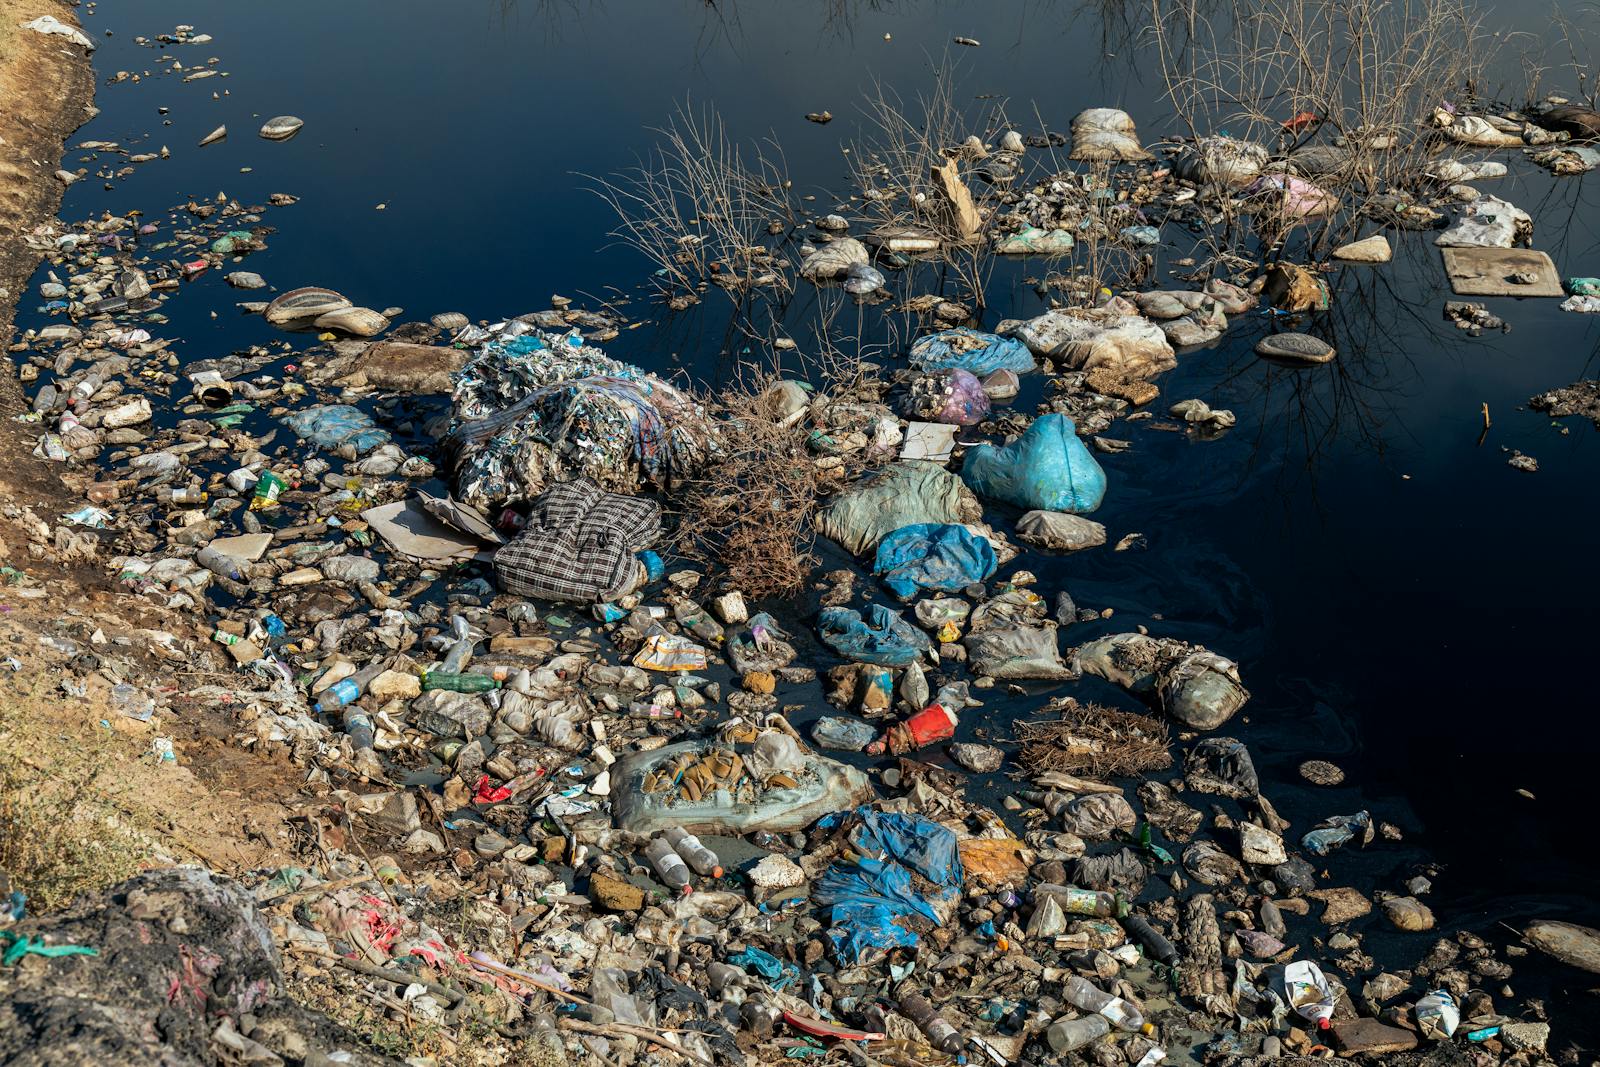
These 20 Countries Are Sending Most of Their Garbage Into the Ocean
 https://climate-crisis-247-bucket.nyc3.cdn.digitaloceanspaces.com/wp-content/uploads/2024/11/08000238/10595120-150x150.jpeg
In a recent paper, researchers found that just three countries account for more than 50% of all plastic waste that ends up in the ocean. Different countries have different pollution mitigation strategies, and the degree of plastic emissions varies considerably.
Whence the next pandemic? Cities Where the Next Pandemic Is Most Likely to Break Out
New border crisis? Climate Change Pushing Vampire Bats North Into Texas
While less than 1% of plastic waste generated in the United States ends up in the ocean, in some countries more than 10% of plastic waste reaches the world’s oceans. A closer look at the data reveals which countries are the worst offenders.
To determine the countries sending the most of their garbage into the ocean, Climate Crisis 247 reviewed data on plastic waste emissions from the April 2021 paper “More than 1000 rivers account for 80% of global riverine plastic emissions into the ocean.” Countries were ranked based on the percentage of mismanaged plastic waste – plastic waste that is improperly disposed of and at risk of entering natural environments – that enters rivers or other waterways and ultimately enters the ocean.
20. Belize
- Plastic waste that ends up in the ocean: 6.2% (374 metric tons per year)
- All mismanaged plastic waste generated: 6,021 metric tons per year
- Total population: 410,825
19. Saint Vincent and the Grenadines
- Plastic waste that ends up in the ocean: 6.6% (81 metric tons per year)
- All mismanaged plastic waste generated: 1,235 metric tons per year
- Total population: 103,698
18. Liberia
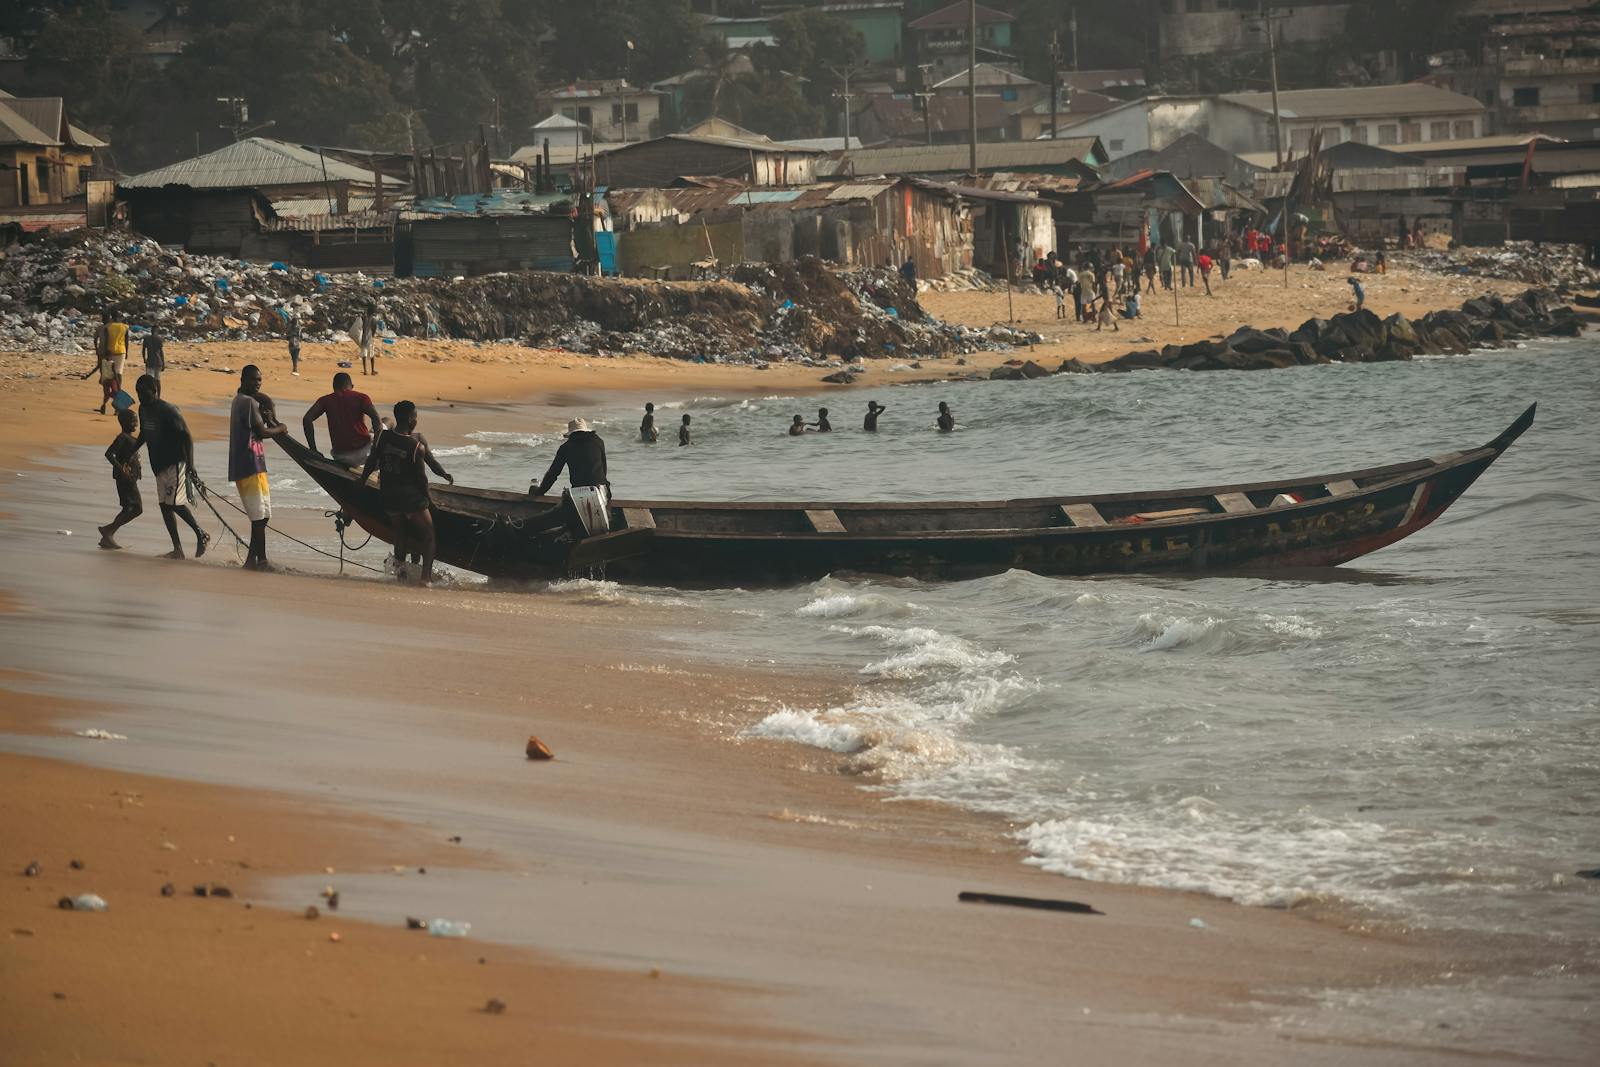
- Plastic waste that ends up in the ocean: 6.6% (2,638 metric tons per year)
- All mismanaged plastic waste generated: 39,930 metric tons per year
- Total population: 5,418,377
17. Singapore
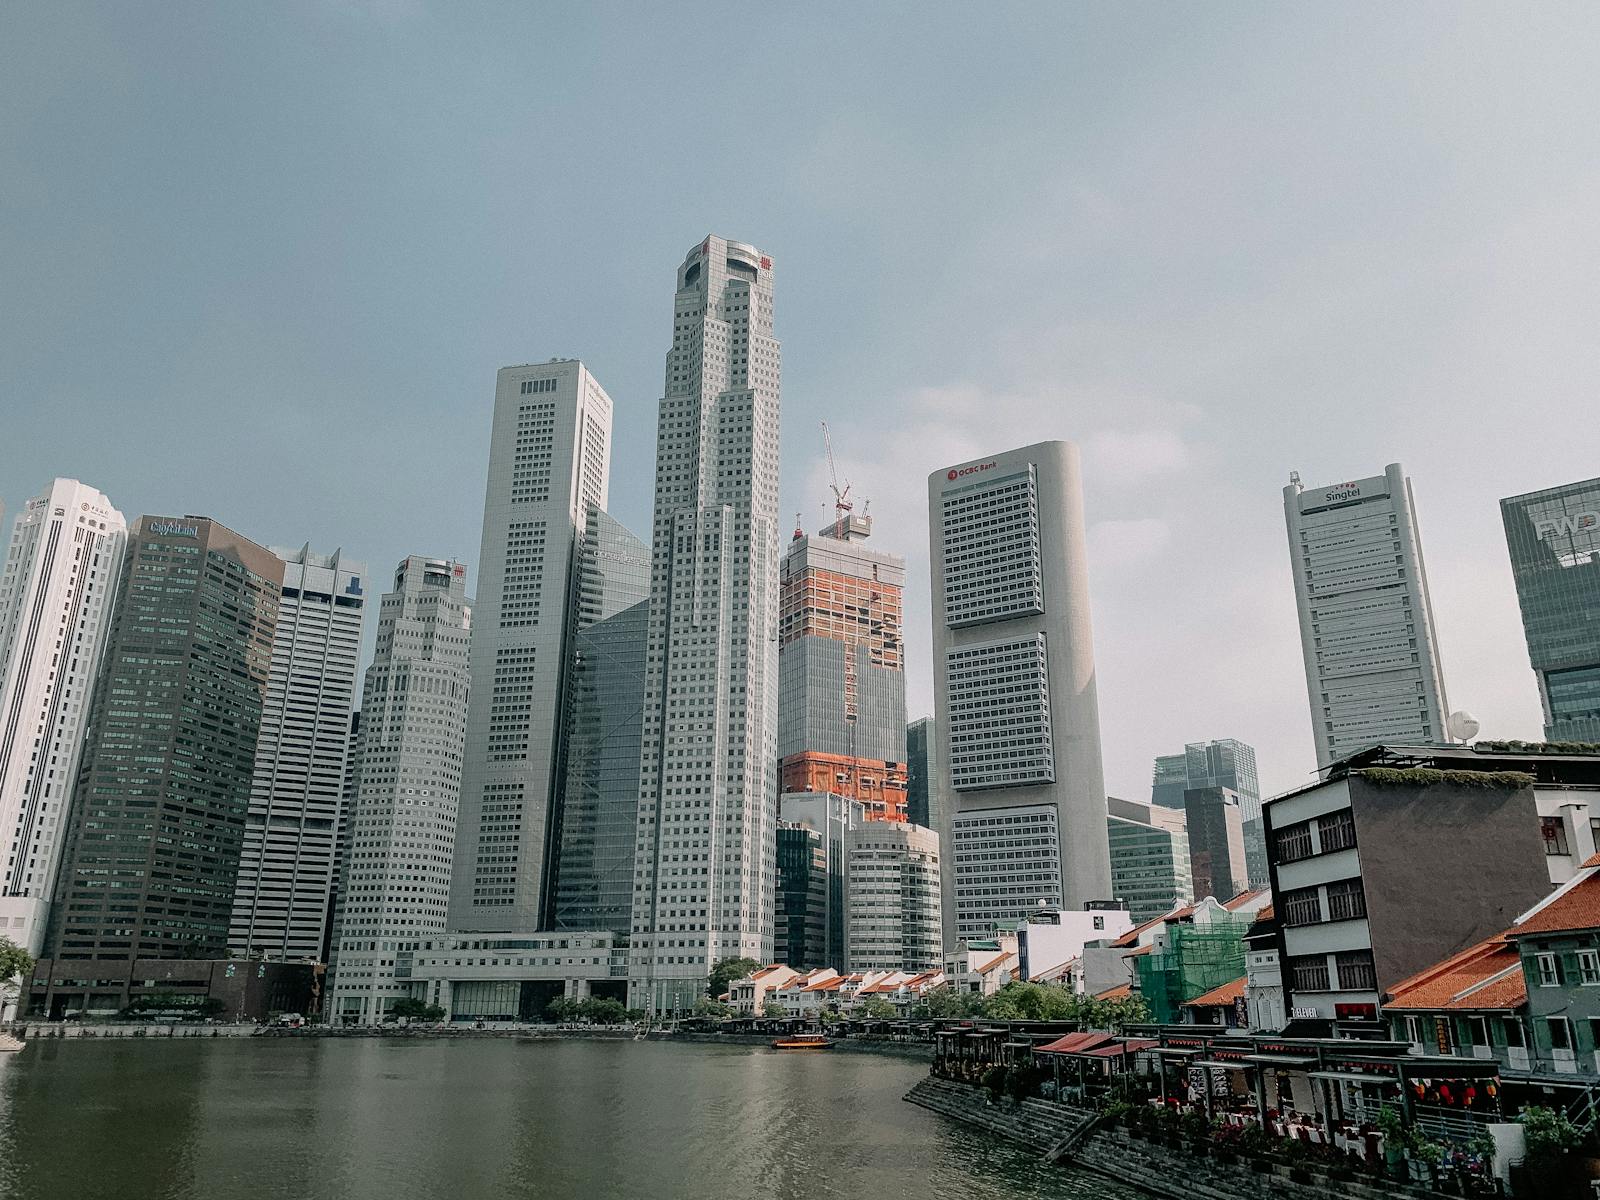
- Plastic waste that ends up in the ocean: 6.7% (164 metric tons per year)
- All mismanaged plastic waste generated: 2,468 metric tons per year
- Total population: 5,917,648
16. Indonesia
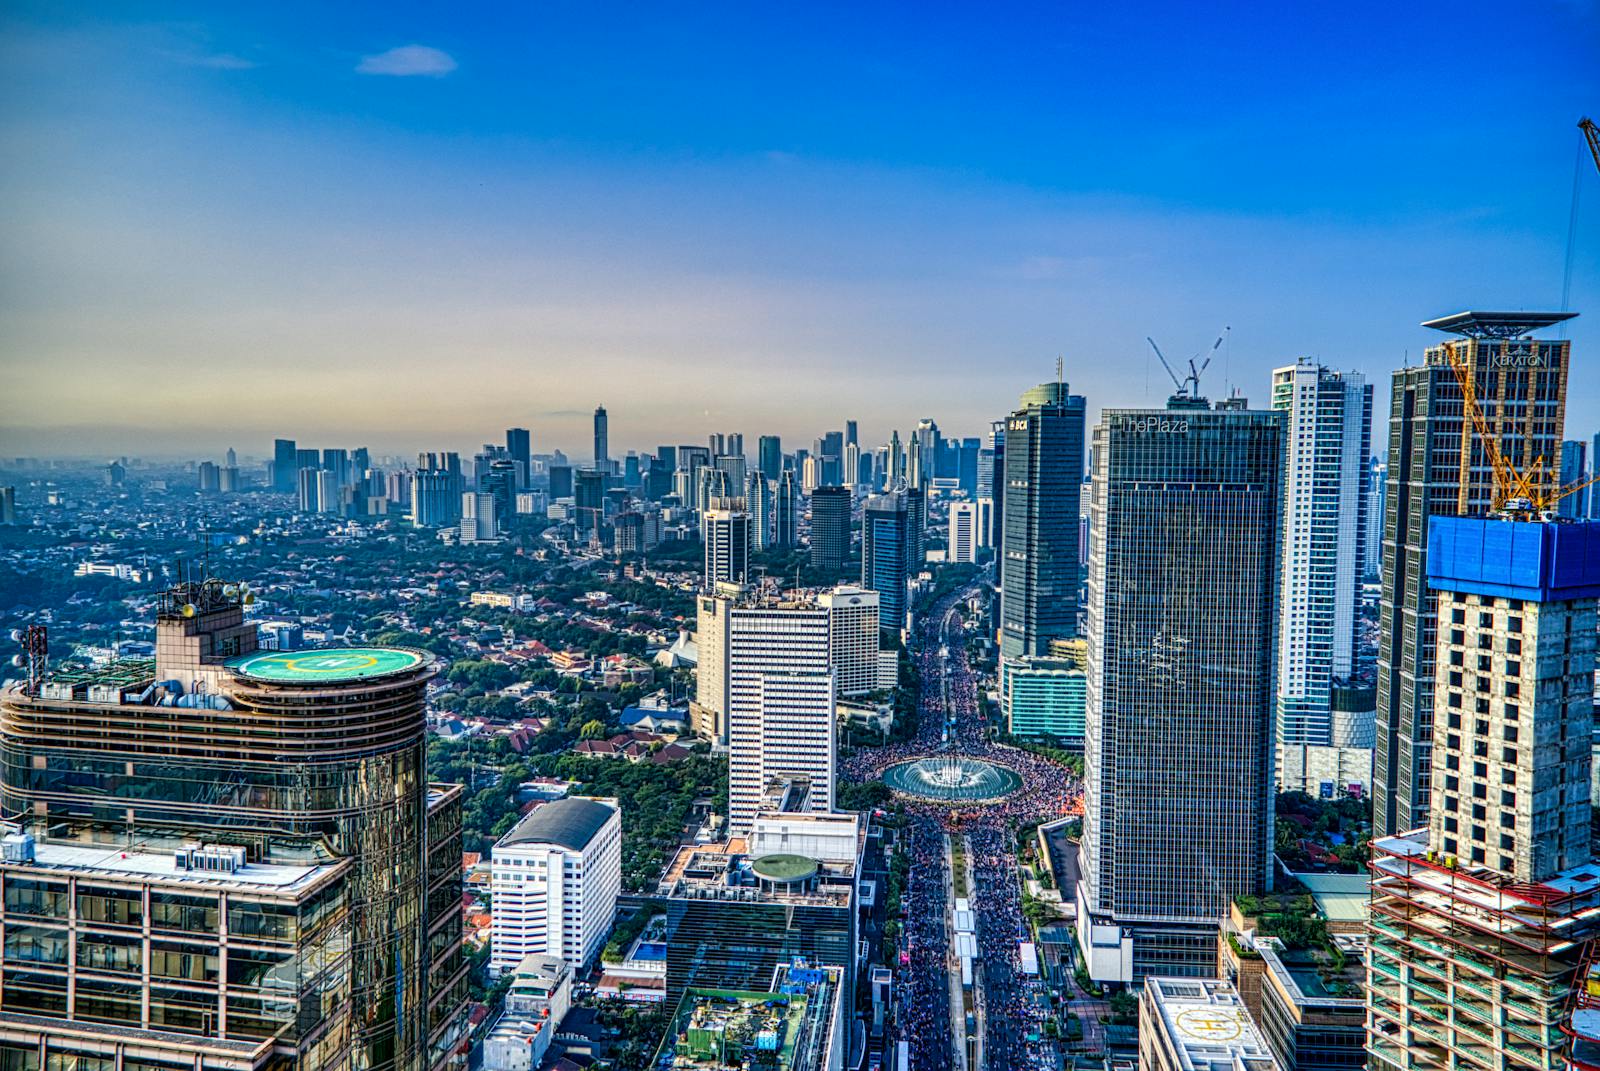
- Plastic waste that ends up in the ocean: 6.8% (56,333 metric tons per year)
- All mismanaged plastic waste generated: 824,234 metric tons per year
- Total population: 277,534,122
15. Taiwan
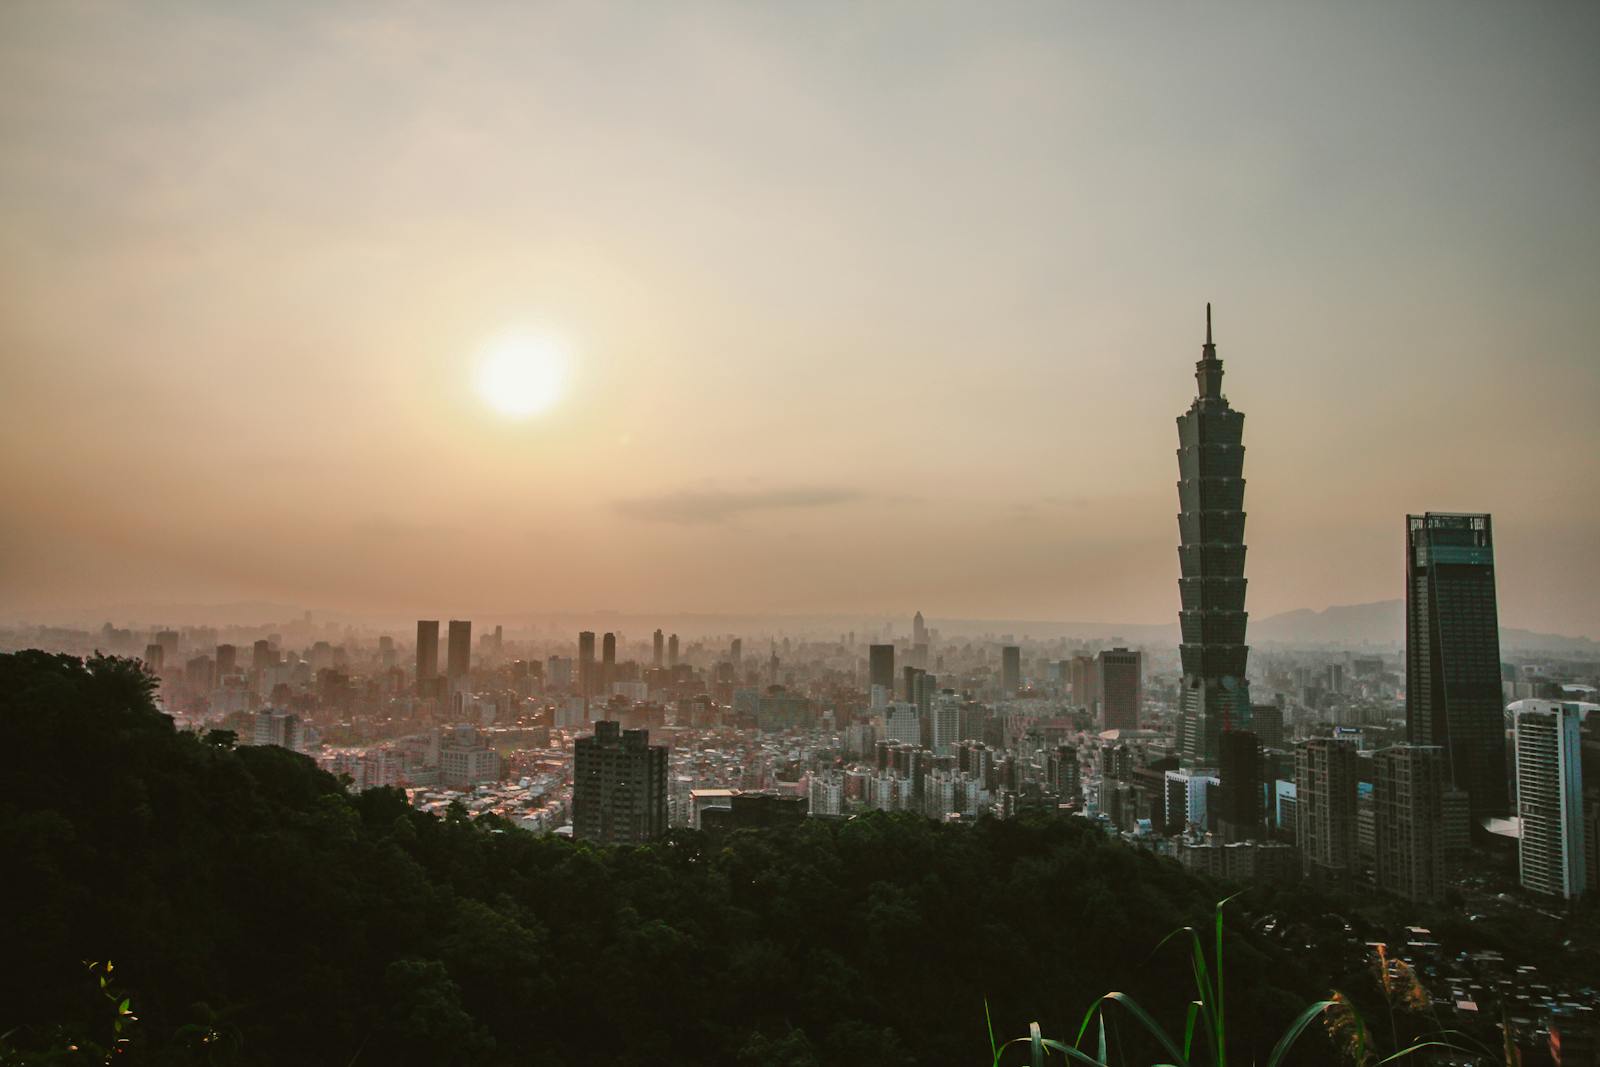
- Plastic waste that ends up in the ocean: 7.1% (531 metric tons per year)
- All mismanaged plastic waste generated: 7,502 metric tons per year
- Total population: 23,213,962
14. Suriname
- Plastic waste that ends up in the ocean: 7.3% (1,677 metric tons per year)
- All mismanaged plastic waste generated: 22,933 metric tons per year
- Total population: 623,236
13. Gabon

- Plastic waste that ends up in the ocean: 7.4% (445 metric tons per year)
- All mismanaged plastic waste generated: 5,991 metric tons per year
- Total population: 2,436,566
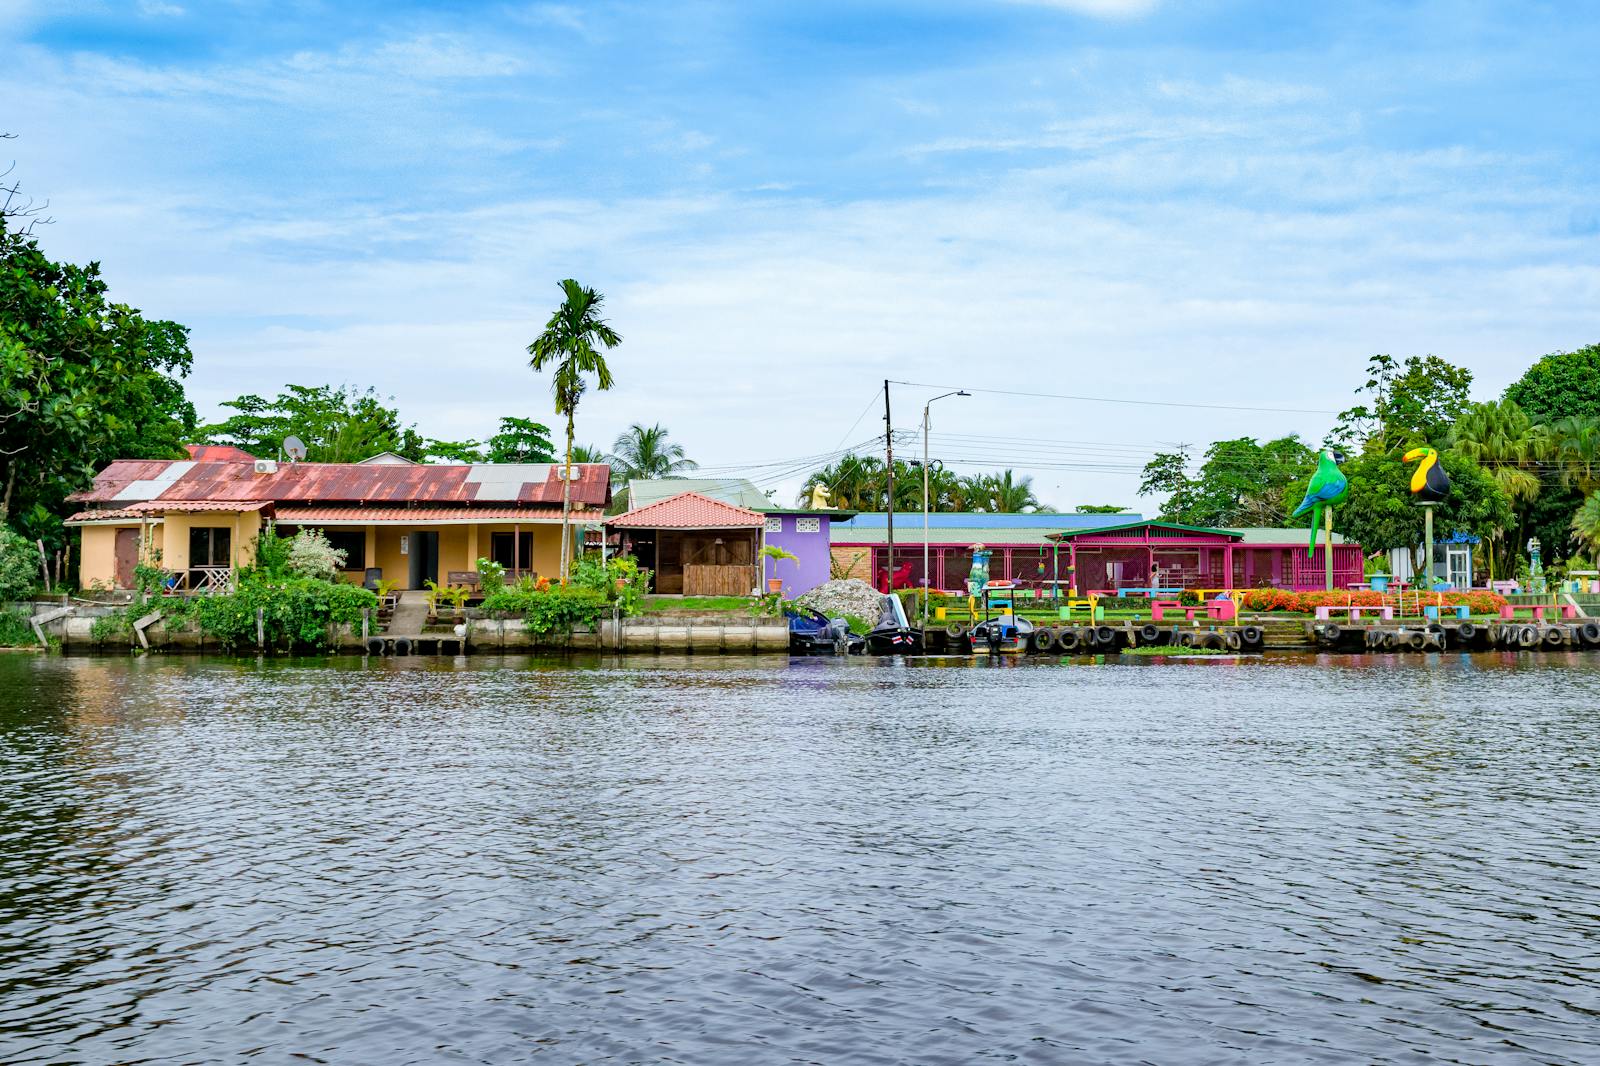
12. Costa Rica
- Plastic waste that ends up in the ocean: 7.8% (450 metric tons per year)
- All mismanaged plastic waste generated: 5,751 metric tons per year
- Total population: 5,212,173
11. Micronesia
- Plastic waste that ends up in the ocean: 8.3% (37 metric tons per year)
- All mismanaged plastic waste generated: 447 metric tons per year
- Total population: 115,224
10. Syria
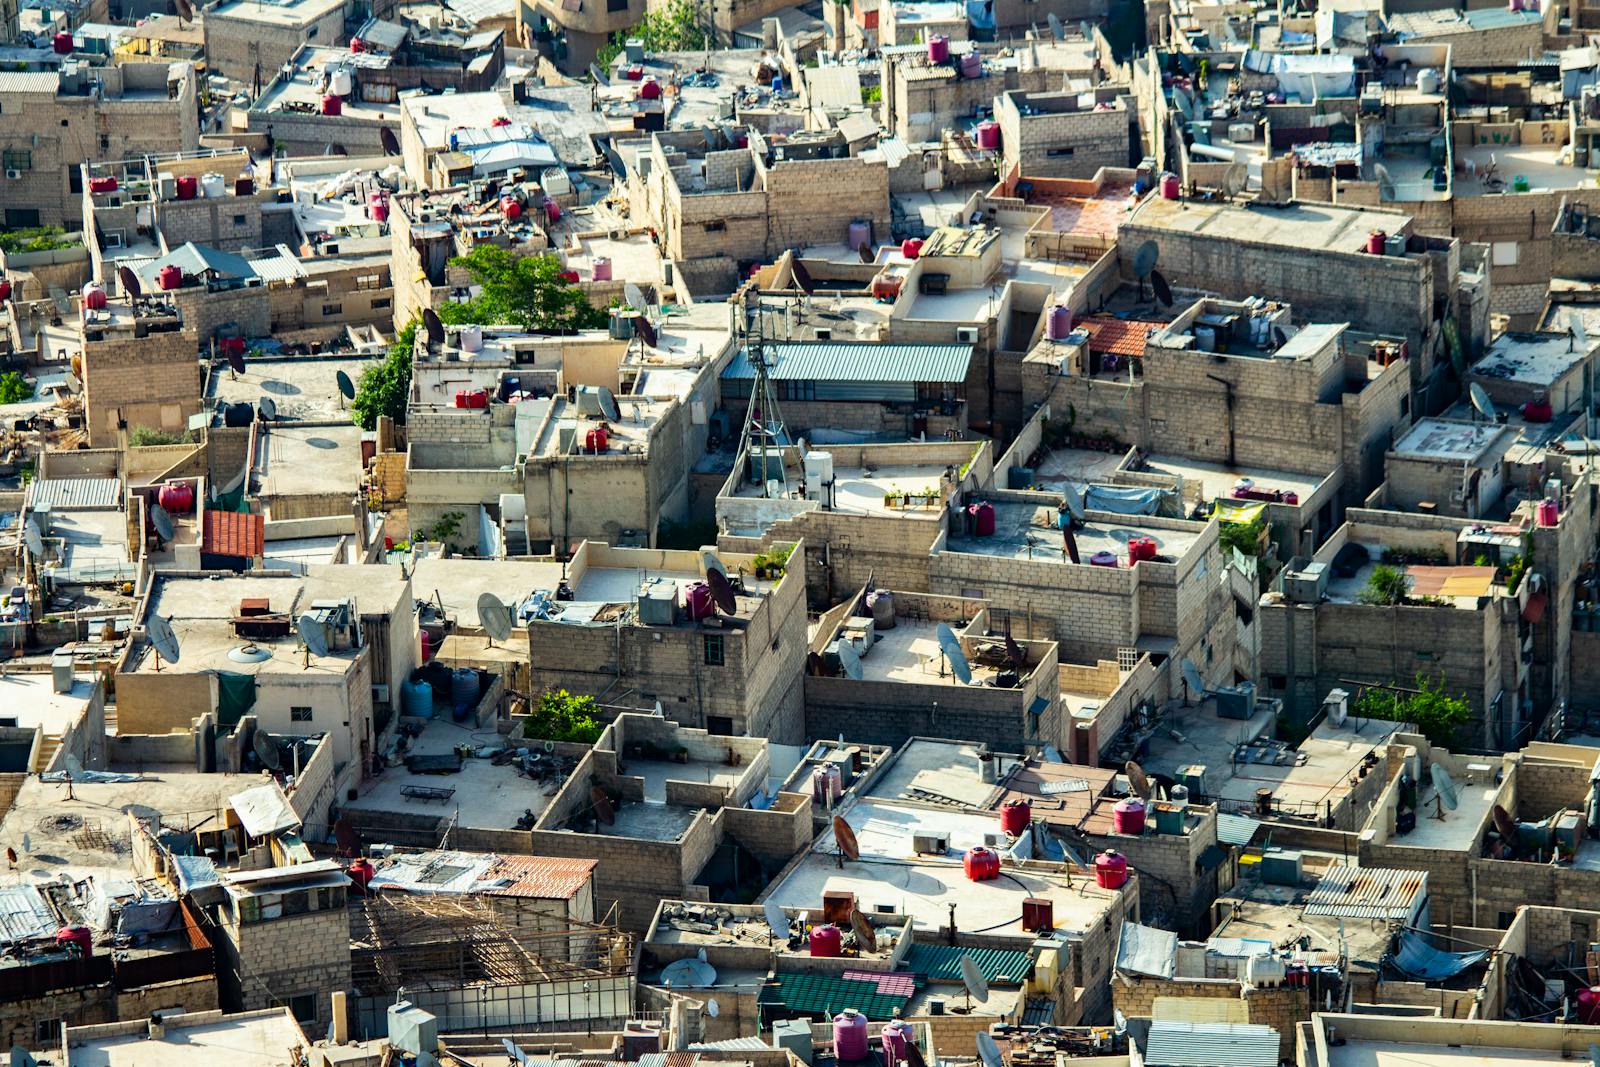
- Plastic waste that ends up in the ocean: 8.8% (44 metric tons per year)
- All mismanaged plastic waste generated: 502 metric tons per year
- Total population: 23,227,014
9. Philippines
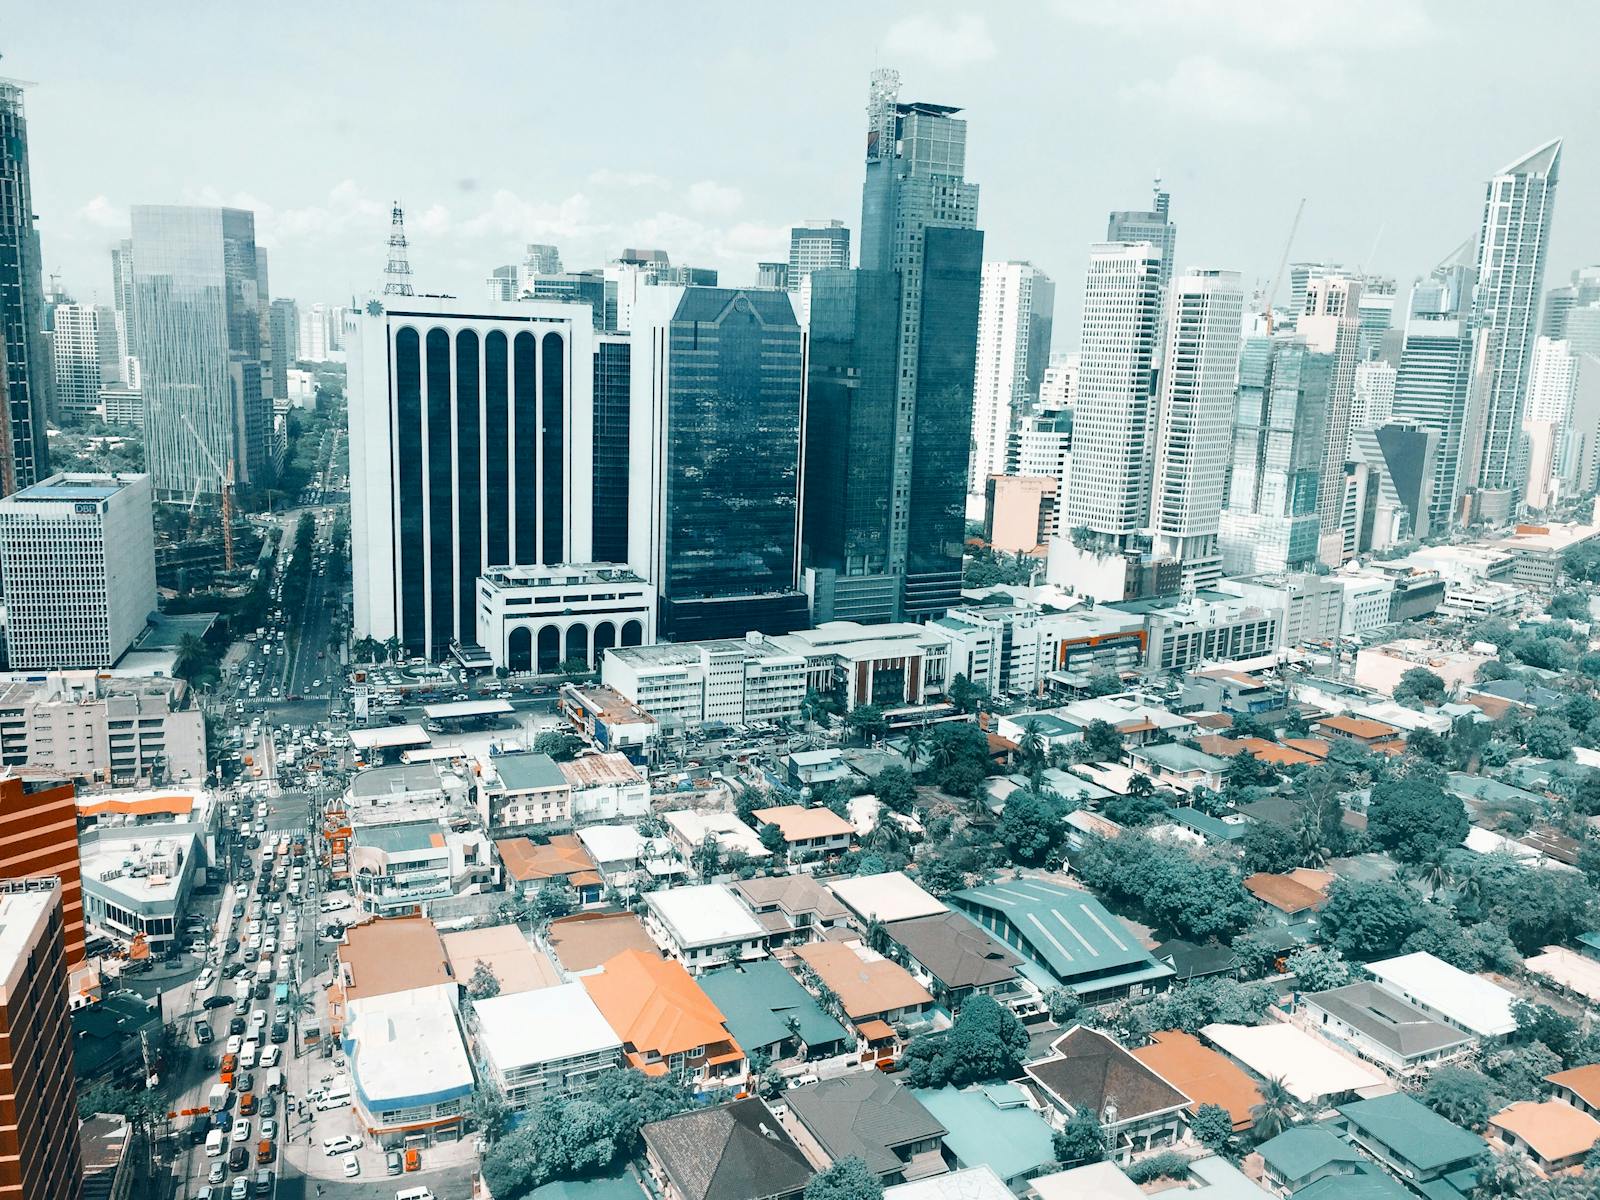
- Plastic waste that ends up in the ocean: 8.9% (356,371 metric tons per year)
- All mismanaged plastic waste generated: 4,025,300 metric tons per year
- Total population: 117,337,368
8. Malaysia
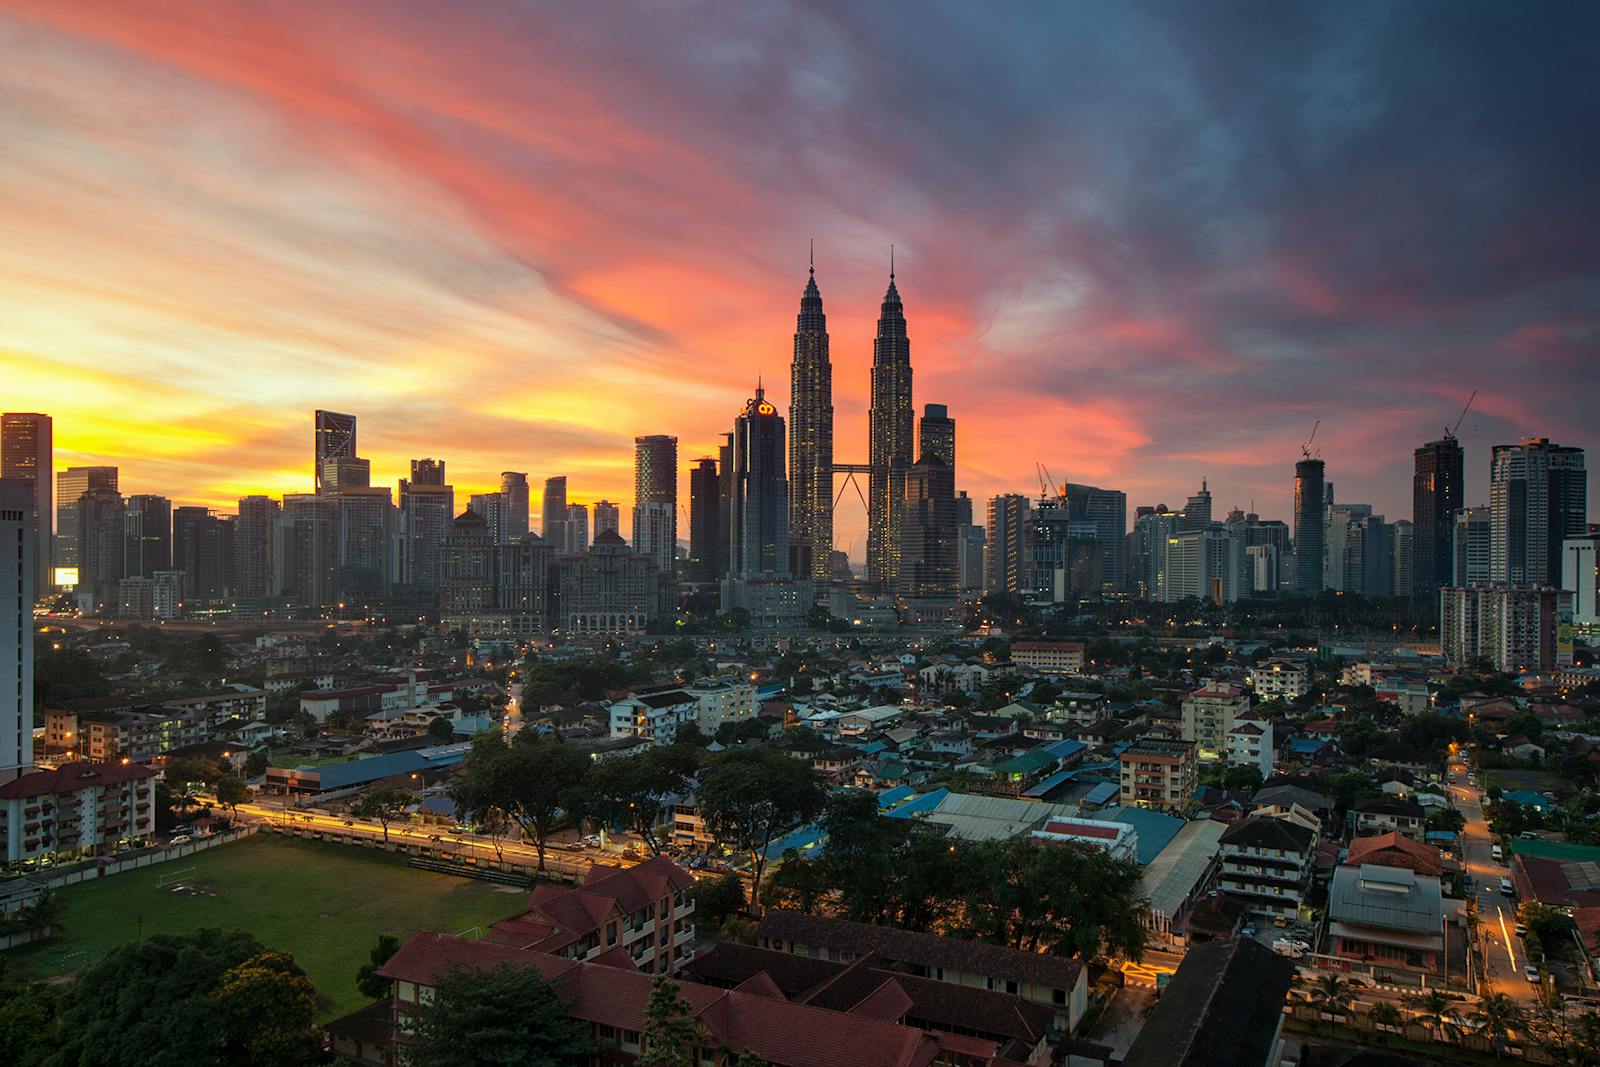
- Plastic waste that ends up in the ocean: 9.0% (73,098 metric tons per year)
- All mismanaged plastic waste generated: 814,454 metric tons per year
- Total population: 34,308,525
7. Fiji
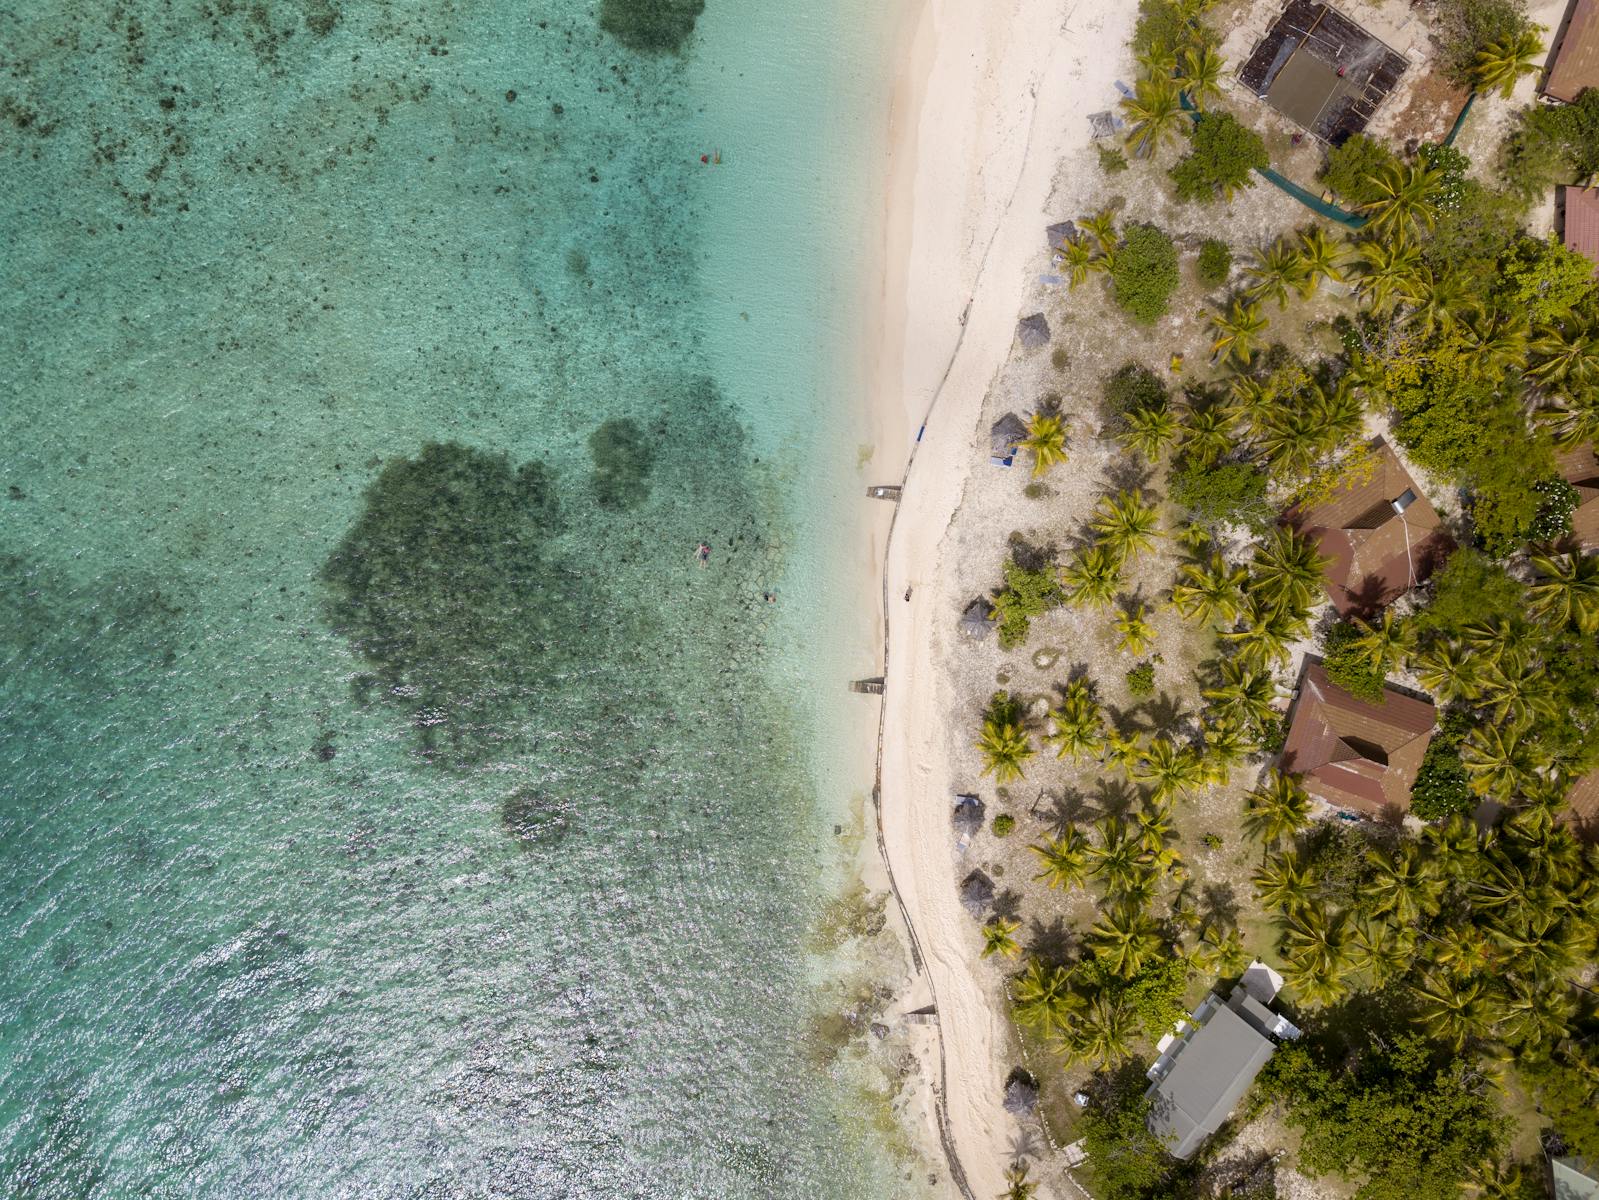
- Plastic waste that ends up in the ocean: 9.5% (365 metric tons per year)
- All mismanaged plastic waste generated: 3,858 metric tons per year
- Total population: 936,375
6. Grenada
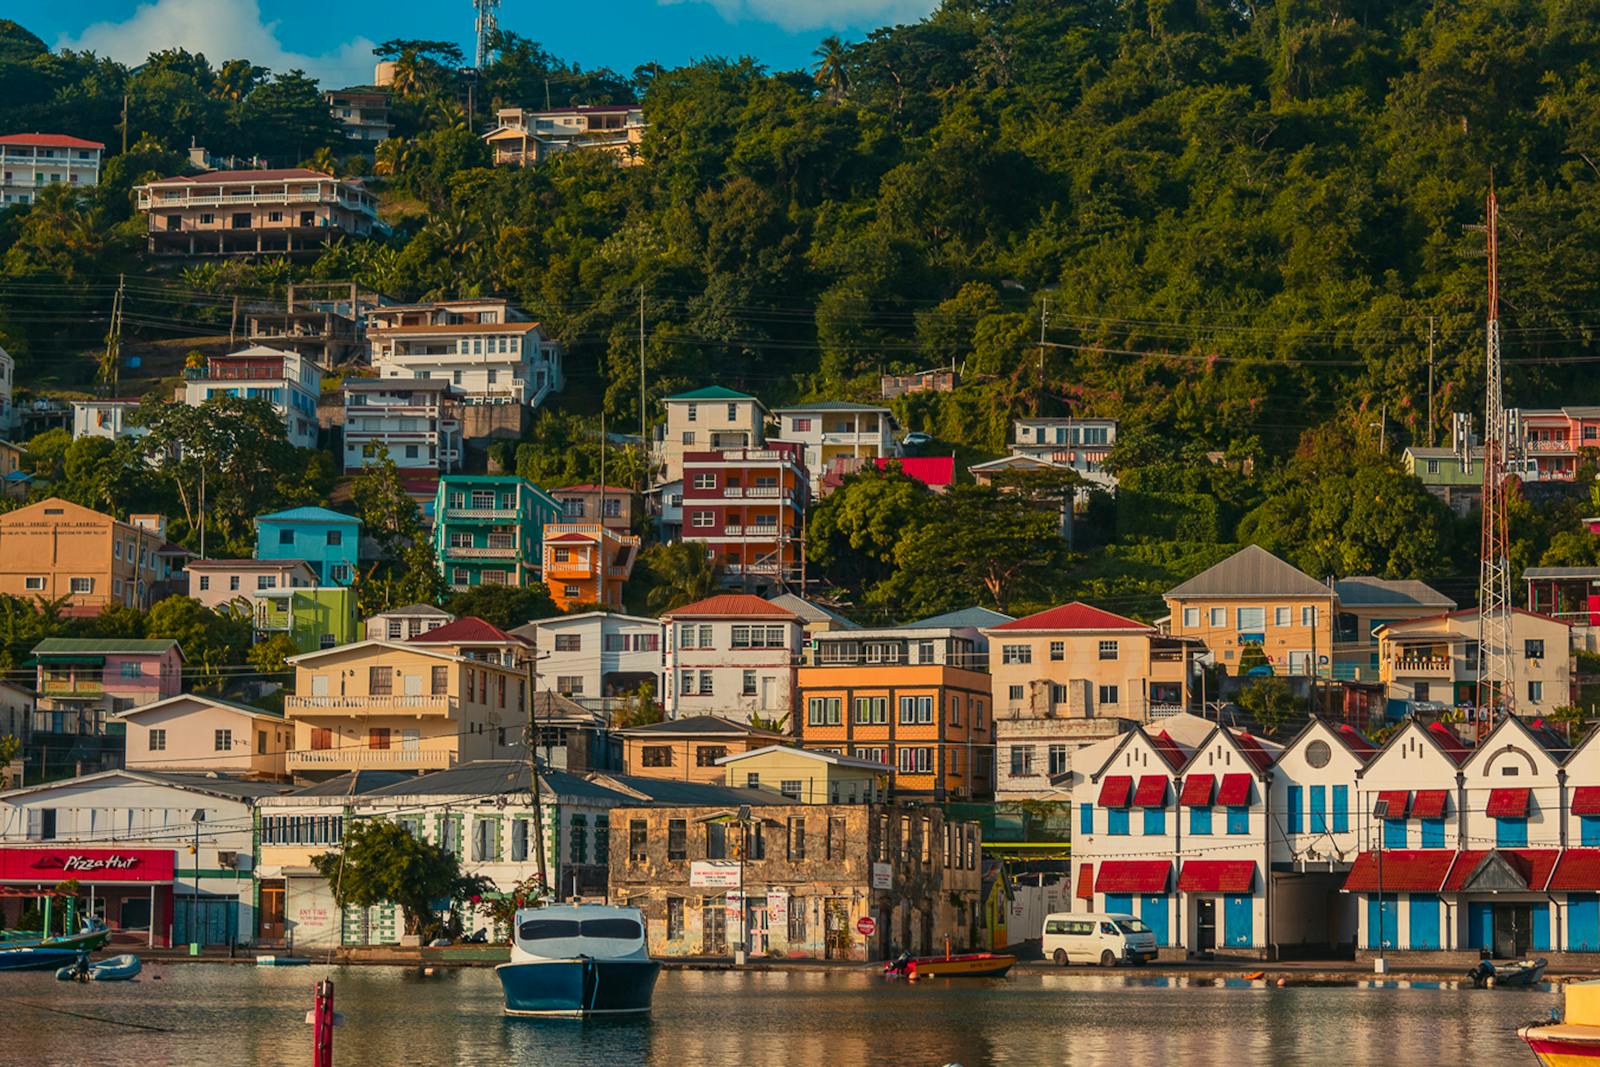
- Plastic waste that ends up in the ocean: 9.6% (130 metric tons per year)
- All mismanaged plastic waste generated: 1,357 metric tons per year
- Total population: 126,183
5. Saint Lucia
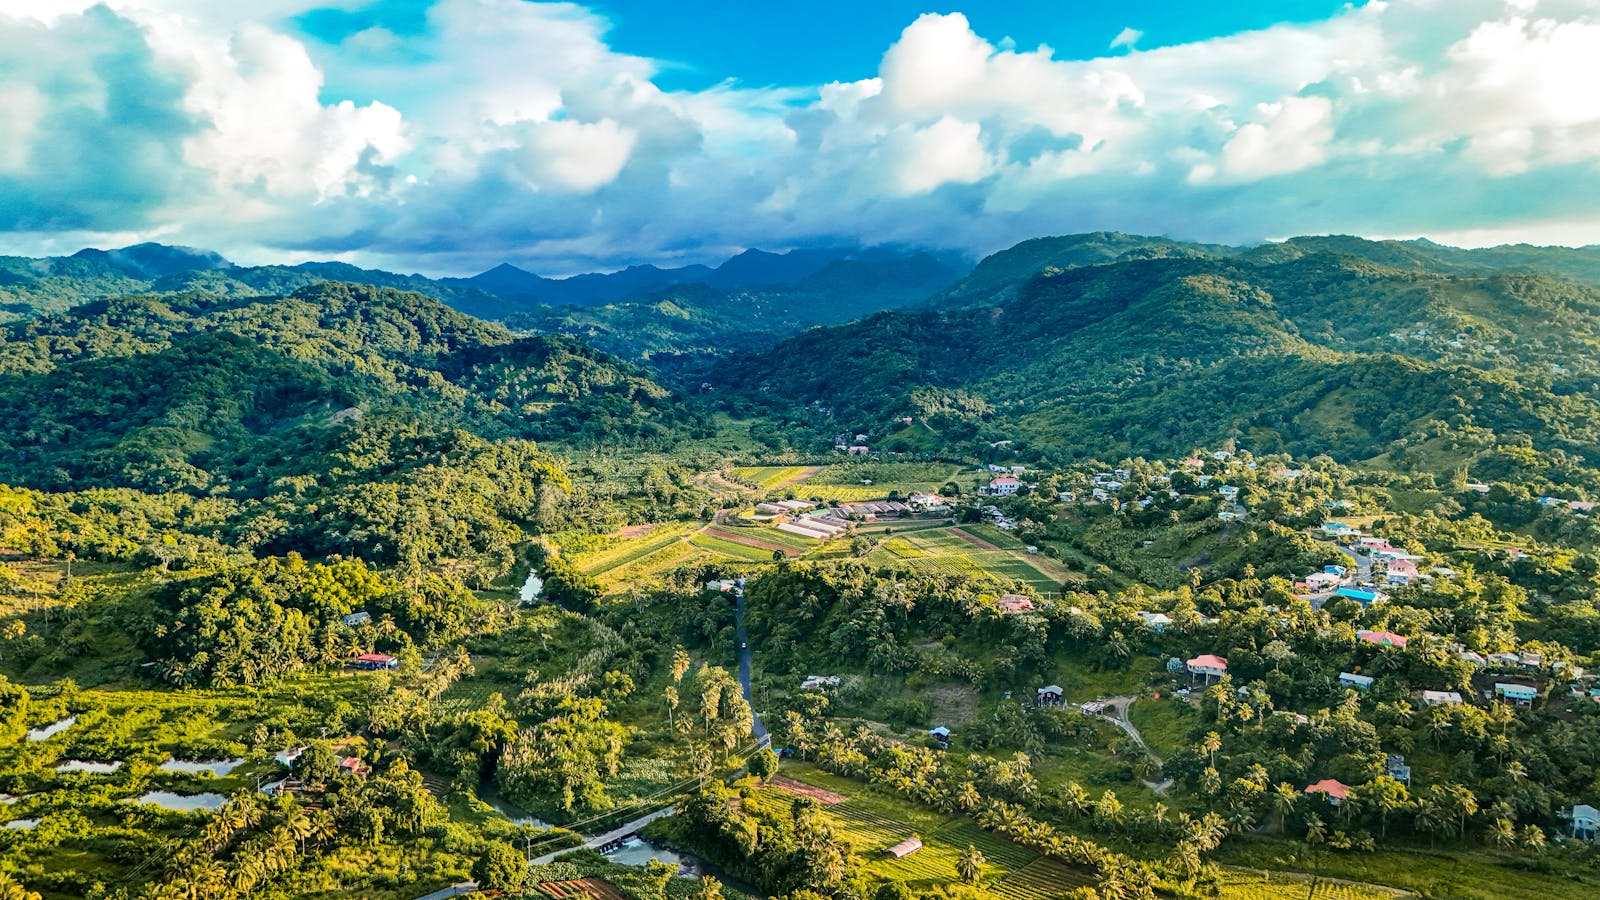
- Plastic waste that ends up in the ocean: 10.5% (449 metric tons per year)
- All mismanaged plastic waste generated: 4,276 metric tons per year
- Total population: 180,251
4. Panama
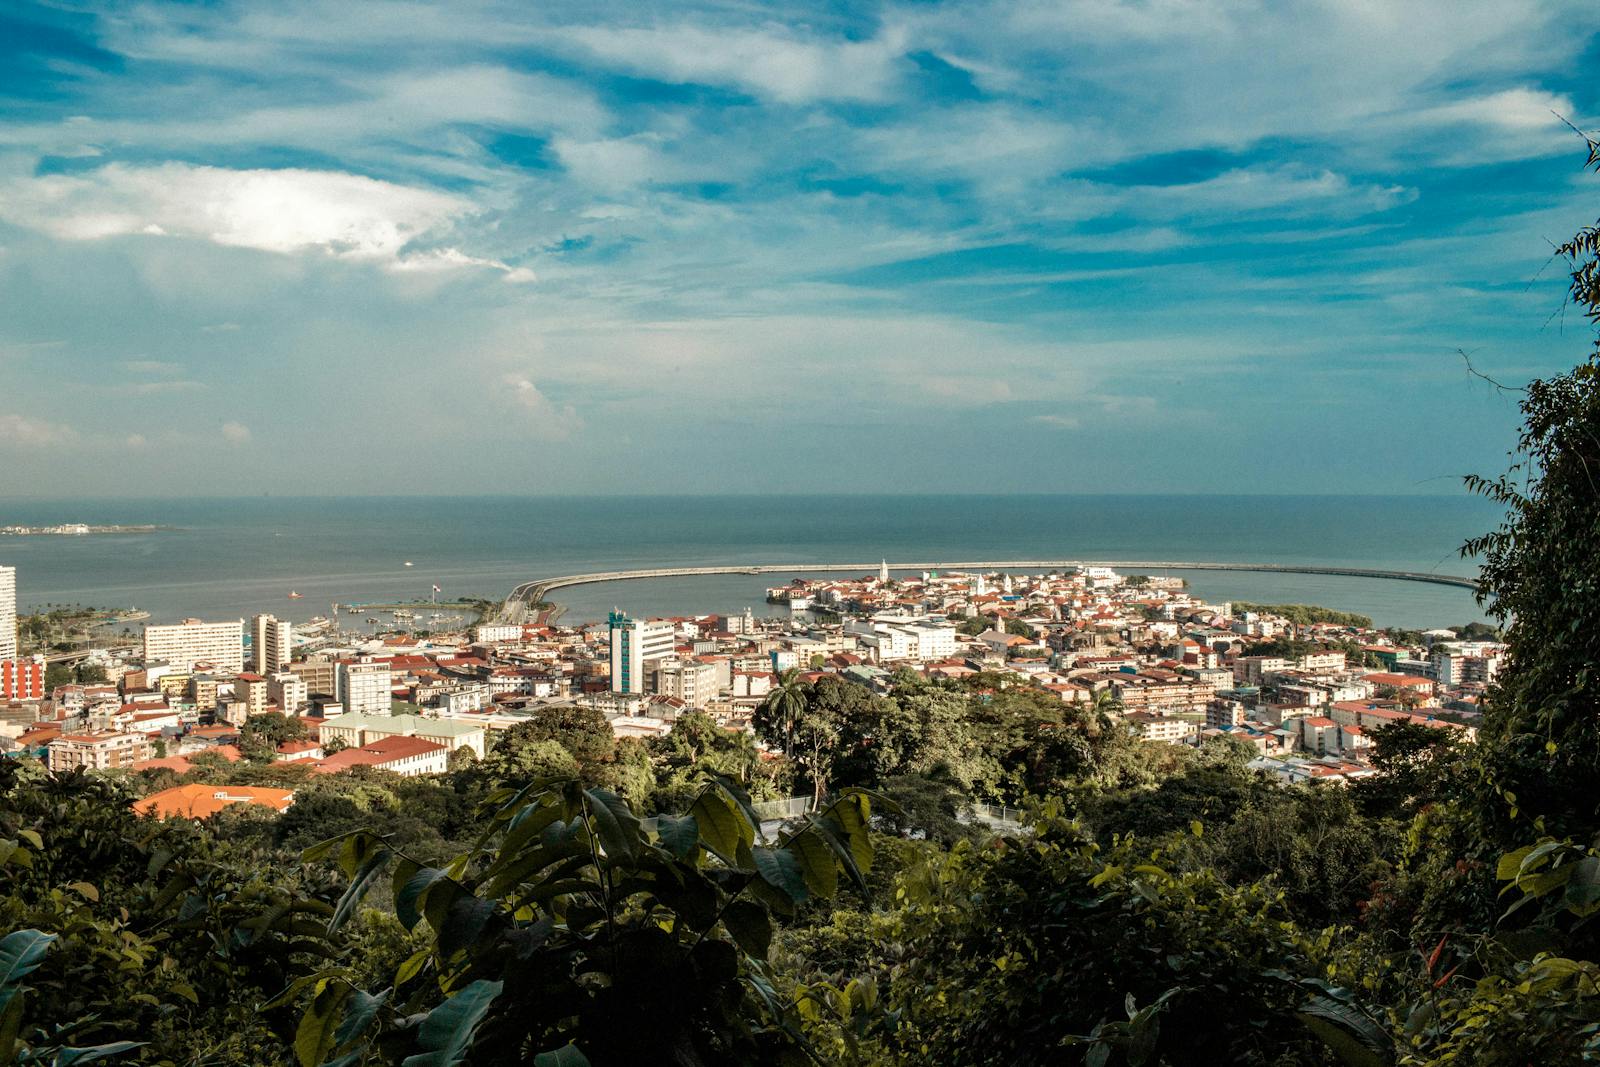
- Plastic waste that ends up in the ocean: 14.4% (5,237 metric tons per year)
- All mismanaged plastic waste generated: 36,339 metric tons per year
- Total population: 4,468,087
3. North Korea

- Plastic waste that ends up in the ocean: 15.5% (50 metric tons per year)
- All mismanaged plastic waste generated: 322 metric tons per year
- Total population: 26,160,821
2. Martinique
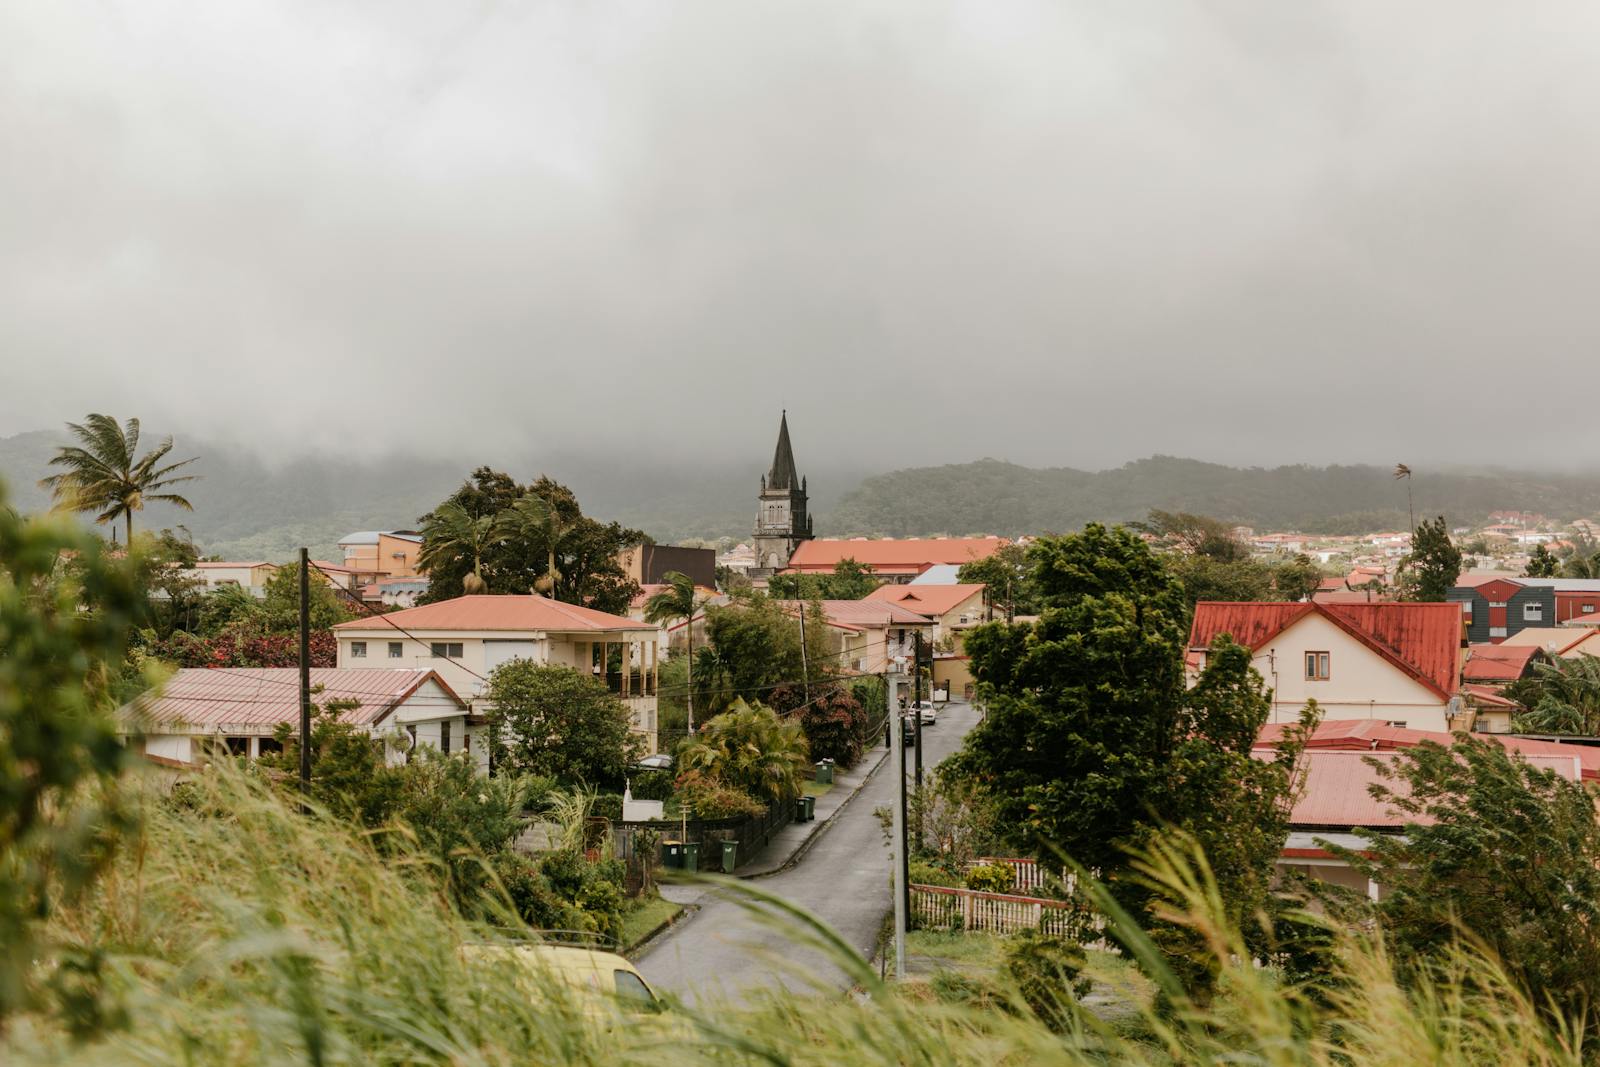
- Plastic waste that ends up in the ocean: 15.8% (22 metric tons per year)
- All mismanaged plastic waste generated: 139 metric tons per year
- Total population: 349,925
1. Brunei
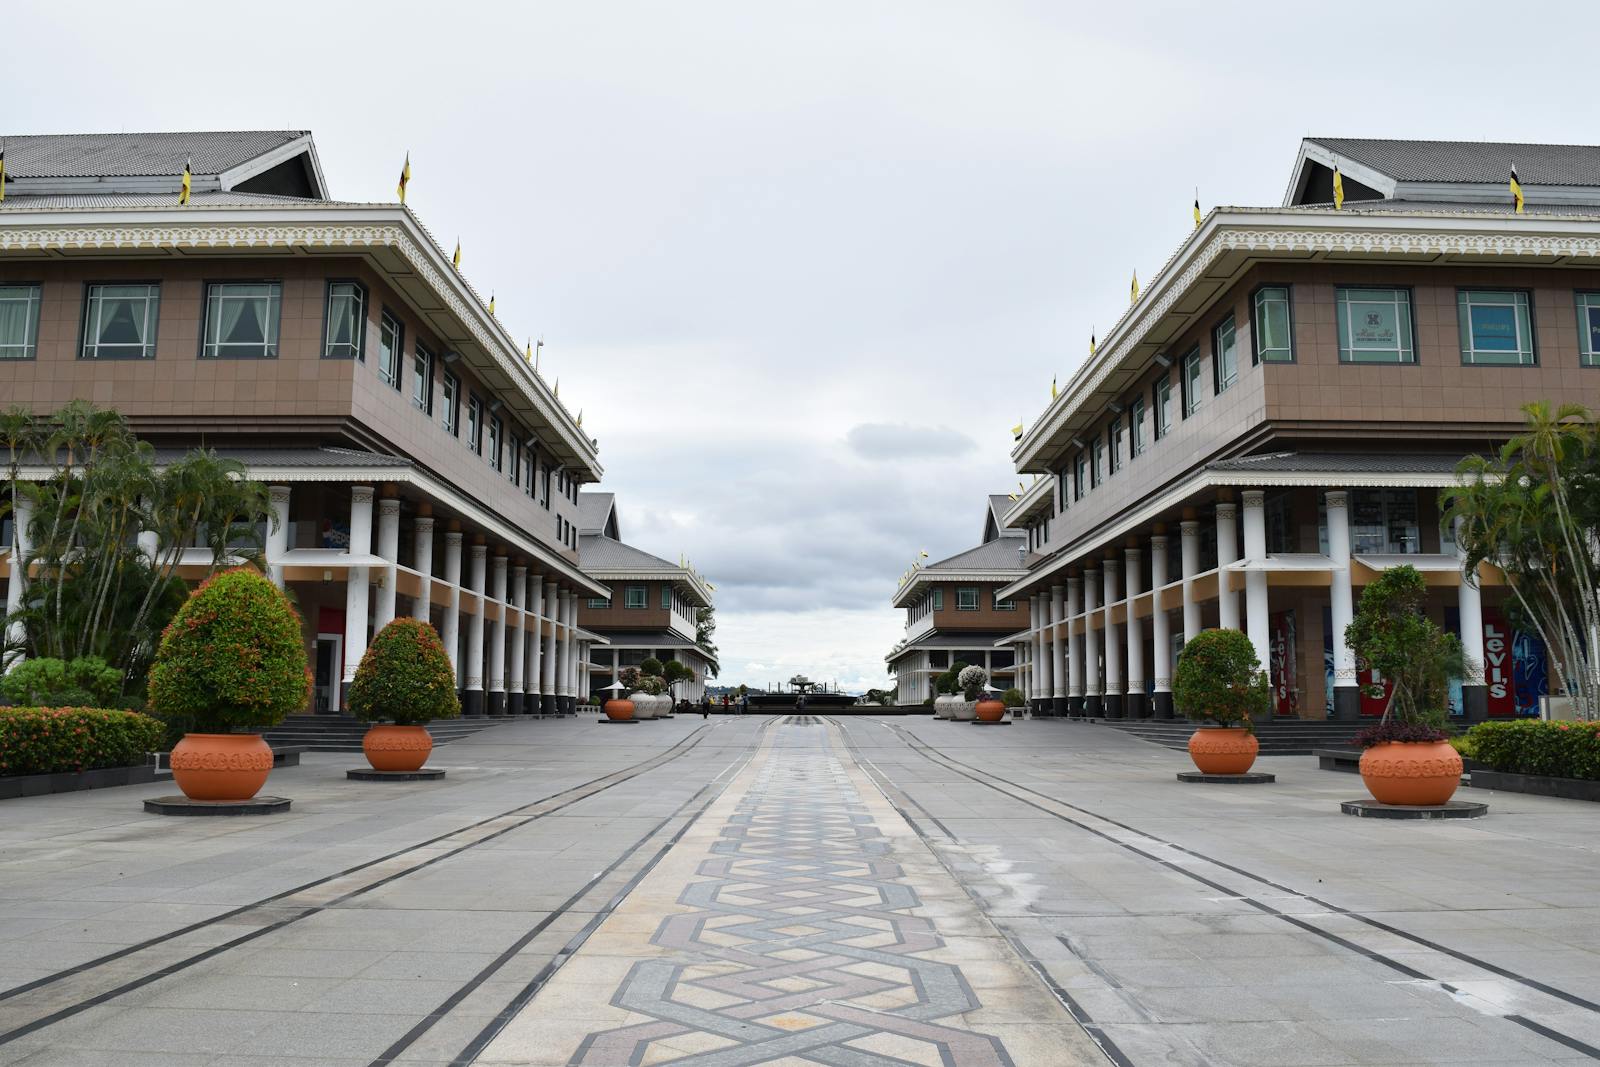
- Plastic waste that ends up in the ocean: 19.4% (134 metric tons per year)
- All mismanaged plastic waste generated: 692 metric tons per year
- Total population: 452,524