
The Nations Driving The Most Pollution In This Century
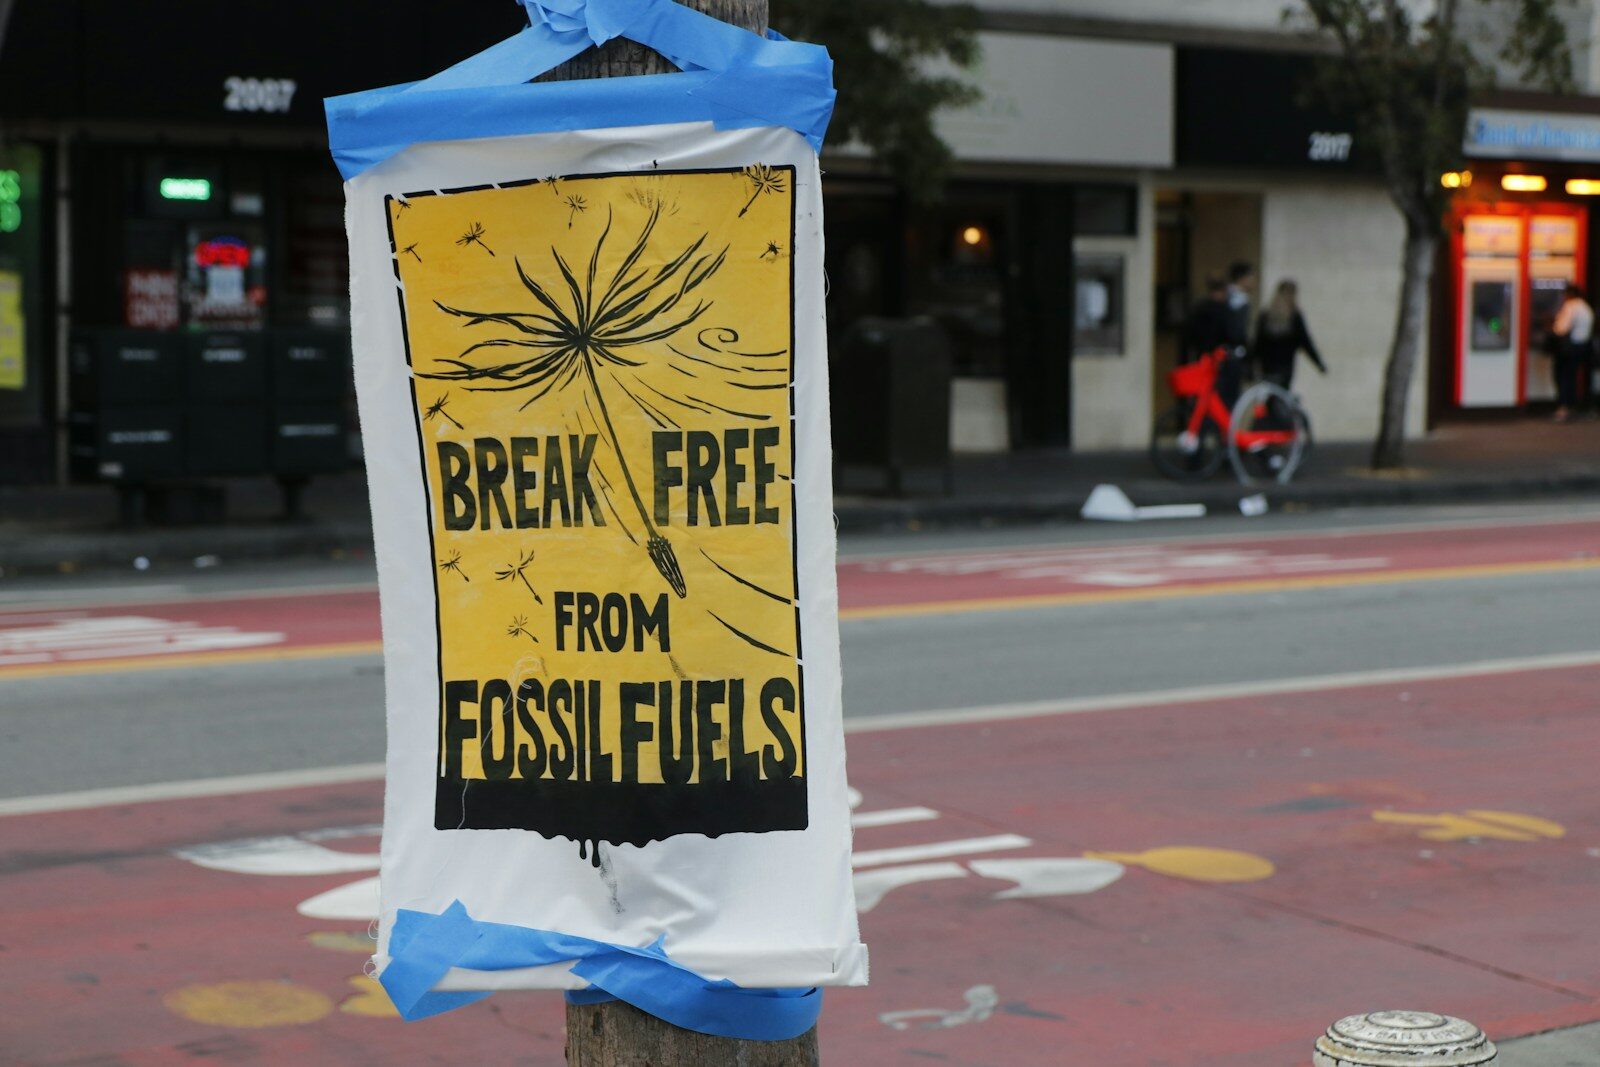
Growing public awareness of the climate change phenomenon, and our species’ contribution to it, has led to a surge in emissions-free energy production in recent decades. According to the energy think tank Ember, the amount of electricity produced through clean sources, like wind and solar, increased by over 150% globally between 2000 and 2025. While output from fossil fuel-burning plants also rose by about 85%, utilities have been moving toward cleaning burning fuels, like natural gas, and away from dirtier sources, like coal.
Despite these encouraging developments, power generation released nearly 14.6 billion metric tons of greenhouse gas emissions into the Earth’s atmosphere in 2025 alone, approximately one-quarter of carbon-equivalent emissions that year. Additionally, despite the transition to clean energy sources, global emissions from power production increased by 81% between 2000 and 2025, as overall electricity demand has also surged.
Even if the global power grid completely switched to clean energy overnight, carbon emissions from previous decades would still remain in the atmosphere, trapping heat and fueling climate change. Notably, so far in the 21st century, a small handful of countries have been responsible for the bulk of atmospheric pollution.
Using data from the Ember report, Global Electricity Review 2026, Climate Crisis 247 identified the heaviest polluting countries so far this century. We ranked all countries with available data on total reported carbon and carbon-equivalent emissions generated by the power sector between 2000 and 2025. All supplemental data is also from the report.

10. Australia
- Power sector greenhouse gas emissions since 2000: 4.6 billion metric tons (1.5% of global emissions)
- Clean energy sources as a share of power grid since 2000: 16.8%
- Dirty energy sources as a share of power grid since 2000: 83.2%
- Fastest growing clean energy source since 2000: Solar (+56.1 terawatt hours from 2000 to 2025)
- Solar as a share of domestic power generation: 0.0% in 2000; 19.6% in 2025
- Fastest growing dirty energy source since 2000: Gas (+30.3 terawatt hours from 2000 to 2025)
- Gas as a share of domestic power generation: 7.7% in 2000; 16.4% in 2025
9. Saudi Arabia
- Power sector greenhouse gas emissions since 2000: 5.0 billion metric tons (1.6% of global emissions)
- Clean energy sources as a share of power grid since 2000: 0.3%
- Dirty energy sources as a share of power grid since 2000: 99.7%
- Fastest growing clean energy source since 2000: Solar (+8.2 terawatt hours from 2000 to 2024)
- Solar as a share of domestic power generation: 0.0% in 2000; 1.8% in 2024
- Fastest growing dirty energy source since 2000: Gas (+224.1 terawatt hours from 2000 to 2024)
- Gas as a share of domestic power generation: 63.8% in 2000; 63.3% in 2025
8. South Africa
- Power sector greenhouse gas emissions since 2000: 5.0 billion metric tons (1.6% of global emissions)
- Clean energy sources as a share of power grid since 2000: 8.6%
- Dirty energy sources as a share of power grid since 2000: 91.4%
- Fastest growing clean energy source since 2000: Solar (+19.5 terawatt hours from 2000 to 2025)
- Solar as a share of domestic power generation: 0.0% in 2000; 8.0% in 2025
- Fastest growing dirty energy source since 2000: Coal (+1.4 terawatt hours from 2000 to 2025)
- Coal as a share of domestic power generation: 93.1% in 2000; 81.4% in 2025
7. South Korea
- Power sector greenhouse gas emissions since 2000: 6.1 billion metric tons (2.0% of global emissions)
- Clean energy sources as a share of power grid since 2000: 34.2%
- Dirty energy sources as a share of power grid since 2000: 65.8%
- Fastest growing clean energy source since 2000: Nuclear (+75.7 terawatt hours from 2000 to 2025)
- Nuclear as a share of domestic power generation: 37.5% in 2000; 29.6% in 2025
- Fastest growing dirty energy source since 2000: Gas (+144.9 terawatt hours from 2000 to 2025)
- Gas as a share of domestic power generation: 10.2% in 2000; 27.9% in 2025
6. Germany
- Power sector greenhouse gas emissions since 2000: 7.6 billion metric tons (2.5% of global emissions)
- Clean energy sources as a share of power grid since 2000: 43.2%
- Dirty energy sources as a share of power grid since 2000: 56.8%
- Fastest growing clean energy source since 2000: Wind (+126.7 terawatt hours from 2000 to 2025)
- Wind as a share of domestic power generation: 1.6% in 2000; 27.2% in 2025
- Fastest growing dirty energy source since 2000: Bioenergy (+46.2 terawatt hours from 2000 to 2025)
- Bioenergy as a share of domestic power generation: 0.8% in 2000; 10.1% in 2025
5. Russia
- Power sector greenhouse gas emissions since 2000: 12.3 billion metric tons (4.0% of global emissions)
- Clean energy sources as a share of power grid since 2000: 34.7%
- Dirty energy sources as a share of power grid since 2000: 65.3%
- Fastest growing clean energy source since 2000: Nuclear (+87.9 terawatt hours from 2000 to 2025)
- Nuclear as a share of domestic power generation: 14.9% in 2000; 18.3% in 2025
- Fastest growing dirty energy source since 2000: Gas (+162.8 terawatt hours from 2000 to 2025)
- Gas as a share of domestic power generation: 42.2% in 2000; 44.7% in 2025
4. Japan
- Power sector greenhouse gas emissions since 2000: 14.2 billion metric tons (4.6% of global emissions)
- Clean energy sources as a share of power grid since 2000: 27.3%
- Dirty energy sources as a share of power grid since 2000: 72.7%
- Fastest growing clean energy source since 2000: Solar (+100.7 terawatt hours from 2000 to 2025)
- Solar as a share of domestic power generation: 0.0% in 2000; 9.8% in 2025
- Fastest growing dirty energy source since 2000: Coal (+91.4 terawatt hours from 2000 to 2025)
- Coal as a share of domestic power generation: 21.7% in 2000; 32.0% in 2025
3. India
- Power sector greenhouse gas emissions since 2000: 22.4 billion metric tons (7.3% of global emissions)
- Clean energy sources as a share of power grid since 2000: 19.9%
- Dirty energy sources as a share of power grid since 2000: 80.1%
- Fastest growing clean energy source since 2000: Solar (+196.0 terawatt hours from 2000 to 2025)
- Solar as a share of domestic power generation: 0.0% in 2000; 9.4% in 2025
- Fastest growing dirty energy source since 2000: Coal (+1,083.9 terawatt hours from 2000 to 2025)
- Coal as a share of domestic power generation: 68.3% in 2000; 70.8% in 2025
2. United States
- Power sector greenhouse gas emissions since 2000: 54.7 billion metric tons (17.7% of global emissions)
- Clean energy sources as a share of power grid since 2000: 33.7%
- Dirty energy sources as a share of power grid since 2000: 66.3%
- Fastest growing clean energy source since 2000: Wind (+458.8 terawatt hours from 2000 to 2025)
- Wind as a share of domestic power generation: 0.1% in 2000; 10.3% in 2025
- Fastest growing dirty energy source since 2000: Gas (+1,192.4 terawatt hours from 2000 to 2025)
- Gas as a share of domestic power generation: 16.2% in 2000; 40.0% in 2025
1. China
- Power sector greenhouse gas emissions since 2000: 90.1 billion metric tons (29.2% of global emissions)
- Clean energy sources as a share of power grid since 2000: 28.9%
- Dirty energy sources as a share of power grid since 2000: 71.1%
- Fastest growing clean energy source since 2000: Hydro (+1,176.9 terawatt hours from 2000 to 2025)
- Hydro as a share of domestic power generation: 16.4% in 2000; 13.2% in 2025
- Fastest growing dirty energy source since 2000: Coal (+4,696.7 terawatt hours from 2000 to 2025)
- Coal as a share of domestic power generation: 78.2% in 2000; 54.4% in 2025
More from ClimateCrisis 247
- The 10 Best-Selling EVs of 2026, So Far
- 10 EVs With Sales Heading Toward Zero
- What Happens When Extreme Weather Becomes a Cycle You Can’t Escape
- The 20 Largest Oil-Producing Nations in the World





