Trump’s Tariffs and the Transition to Clean Energy: These Countries Are the Winners in a Net Zero World
 https://climate-crisis-247-bucket.nyc3.cdn.digitaloceanspaces.com/wp-content/uploads/2025/04/07224734/1108572-1-150x150.jpeg
The past week, a bevy of tumultuous tariff announcements from President Trump sent shockwaves through the financial world. The tug-of-war tariff communications introduced unprecedented volatility into the stock market, and exposed critical vulnerabilities in the global supply chain. Companies dependent on imports from heavily taxed regions like China and the EU are struggling to diversify suppliers and bring production closer to home, while investors are selling off U.S. Treasuries en masse.
DOGE backlash? The Federal Departments Americans Want To Keep
Dying for air? Climate Activism Is Turning Deadly In These Cities
The ongoing trade war foreshadows many of the supply chain issues that will arise in the transition to green energy. While in the current paradigm countries with large fossil fuel reserves face little energy insecurity, the transition to clean energy will create new dependencies on the regions where metals used in batteries and solar panels like cobalt, lithium, and nickel are concentrated.
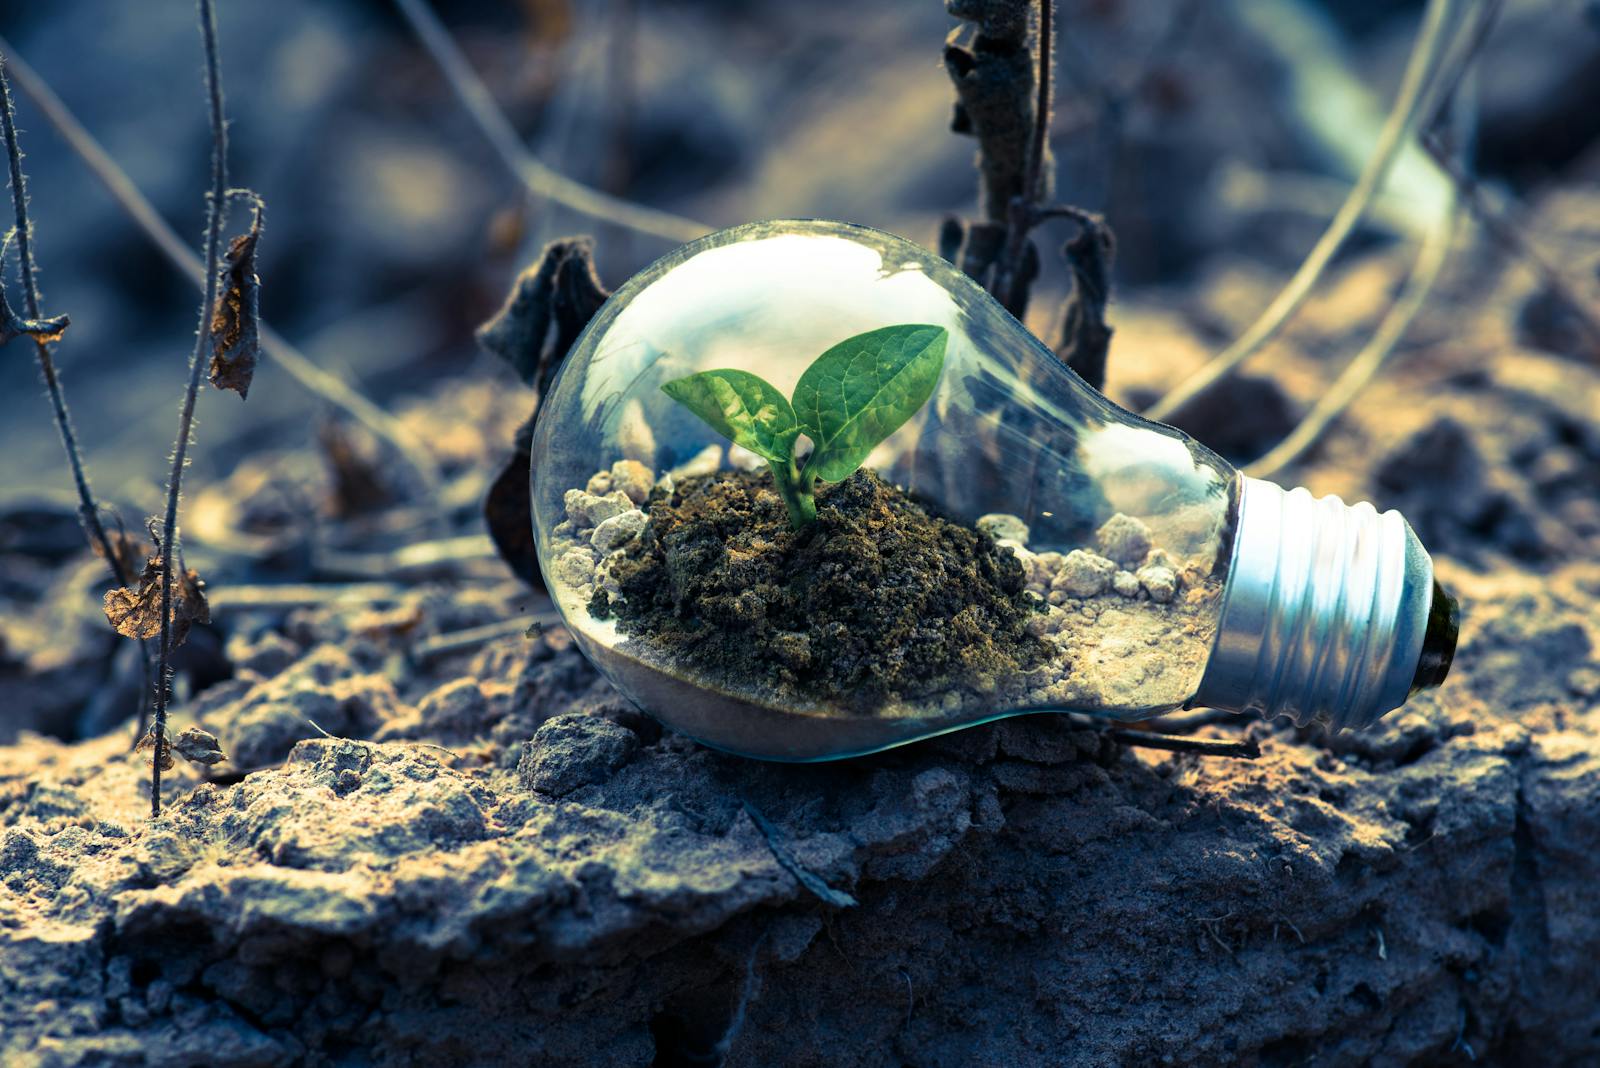
The path to new zero will create some winners and some losers. Countries with critical mineral resources and good trade relations will benefit, while geopolitically isolated countries dependent on oil reserves will suffer. Countries with diverse trade ties, modest energy needs, and little to lose from fossil fuel phaseout gain the most energy security in a net zero world. Using data from a new study published in the Nature Climate Change journal, we identified the countries that will lose the most from the green energy transition.
To determine the countries that will benefit the most from the green energy transition, Climate Crisis 247 reviewed data from the April 2025 paper "Trade risks to energy security in net-zero emissions energy scenarios." Countries were ranked based on the forecast change in trade vulnerability that will result from net zero emissions. Trade vulnerability is measured by the Trade Risk Index, a factor of import dependence and supplier concentration in fuels, critical minerals, and electricity and transportation systems. Countries are ranked based on the average change in TRI across 1,092 scenarios for cutting carbon emissions by 2060. Only countries with at least 1 million residents were considered.
15. Peru
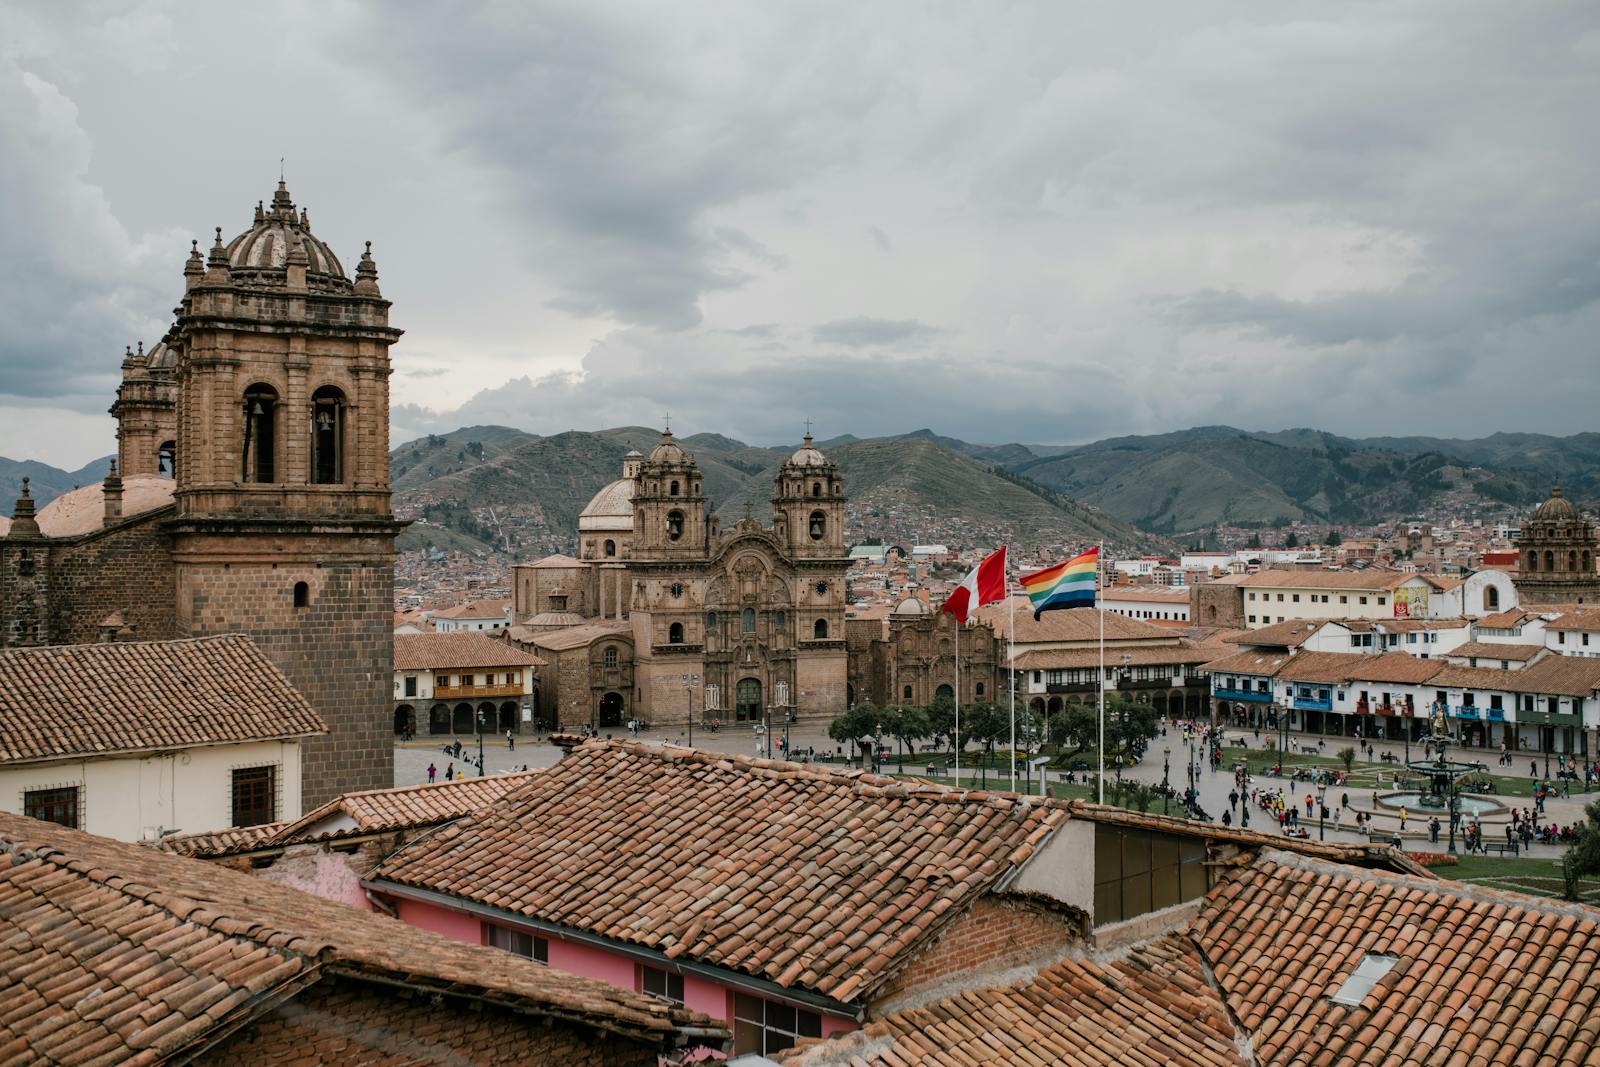
- Rise in Trade Risk Index in net zero emissions scenario: -0.3636
- Share of global critical minerals used for electricity generation: 1.5%
- Share of global critical materials used for electric vehicles: 2.9%
- Share of global gas and coal production: 0.0%
- Share of global oil production: 0.0%
- Total population: 33,845,617
14. Bahrain
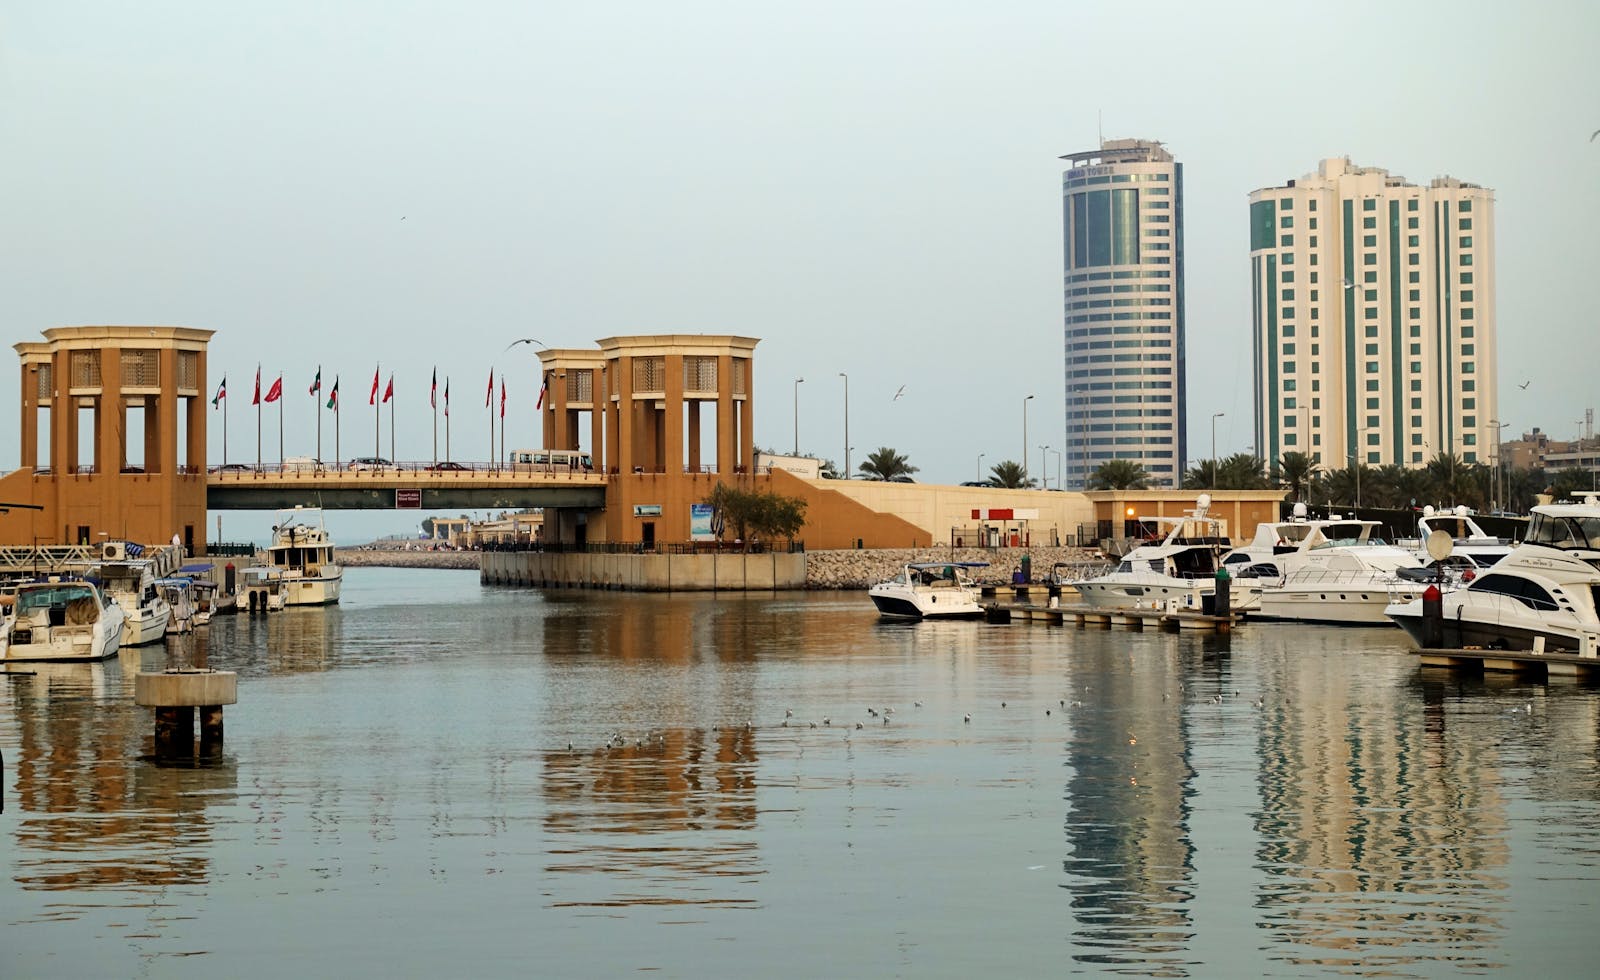
- Rise in Trade Risk Index in net zero emissions scenario: -0.3653
- Share of global critical minerals used for electricity generation: 0.1%
- Share of global critical materials used for electric vehicles: 0.2%
- Share of global gas and coal production: 0.0%
- Share of global oil production: 0.0%
- Total population: 1,577,059
13. Finland

- Rise in Trade Risk Index in net zero emissions scenario: -0.3704
- Share of global critical minerals used for electricity generation: 0.1%
- Share of global critical materials used for electric vehicles: 0.5%
- Share of global gas and coal production: 0.0%
- Share of global oil production: 0.0%
- Total population: 5,583,911
12. Costa Rica
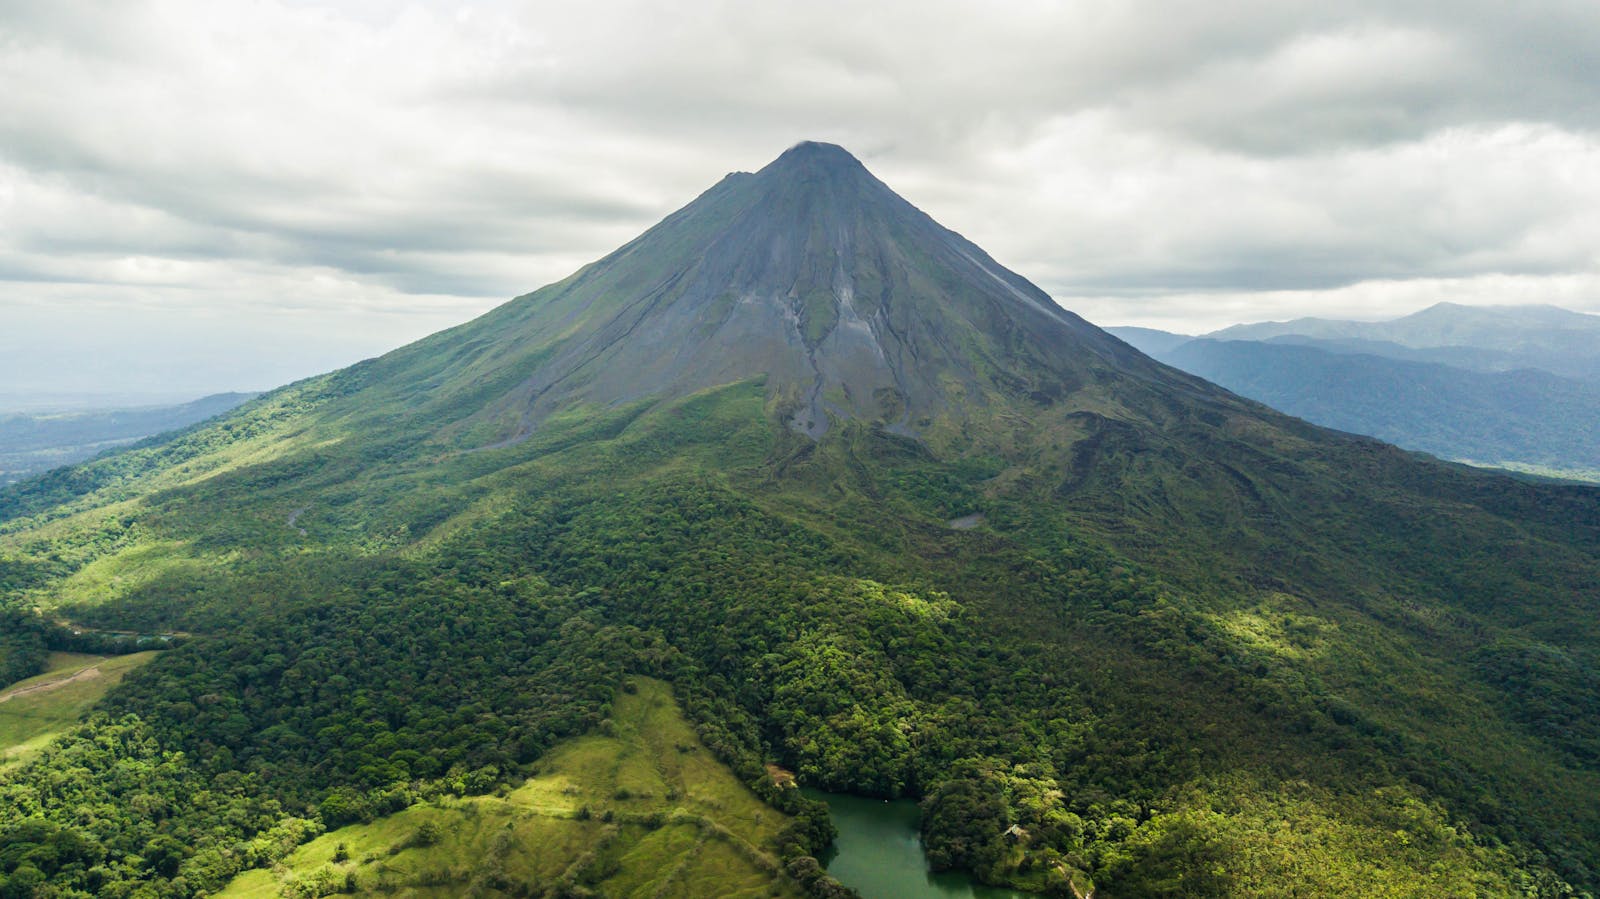
- Rise in Trade Risk Index in net zero emissions scenario: -0.3745
- Share of global critical minerals used for electricity generation: 0.0%
- Share of global critical materials used for electric vehicles: 0.0%
- Share of global gas and coal production: 0.0%
- Share of global oil production: 0.0%
- Total population: 5,105,525
11. North Macedonia
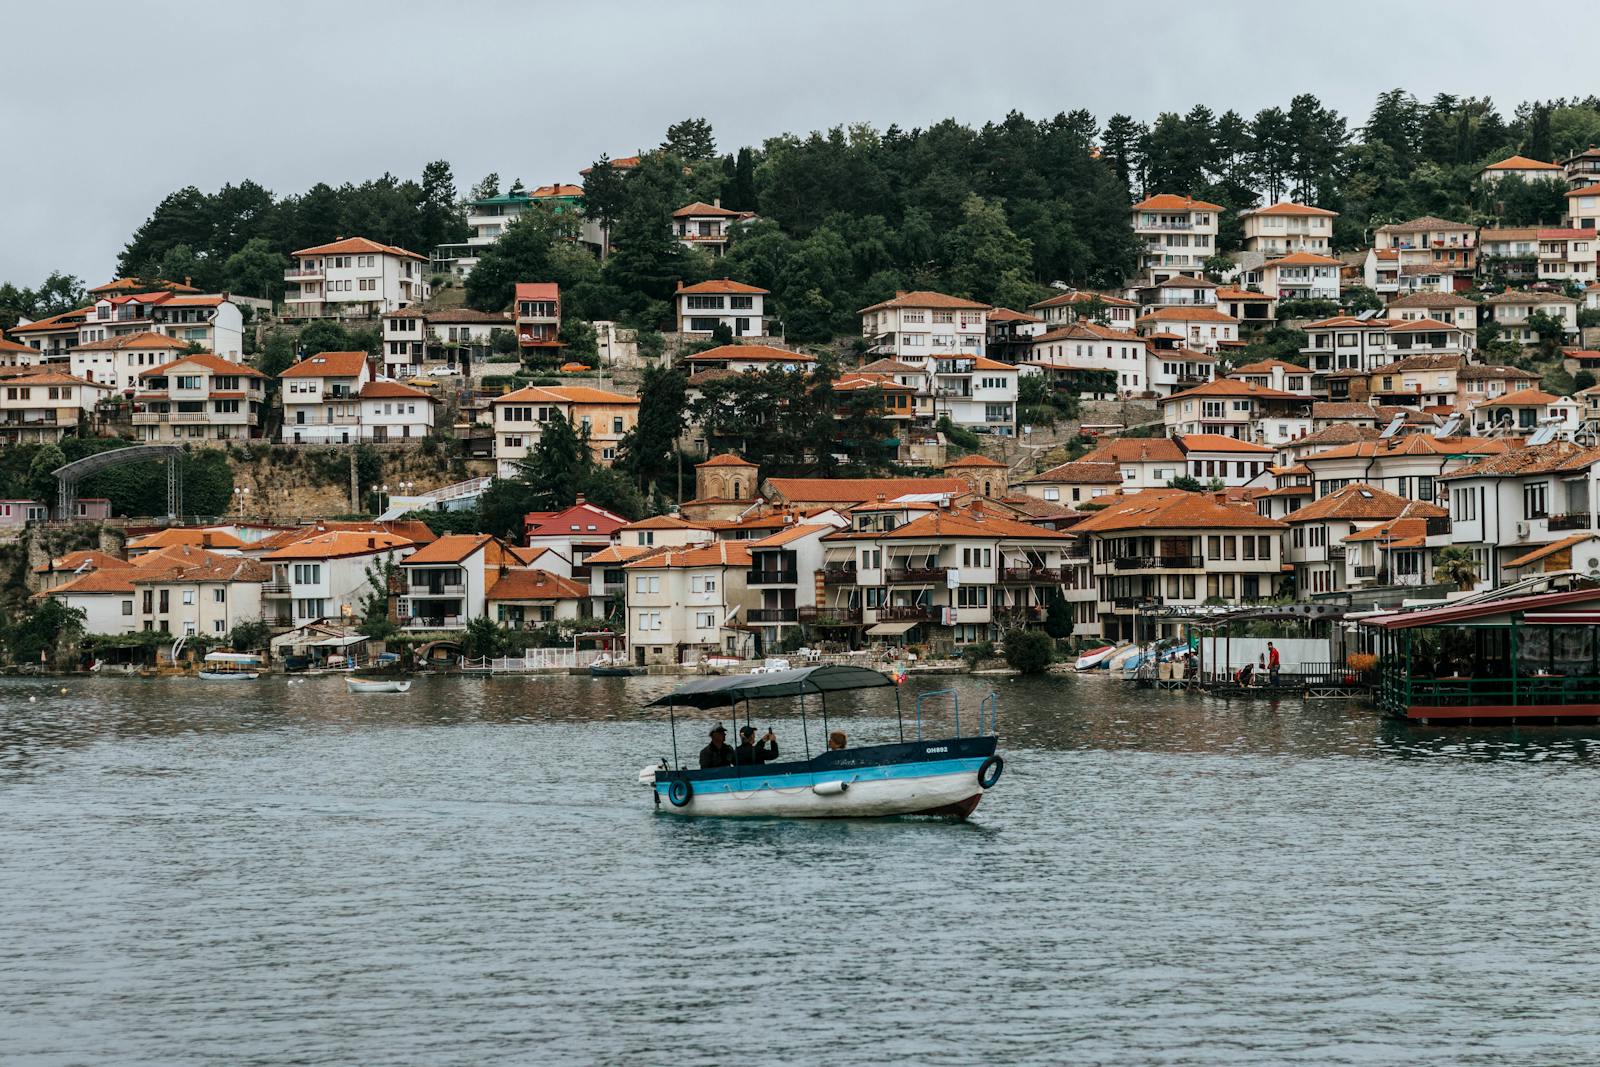
- Rise in Trade Risk Index in net zero emissions scenario: -0.3942
- Share of global critical minerals used for electricity generation: 0.0%
- Share of global critical materials used for electric vehicles: 0.1%
- Share of global gas and coal production: 0.0%
- Share of global oil production: 0.0%
- Total population: 1,827,816
10. Philippines
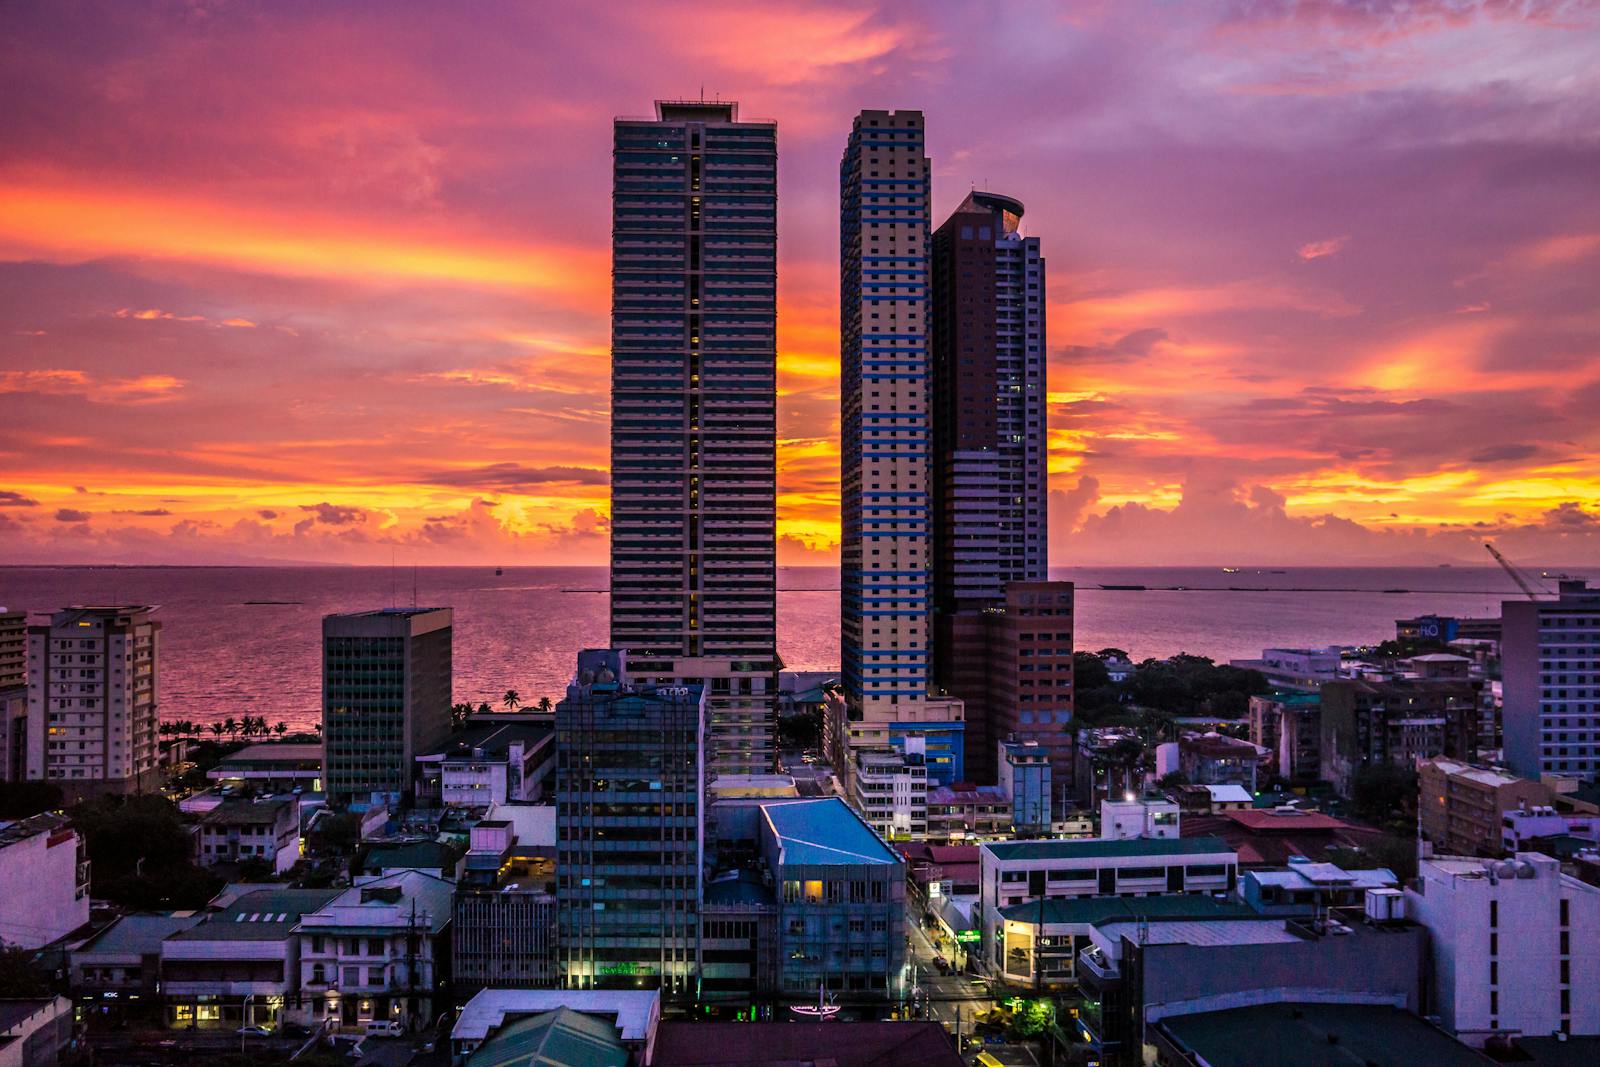
- Rise in Trade Risk Index in net zero emissions scenario: -0.3956
- Share of global critical minerals used for electricity generation: 0.2%
- Share of global critical materials used for electric vehicles: 1.4%
- Share of global gas and coal production: 0.0%
- Share of global oil production: 0.0%
- Total population: 114,891,199
9. Thailand
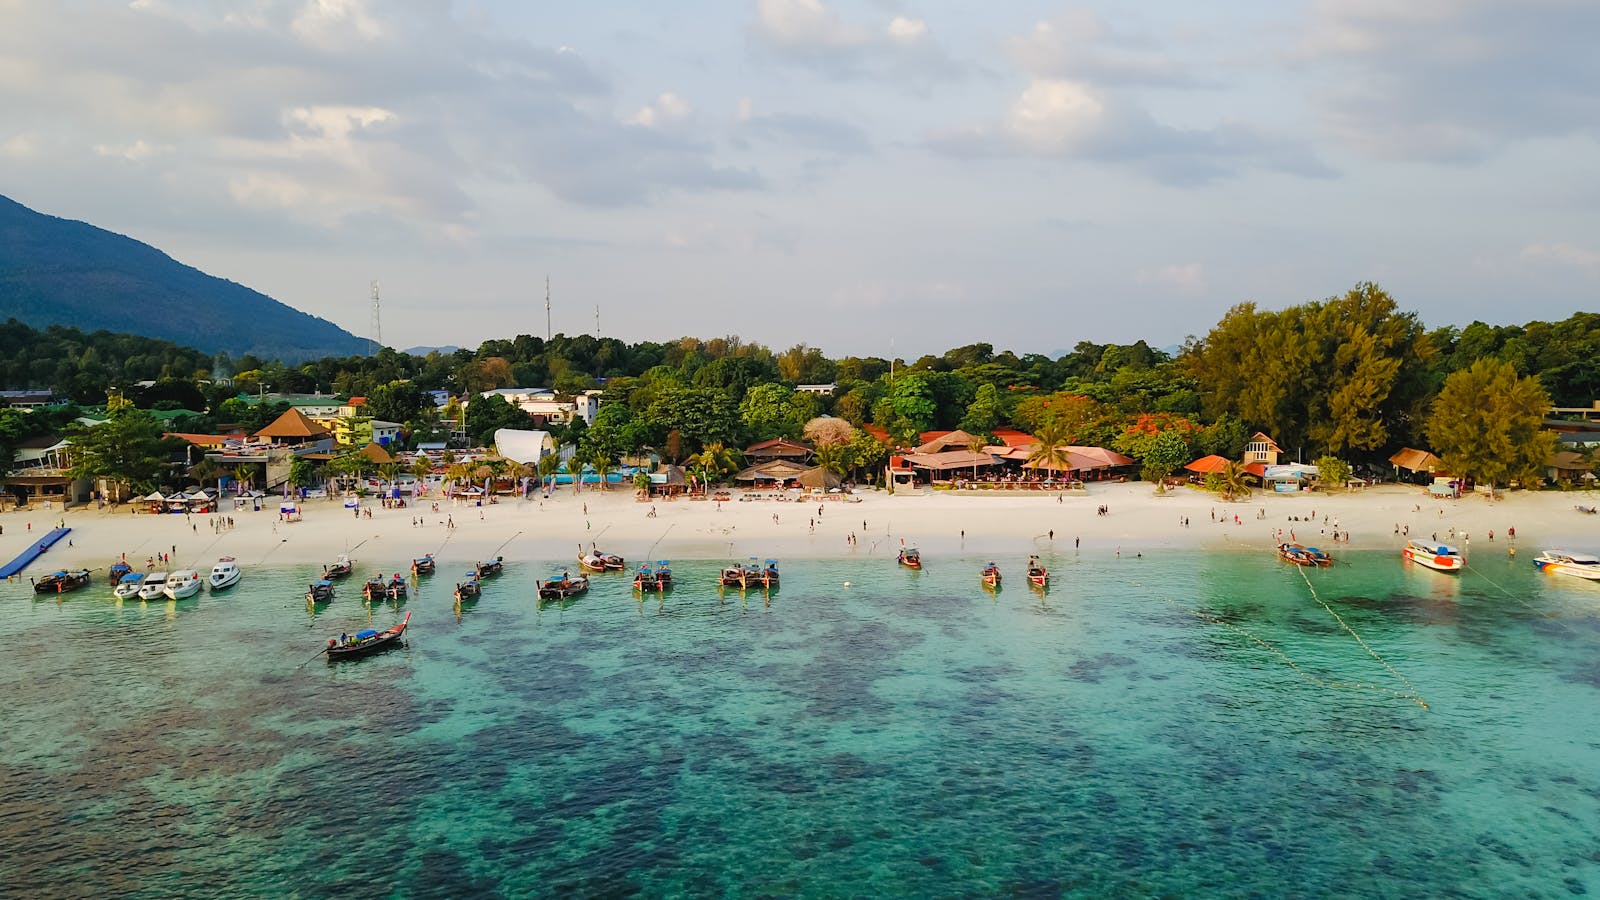
- Rise in Trade Risk Index in net zero emissions scenario: -0.4008
- Share of global critical minerals used for electricity generation: 0.3%
- Share of global critical materials used for electric vehicles: 0.0%
- Share of global gas and coal production: 0.1%
- Share of global oil production: 0.0%
- Total population: 71,702,435
8. Bulgaria
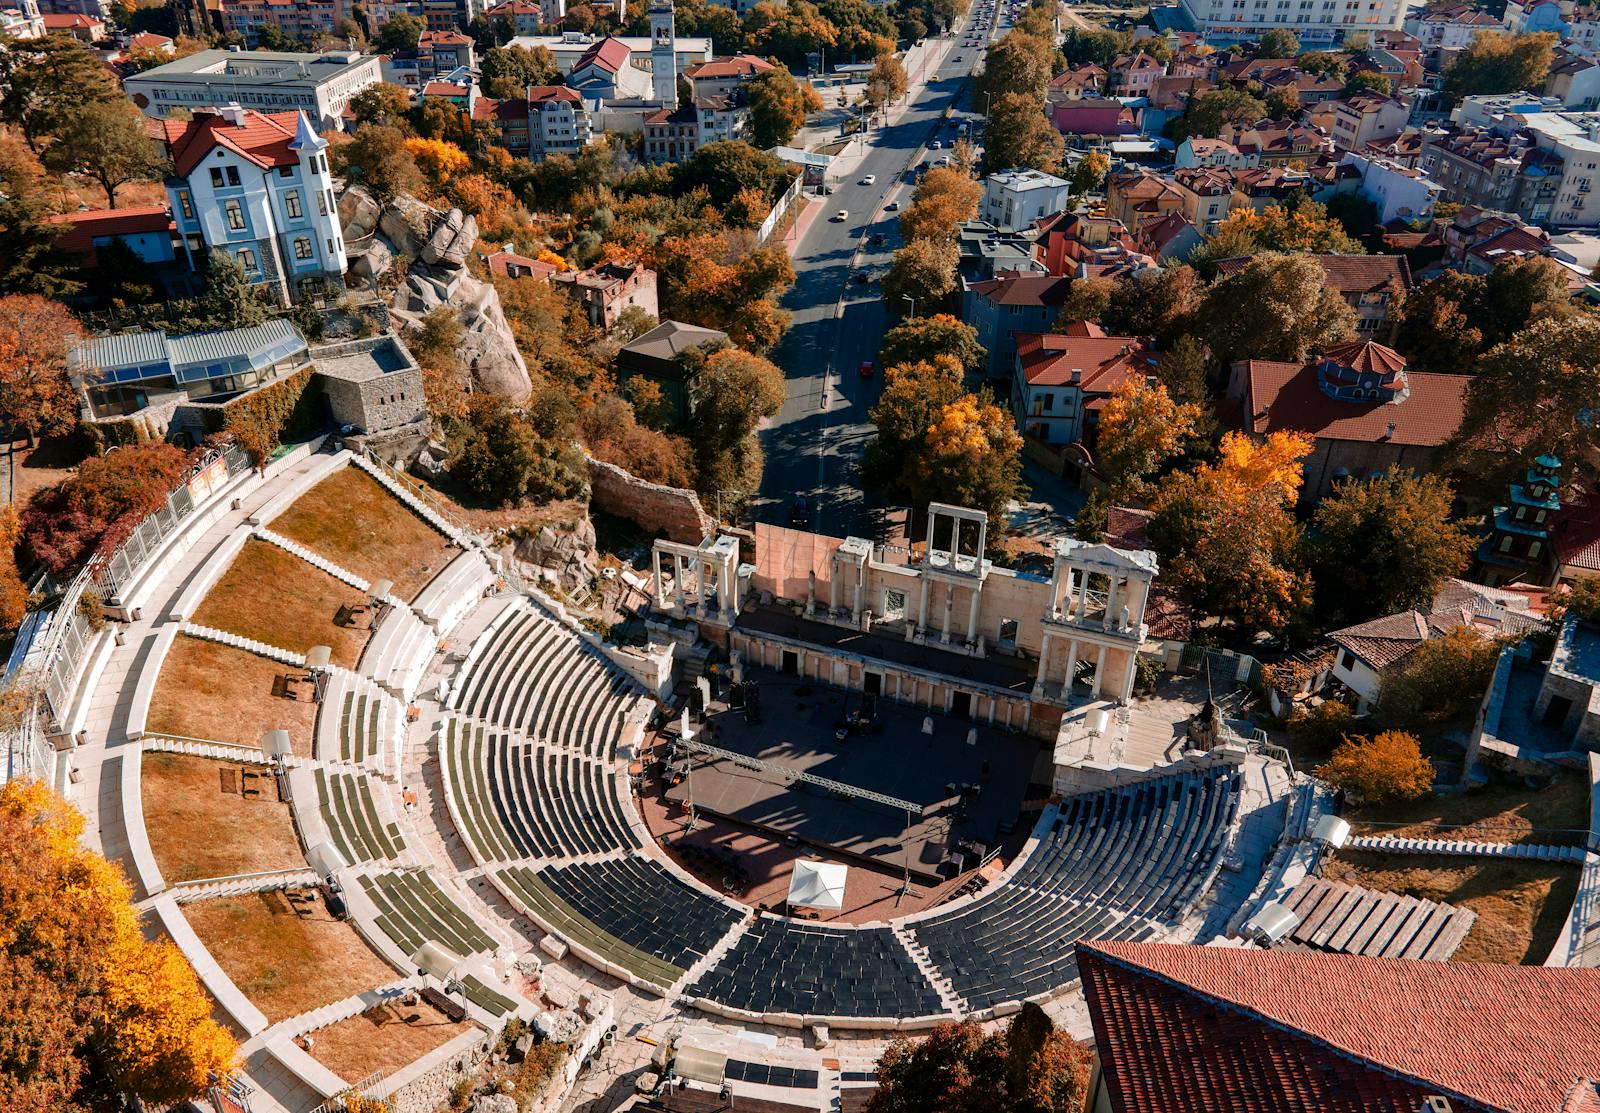
- Rise in Trade Risk Index in net zero emissions scenario: -0.4051
- Share of global critical minerals used for electricity generation: 0.1%
- Share of global critical materials used for electric vehicles: 0.4%
- Share of global gas and coal production: 0.2%
- Share of global oil production: 0.0%
- Total population: 6,446,596
7. Trinidad and Tobago

- Rise in Trade Risk Index in net zero emissions scenario: -0.4122
- Share of global critical minerals used for electricity generation: 0.0%
- Share of global critical materials used for electric vehicles: 0.0%
- Share of global gas and coal production: 0.0%
- Share of global oil production: 0.0%
- Total population: 1,367,510
6. Argentina
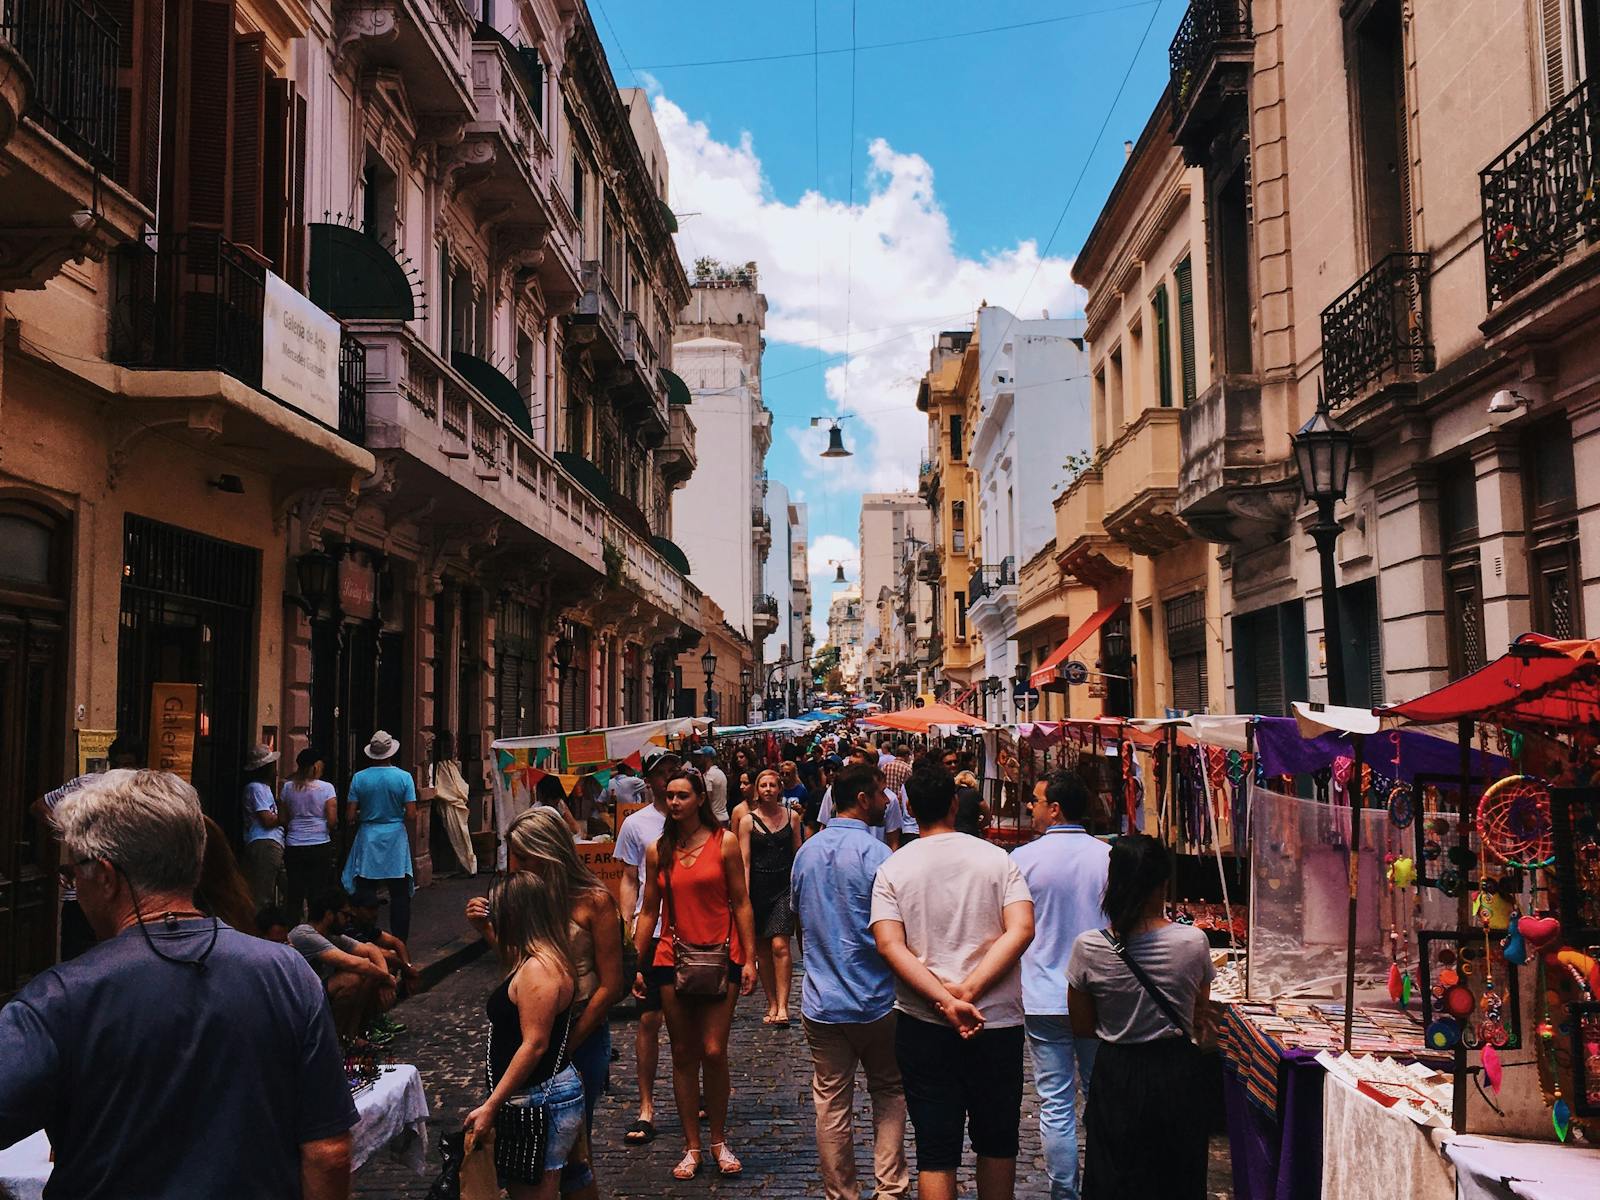
- Rise in Trade Risk Index in net zero emissions scenario: -0.4176
- Share of global critical minerals used for electricity generation: 0.2%
- Share of global critical materials used for electric vehicles: 2.2%
- Share of global gas and coal production: 0.1%
- Share of global oil production: 0.1%
- Total population: 45,538,401
5. Pakistan
- Rise in Trade Risk Index in net zero emissions scenario: -0.4189
- Share of global critical minerals used for electricity generation: 0.3%
- Share of global critical materials used for electric vehicles: 0.0%
- Share of global gas and coal production: 0.3%
- Share of global oil production: 0.0%
- Total population: 247,504,495
4. Latvia

- Rise in Trade Risk Index in net zero emissions scenario: -0.4674
- Share of global critical minerals used for electricity generation: 0.0%
- Share of global critical materials used for electric vehicles: 0.0%
- Share of global gas and coal production: 0.0%
- Share of global oil production: 0.0%
- Total population: 1,877,445
3. Mexico
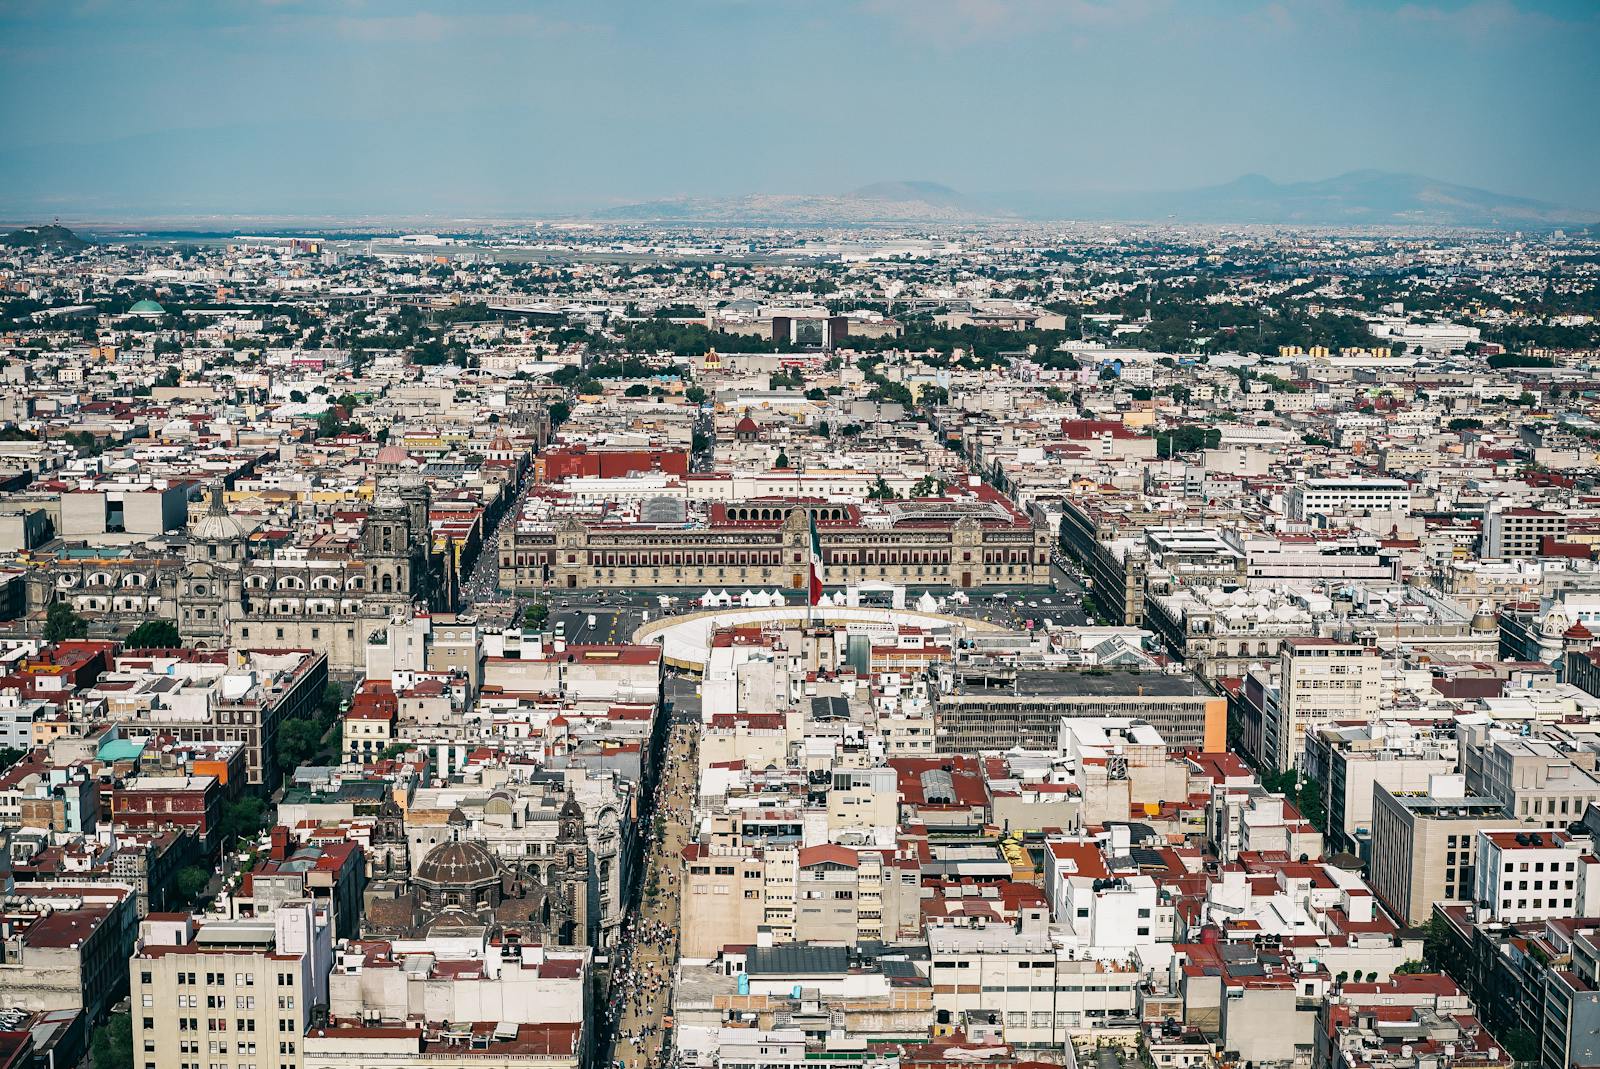
- Rise in Trade Risk Index in net zero emissions scenario: -0.4801
- Share of global critical minerals used for electricity generation: 1.0%
- Share of global critical materials used for electric vehicles: 2.5%
- Share of global gas and coal production: 0.1%
- Share of global oil production: 0.4%
- Total population: 129,739,759
2. Belarus
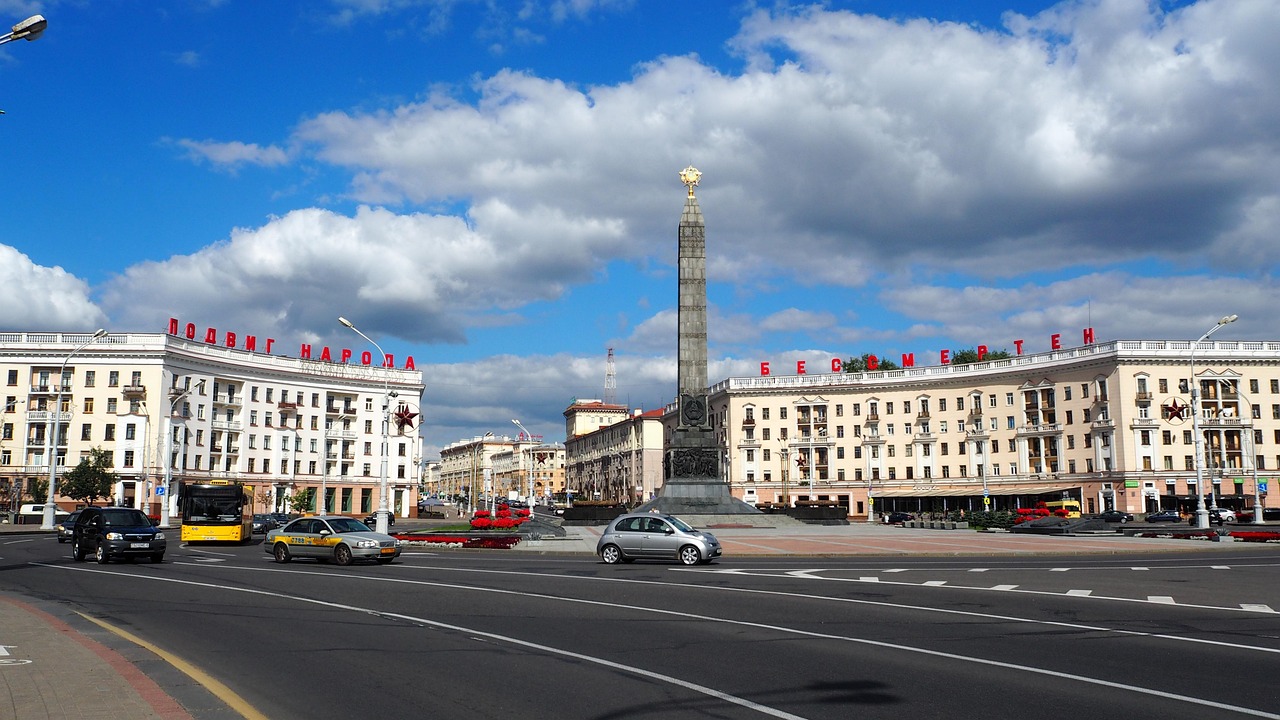
- Rise in Trade Risk Index in net zero emissions scenario: -0.4873
- Share of global critical minerals used for electricity generation: 0.1%
- Share of global critical materials used for electric vehicles: 0.0%
- Share of global gas and coal production: 0.0%
- Share of global oil production: 0.0%
- Total population: 9,178,298
1. Estonia
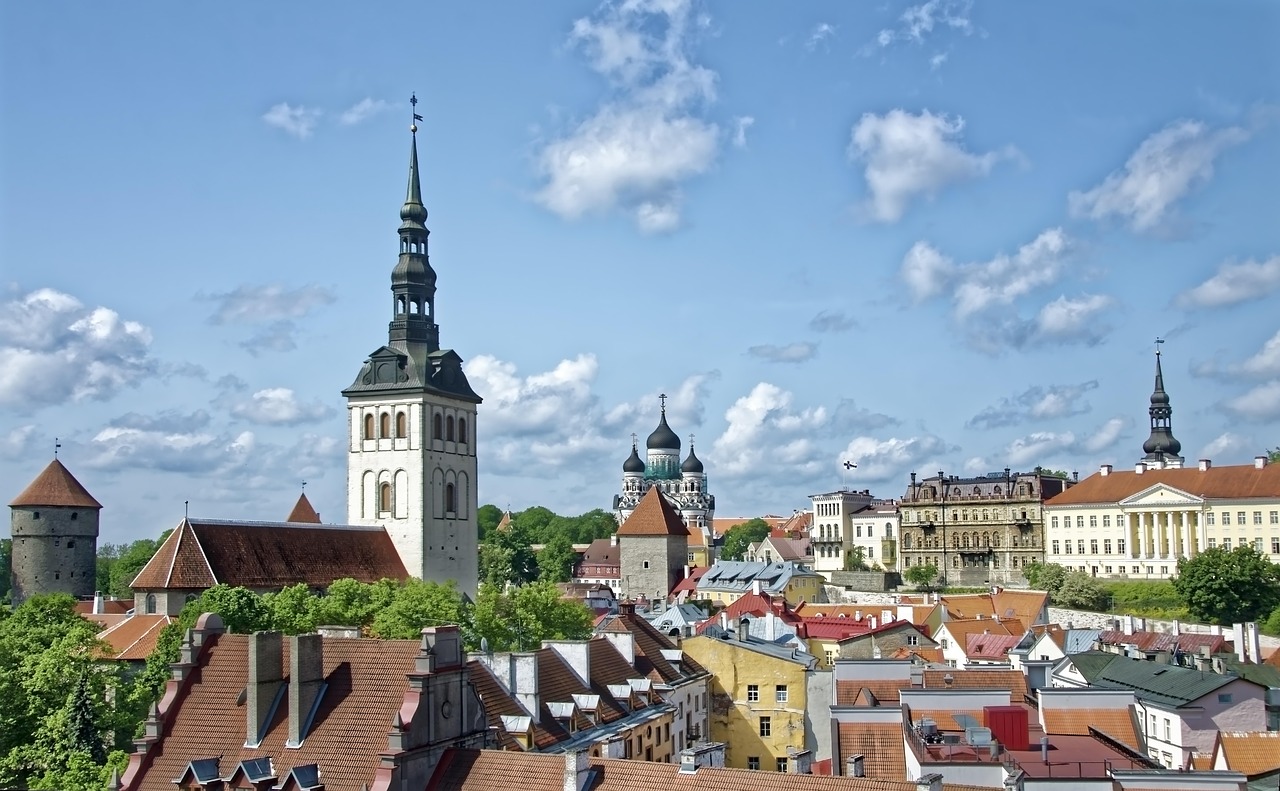
- Rise in Trade Risk Index in net zero emissions scenario: -0.5071
- Share of global critical minerals used for electricity generation: 0.0%
- Share of global critical materials used for electric vehicles: 0.0%
- Share of global gas and coal production: 0.0%
- Share of global oil production: 0.0%
- Total population: 1,370,286
Sponsor
Find a Vetted Financial Advisor
- Finding a fiduciary financial advisor doesn't have to be hard. SmartAsset's free tool matches you with up to 3 financial advisors that serve your area in 5 minutes.
- Each advisor has been vetted by SmartAsset and is held to a fiduciary standard to act in your best interests. Get on the path toward achieving your financial goals!