Trump’s Tariffs and the Transition To Net Zero: Where Going Green Could Upend Energy Security
 https://climate-crisis-247-bucket.nyc3.cdn.digitaloceanspaces.com/wp-content/uploads/2025/04/07224816/1108572-150x150.jpeg
The past week, a series of tumultuous tariff announcements from President Trump injected unprecedented volatility into the stock market and exposed critical vulnerabilities in the global supply chain. Companies dependent on imports from heavily taxed regions like China and the EU are struggling to diversify suppliers and bring production closer to home, while many investors are preparing for huge contractions in industries with high degrees of international dependence.
DOGE backlash? The Federal Departments Americans Want To Keep
Dying for air? Climate Activism Is Turning Deadly In These Cities
The ongoing trade war foreshadows many of the supply chain issues that will arise in the transition to green energy. While countries with large fossil fuel reserves have high energy independence, the transition to clean energy will create new dependencies on the regions where metals used in batteries and solar panels like cobalt, lithium, and nickel are concentrated.
As countries electrify their grids and scale up clean technologies like wind turbines and electric vehicles, the new net zero energy paradigm will create some winners and some losers. Countries with oil reserves and pipelines may face new supply risks, while countries with critical minerals stand to benefit. Geopolitically isolated countries with no natural resources will face the greatest trade vulnerabilities. Using data from a new study published in the Nature Climate Change journal, we identified the countries that will lose the most from the green energy transition.
To determine the countries that will lose the most from the green energy transition, Climate Crisis 247 reviewed data from the April 2025 paper "Trade risks to energy security in net-zero emissions energy scenarios." Countries were ranked based on the forecast change in trade vulnerability that will result from net zero emissions. Trade vulnerability is measured by the Trade Risk Index, a factor of import dependence and supplier concentration in fuels, critical minerals, and electricity and transportation systems. Countries are ranked based on the average change in TRI across 1,092 scenarios for cutting carbon emissions by 2060. Only countries with at least 1 million residents were considered.
15. Venezuela

- Rise in Trade Risk Index in net zero emissions scenario: +0.0683
- Share of global critical minerals used for electricity generation: 0.1%
- Share of global critical materials used for electric vehicles: 0.1%
- Share of global gas and coal production: 0.6%
- Share of global oil production: 19.7%
- Total population: 28,300,854
14. Libya
- Rise in Trade Risk Index in net zero emissions scenario: +0.0763
- Share of global critical minerals used for electricity generation: 0.0%
- Share of global critical materials used for electric vehicles: 0.0%
- Share of global gas and coal production: 0.1%
- Share of global oil production: 2.6%
- Total population: 7,305,659
13. Senegal
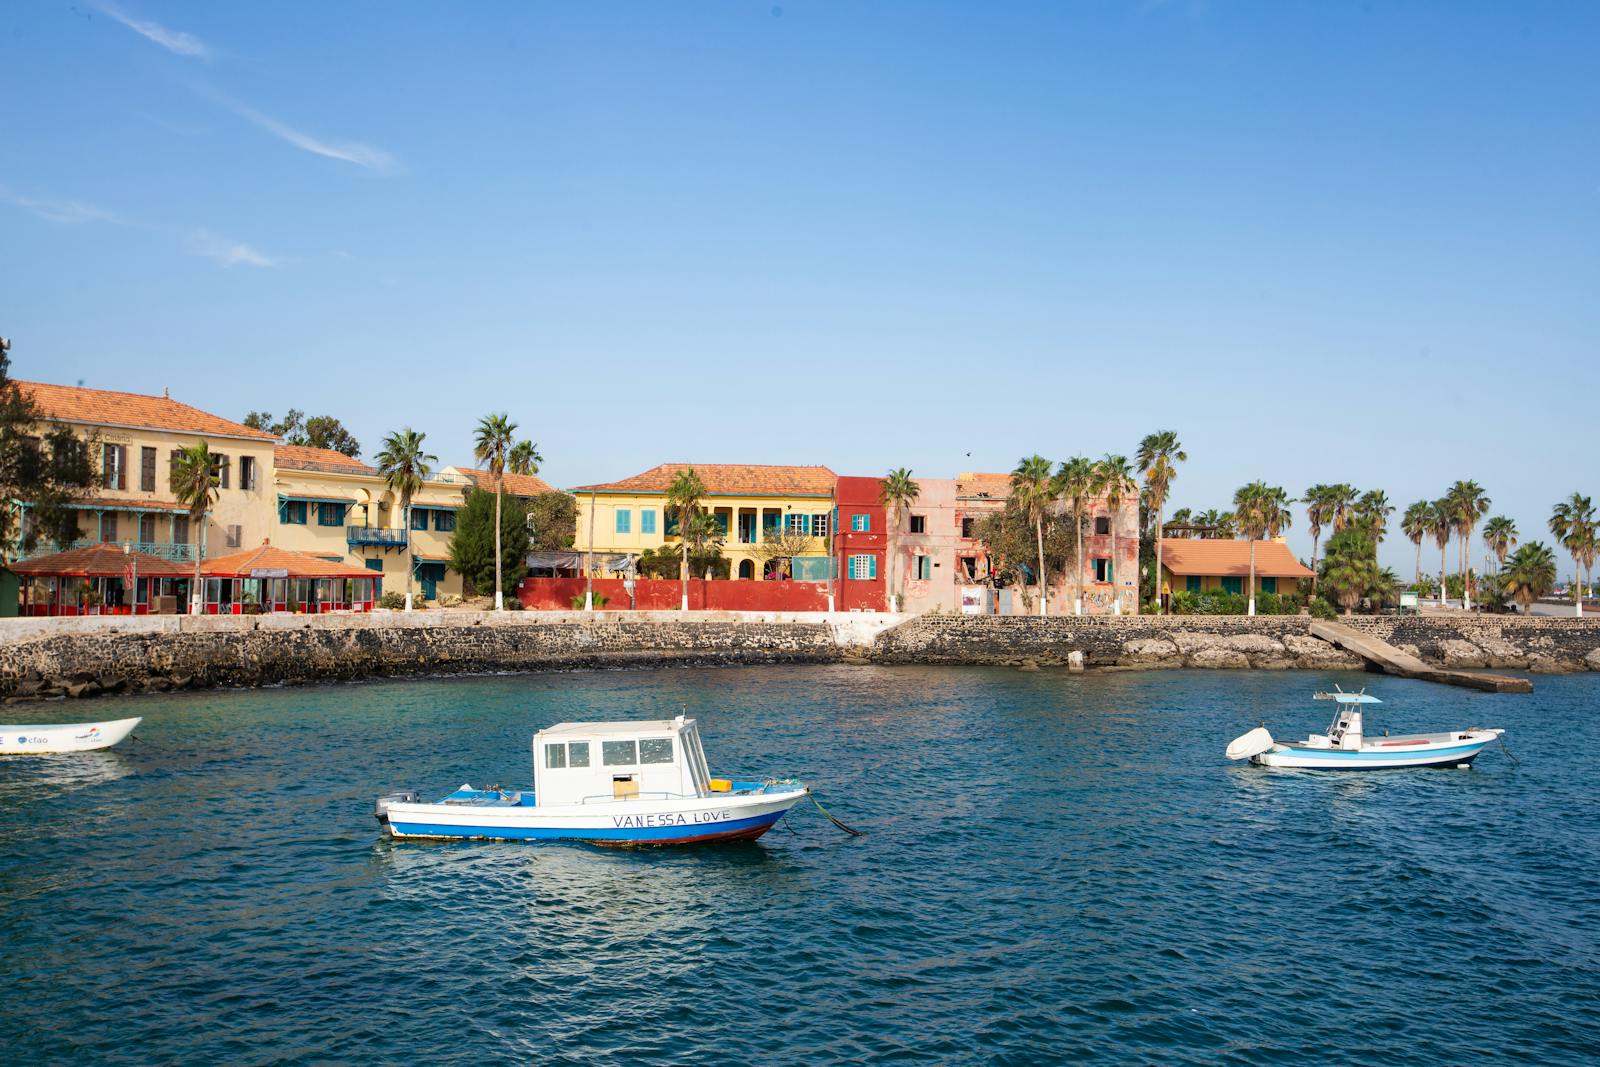
- Rise in Trade Risk Index in net zero emissions scenario: +0.0763
- Share of global critical minerals used for electricity generation: 0.0%
- Share of global critical materials used for electric vehicles: 0.0%
- Share of global gas and coal production: 0.0%
- Share of global oil production: 0.0%
- Total population: 18,077,573
12. Morocco

- Rise in Trade Risk Index in net zero emissions scenario: +0.0866
- Share of global critical minerals used for electricity generation: 0.1%
- Share of global critical materials used for electric vehicles: 0.0%
- Share of global gas and coal production: 0.0%
- Share of global oil production: 0.0%
- Total population: 37,712,505
11. Mauritania
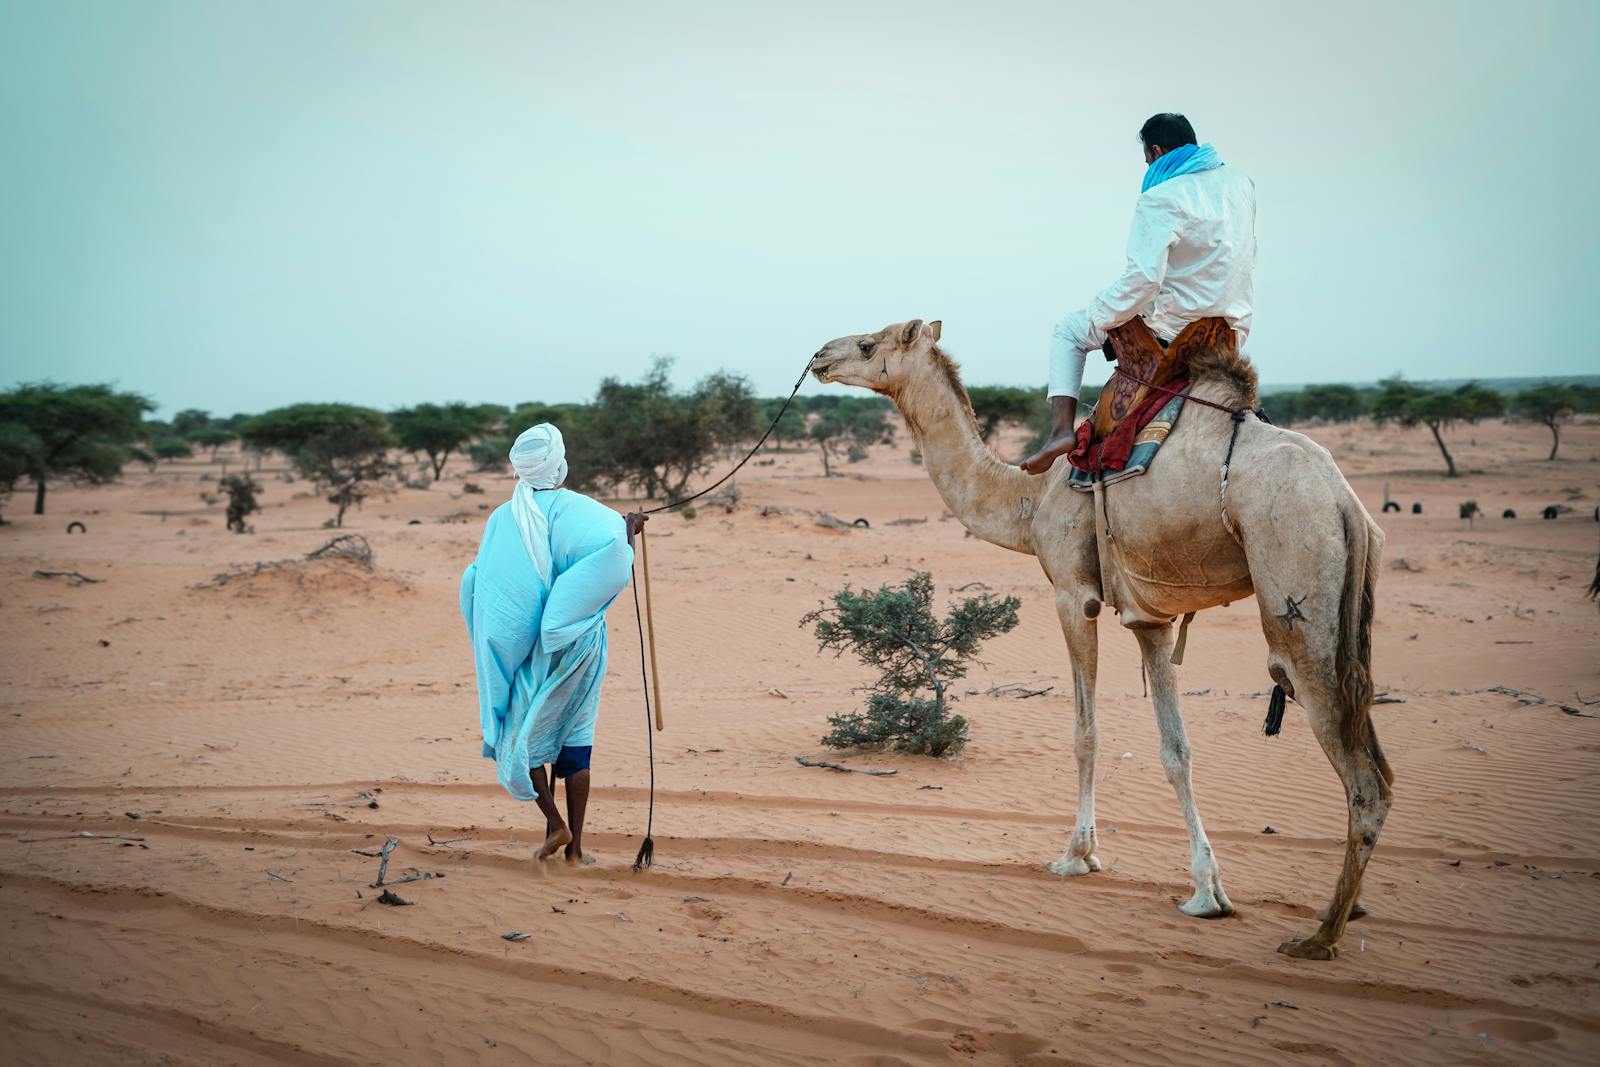
- Rise in Trade Risk Index in net zero emissions scenario: +0.0893
- Share of global critical minerals used for electricity generation: 0.0%
- Share of global critical materials used for electric vehicles: 0.0%
- Share of global gas and coal production: 0.0%
- Share of global oil production: 0.0%
- Total population: 5,022,441
10. Cuba
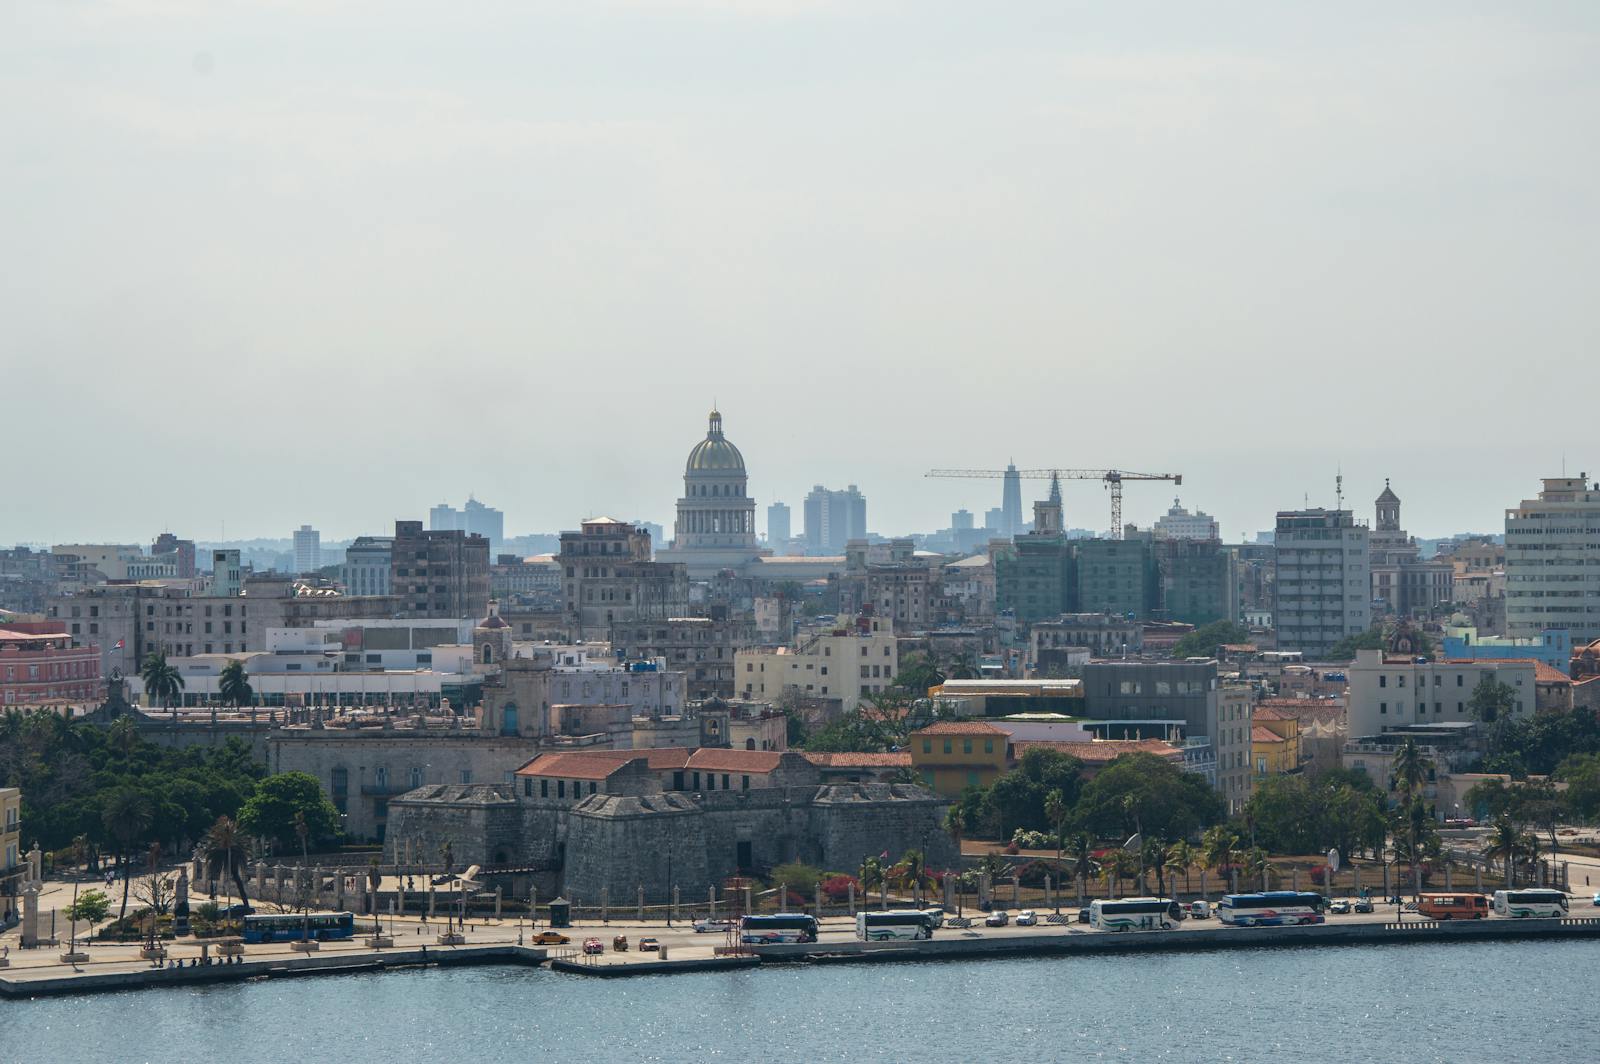
- Rise in Trade Risk Index in net zero emissions scenario: +0.0903
- Share of global critical minerals used for electricity generation: 0.0%
- Share of global critical materials used for electric vehicles: 0.9%
- Share of global gas and coal production: 0.0%
- Share of global oil production: 0.0%
- Total population: 11,019,931
9. Bangladesh
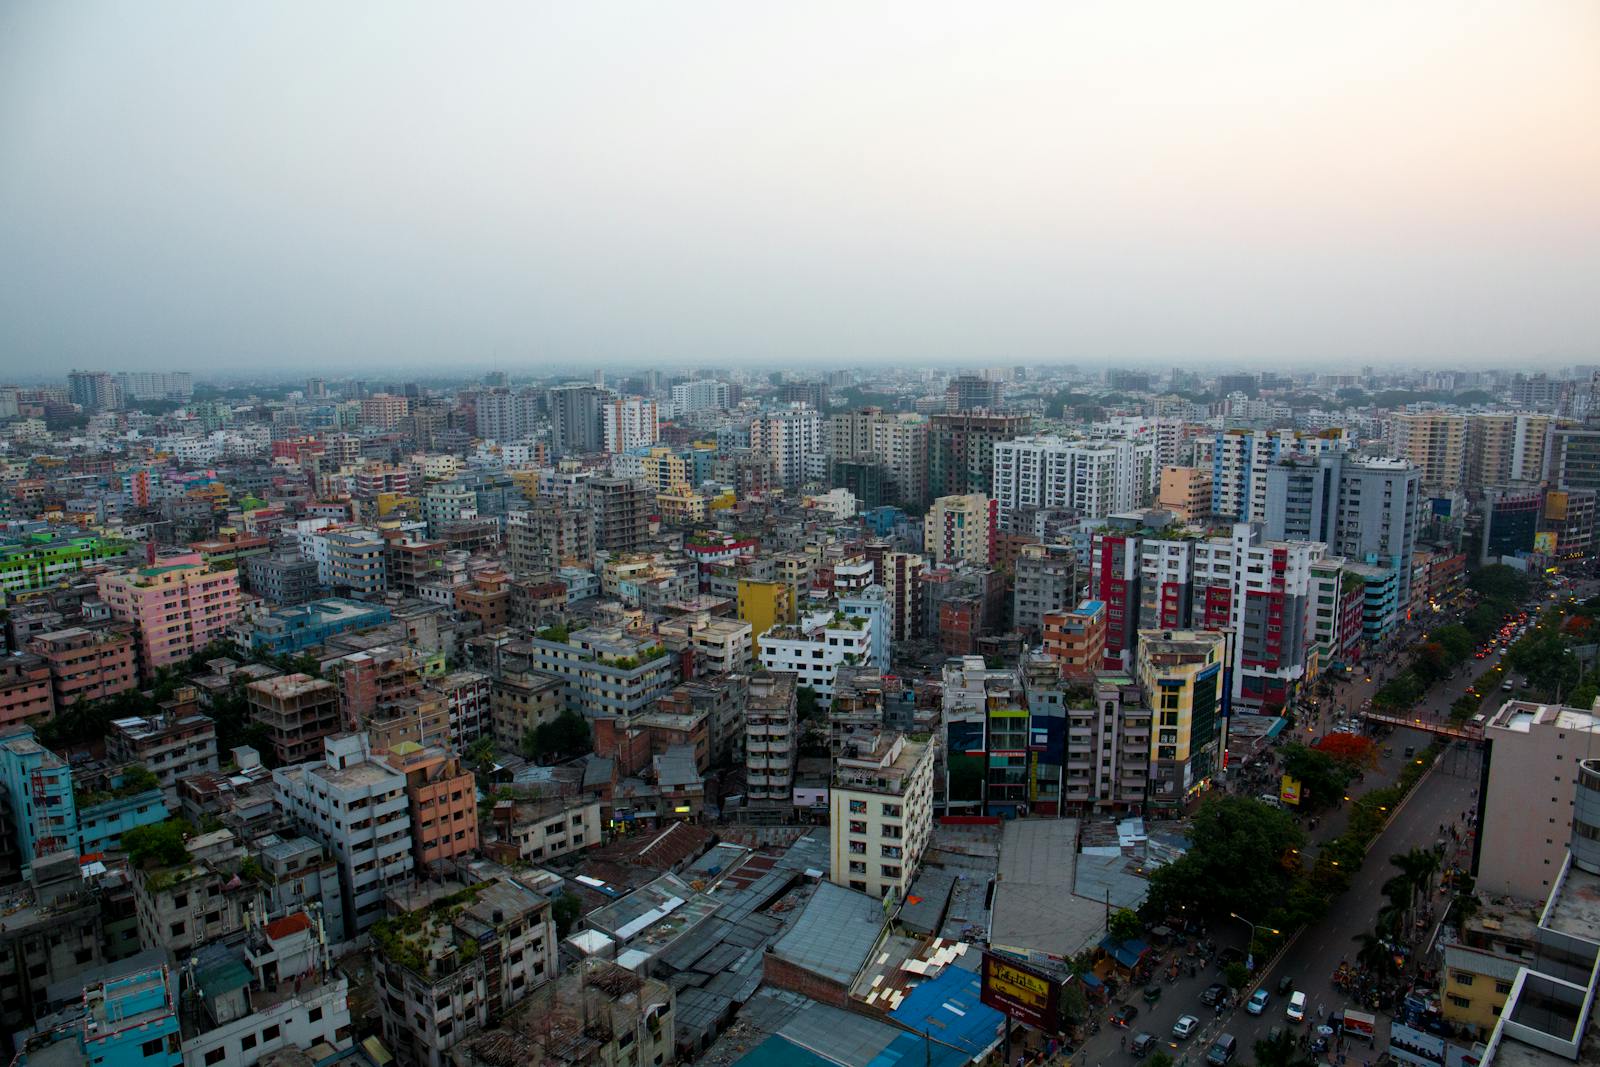
- Rise in Trade Risk Index in net zero emissions scenario: +0.1003
- Share of global critical minerals used for electricity generation: 0.1%
- Share of global critical materials used for electric vehicles: 0.0%
- Share of global gas and coal production: 0.0%
- Share of global oil production: 0.0%
- Total population: 171,466,990
8. Singapore

- Rise in Trade Risk Index in net zero emissions scenario: +0.1007
- Share of global critical minerals used for electricity generation: 0.0%
- Share of global critical materials used for electric vehicles: 0.0%
- Share of global gas and coal production: 0.0%
- Share of global oil production: 0.0%
- Total population: 5,917,648
7. Burkina Faso

- Rise in Trade Risk Index in net zero emissions scenario: +0.1081
- Share of global critical minerals used for electricity generation: 0.0%
- Share of global critical materials used for electric vehicles: 0.0%
- Share of global gas and coal production: 0.0%
- Share of global oil production: 0.0%
- Total population: 23,025,776
6. Iran
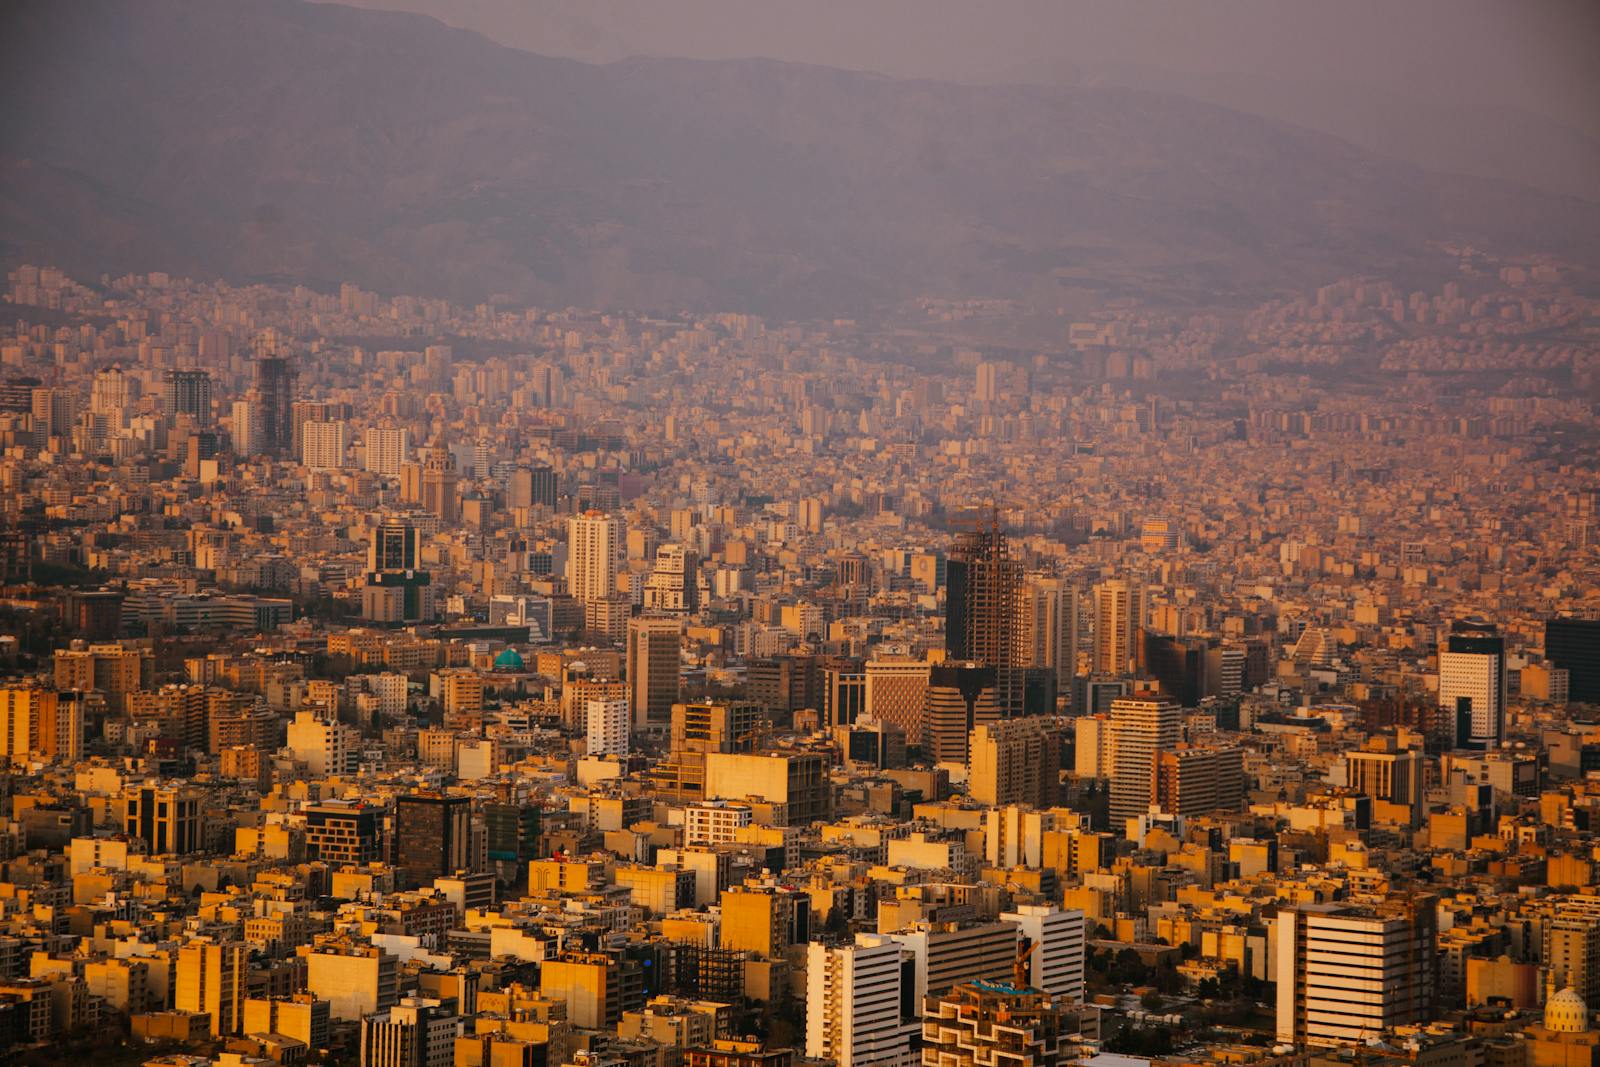
- Rise in Trade Risk Index in net zero emissions scenario: +0.1115
- Share of global critical minerals used for electricity generation: 1.4%
- Share of global critical materials used for electric vehicles: 0.4%
- Share of global gas and coal production: 3.1%
- Share of global oil production: 8.9%
- Total population: 90,608,707
5. Nepal
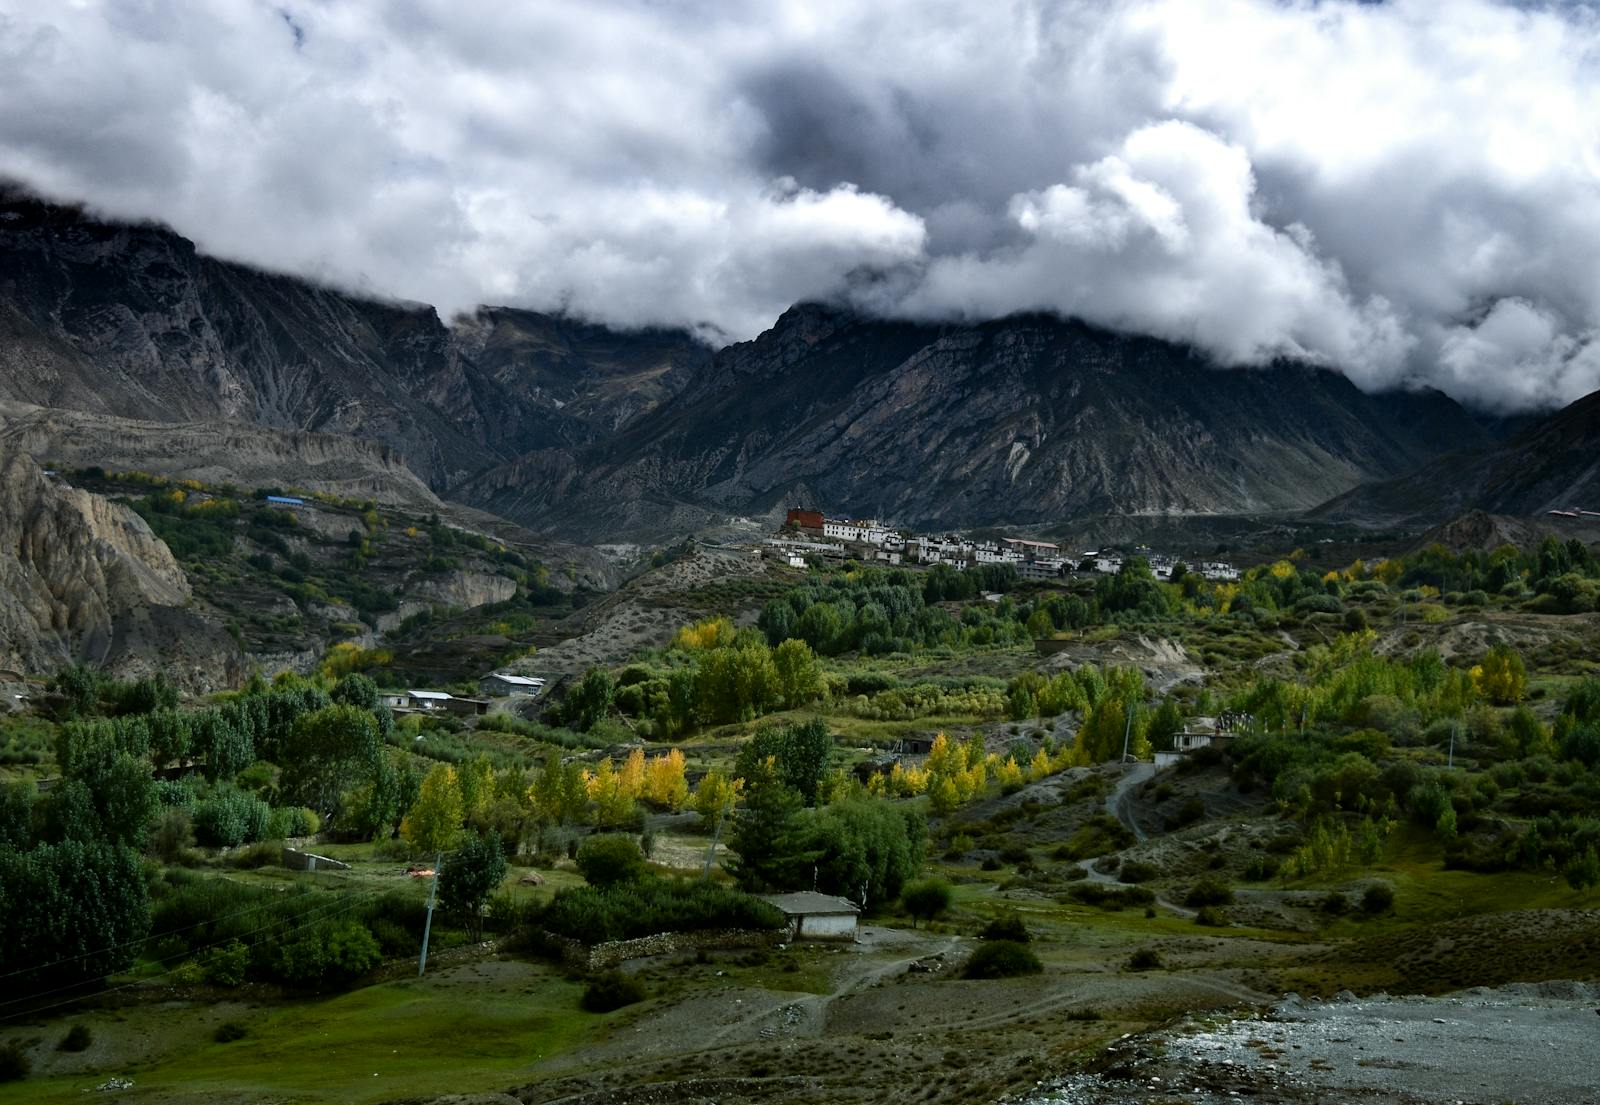
- Rise in Trade Risk Index in net zero emissions scenario: +0.1611
- Share of global critical minerals used for electricity generation: 0.0%
- Share of global critical materials used for electric vehicles: 0.0%
- Share of global gas and coal production: 0.0%
- Share of global oil production: 0.0%
- Total population: 29,694,614
4. Iraq
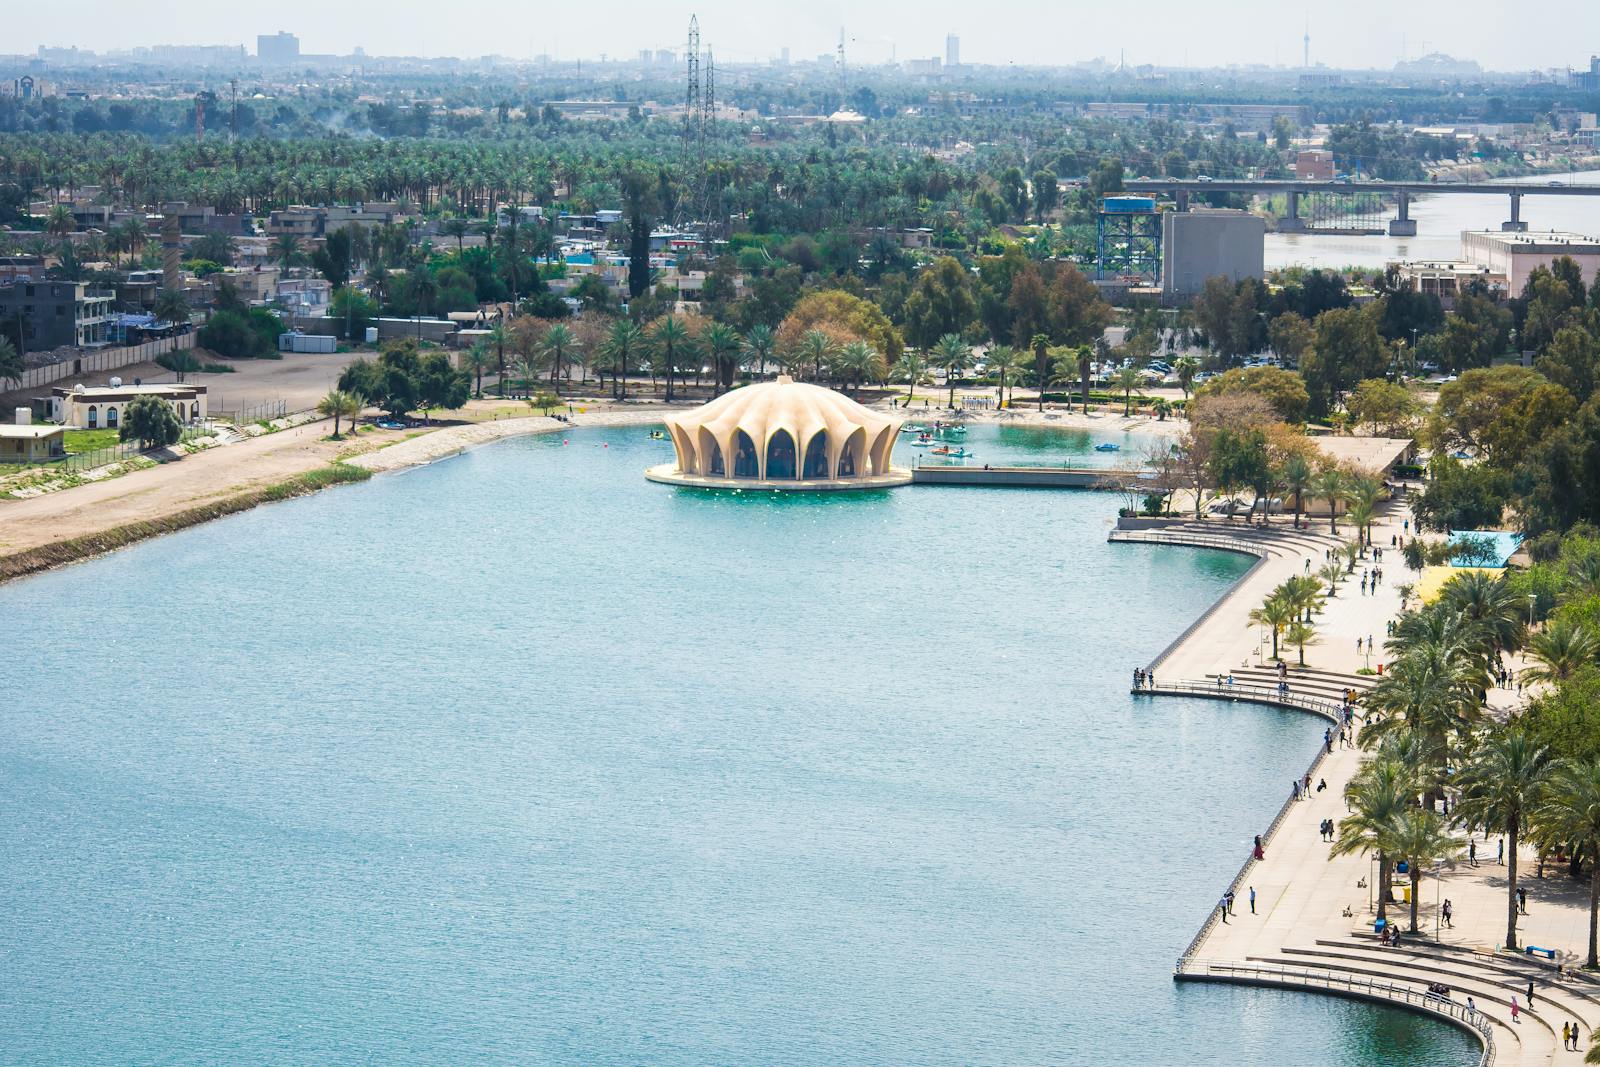
- Rise in Trade Risk Index in net zero emissions scenario: +0.2092
- Share of global critical minerals used for electricity generation: 0.1%
- Share of global critical materials used for electric vehicles: 0.0%
- Share of global gas and coal production: 0.3%
- Share of global oil production: 8.0%
- Total population: 45,074,049
3. Guatemala
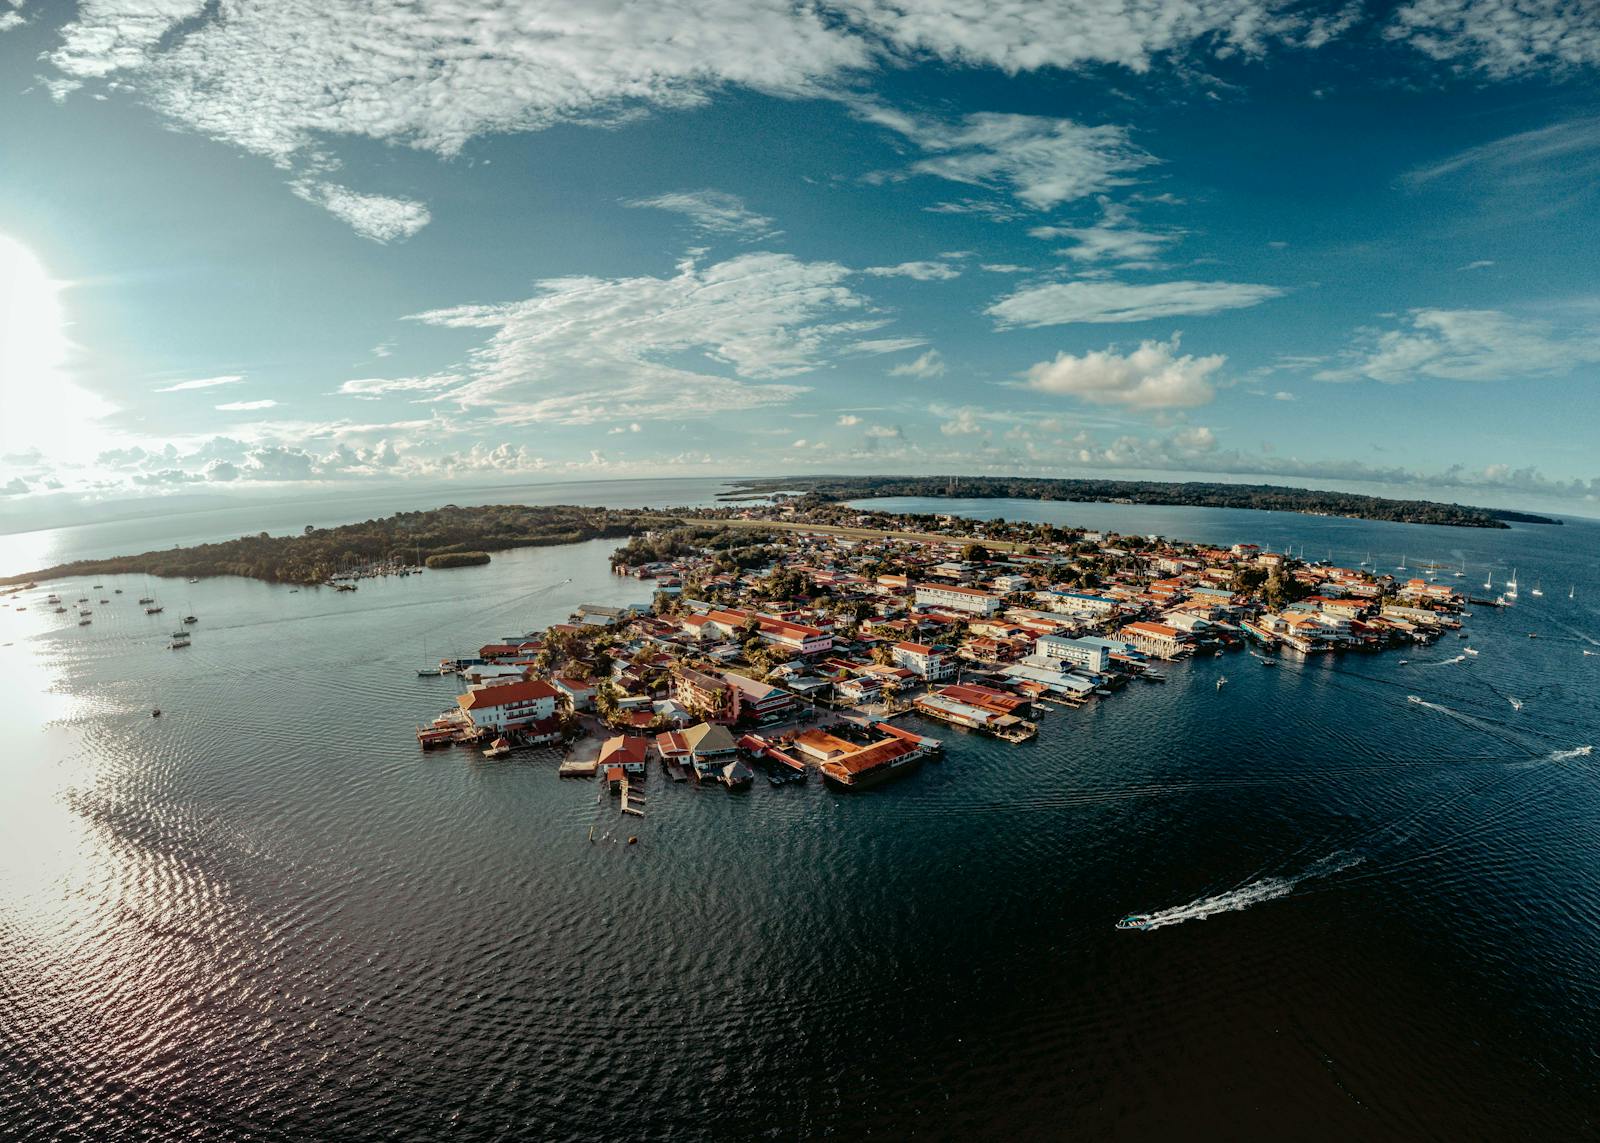
- Rise in Trade Risk Index in net zero emissions scenario: +0.2433
- Share of global critical minerals used for electricity generation: 0.0%
- Share of global critical materials used for electric vehicles: 0.3%
- Share of global gas and coal production: 0.0%
- Share of global oil production: 0.0%
- Total population: 18,124,838
2. Botswana
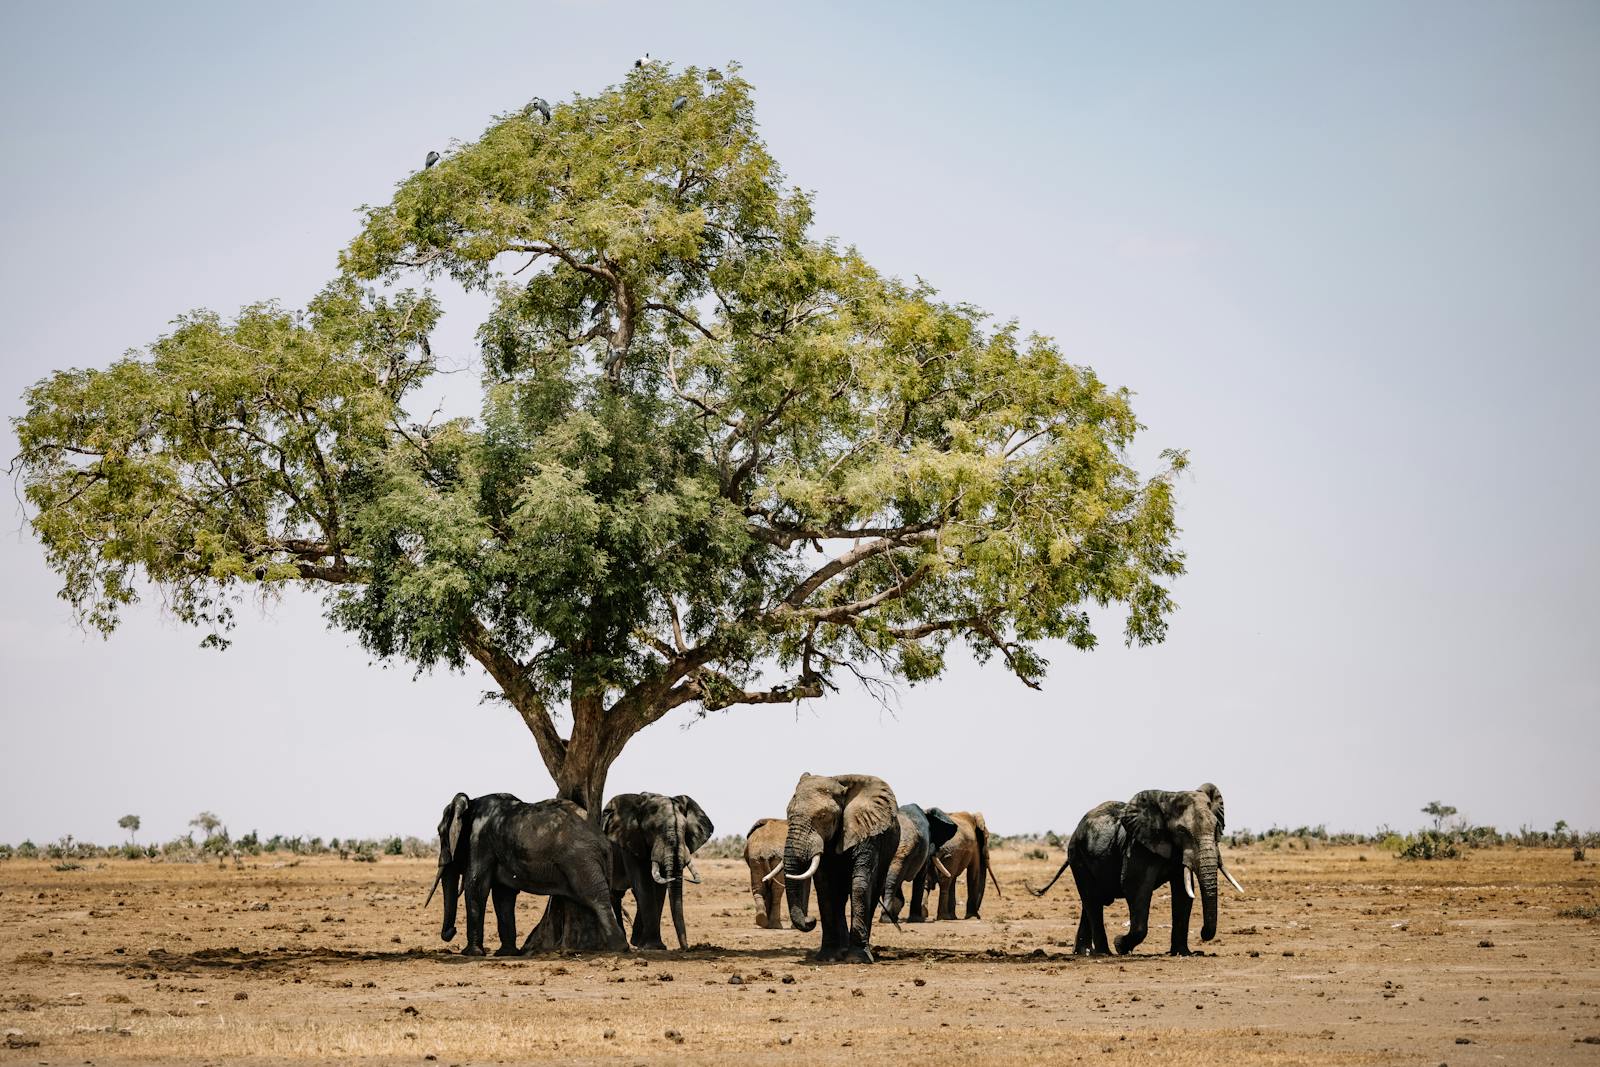
- Rise in Trade Risk Index in net zero emissions scenario: +0.2589
- Share of global critical minerals used for electricity generation: 0.0%
- Share of global critical materials used for electric vehicles: 0.1%
- Share of global gas and coal production: 0.0%
- Share of global oil production: 0.0%
- Total population: 2,480,244
1. Lebanon
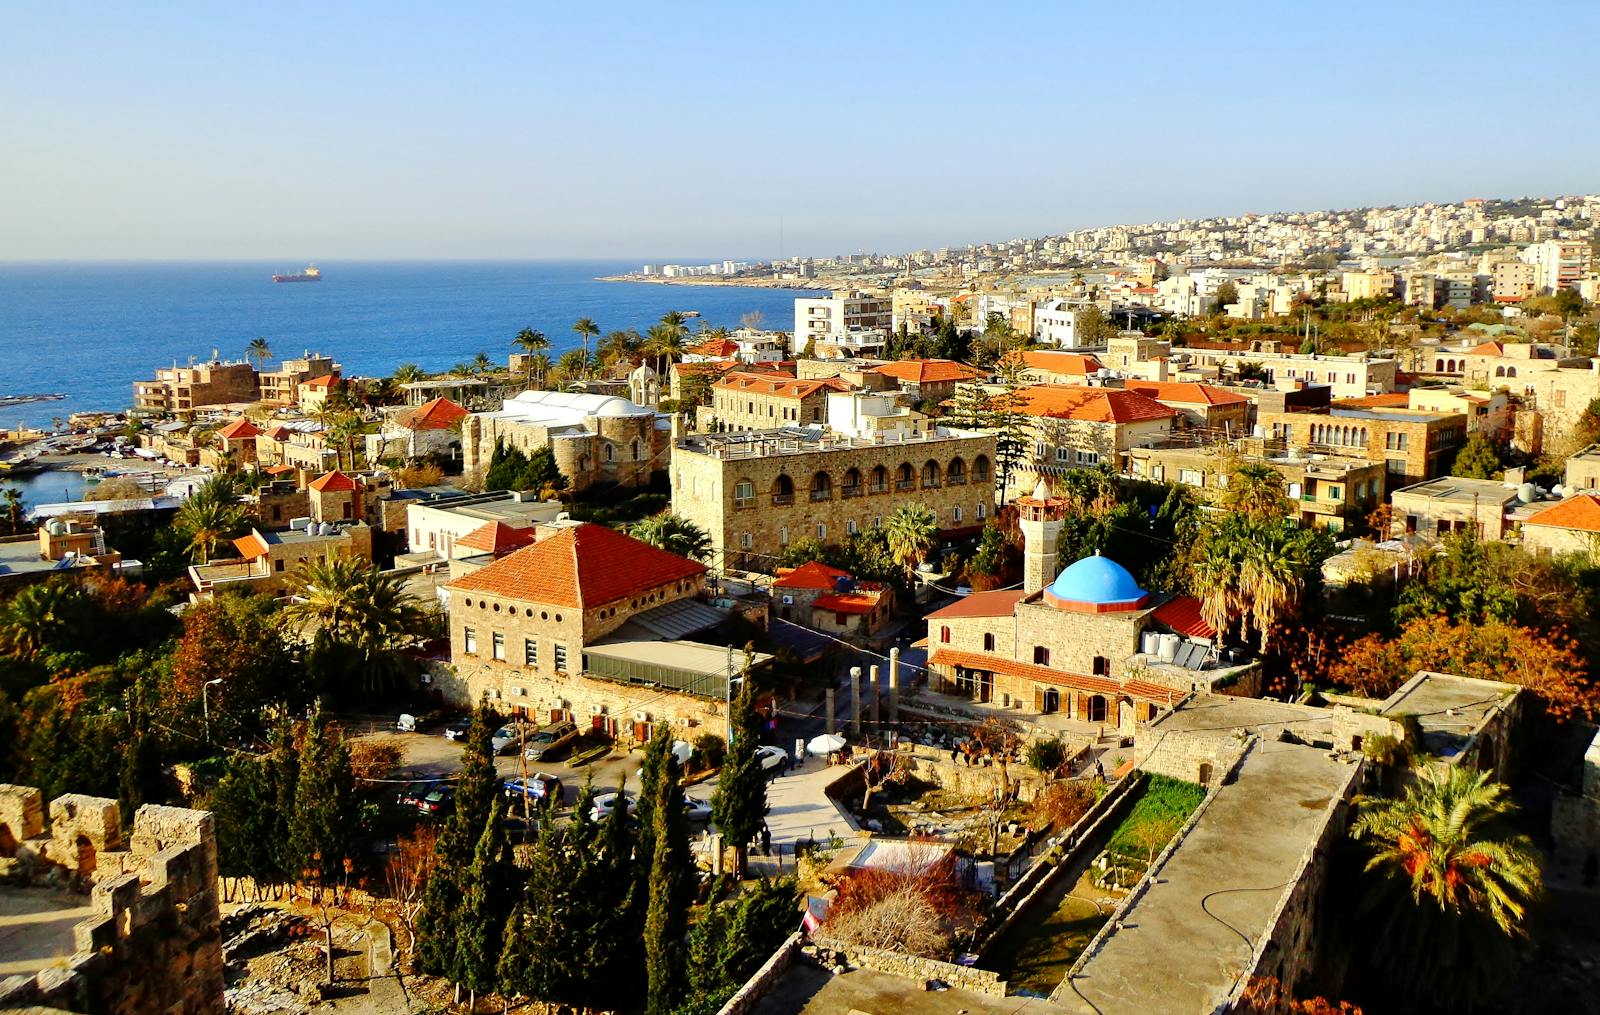
- Rise in Trade Risk Index in net zero emissions scenario: +0.3324
- Share of global critical minerals used for electricity generation: 0.0%
- Share of global critical materials used for electric vehicles: 0.0%
- Share of global gas and coal production: 0.0%
- Share of global oil production: 0.0%
- Total population: 5,773,493