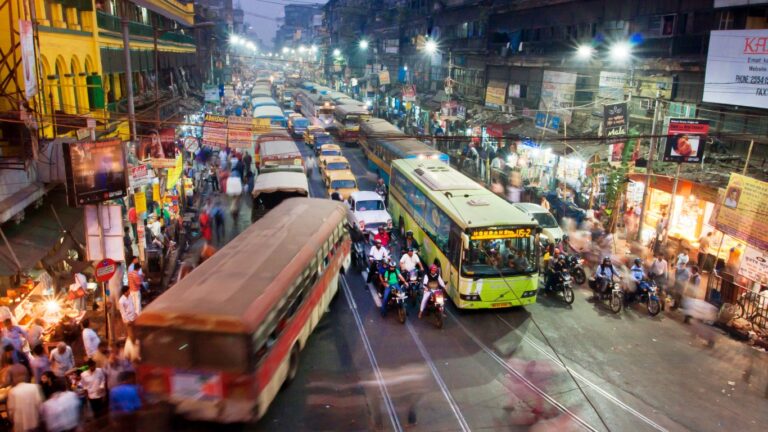
The Driest Places in America This Year
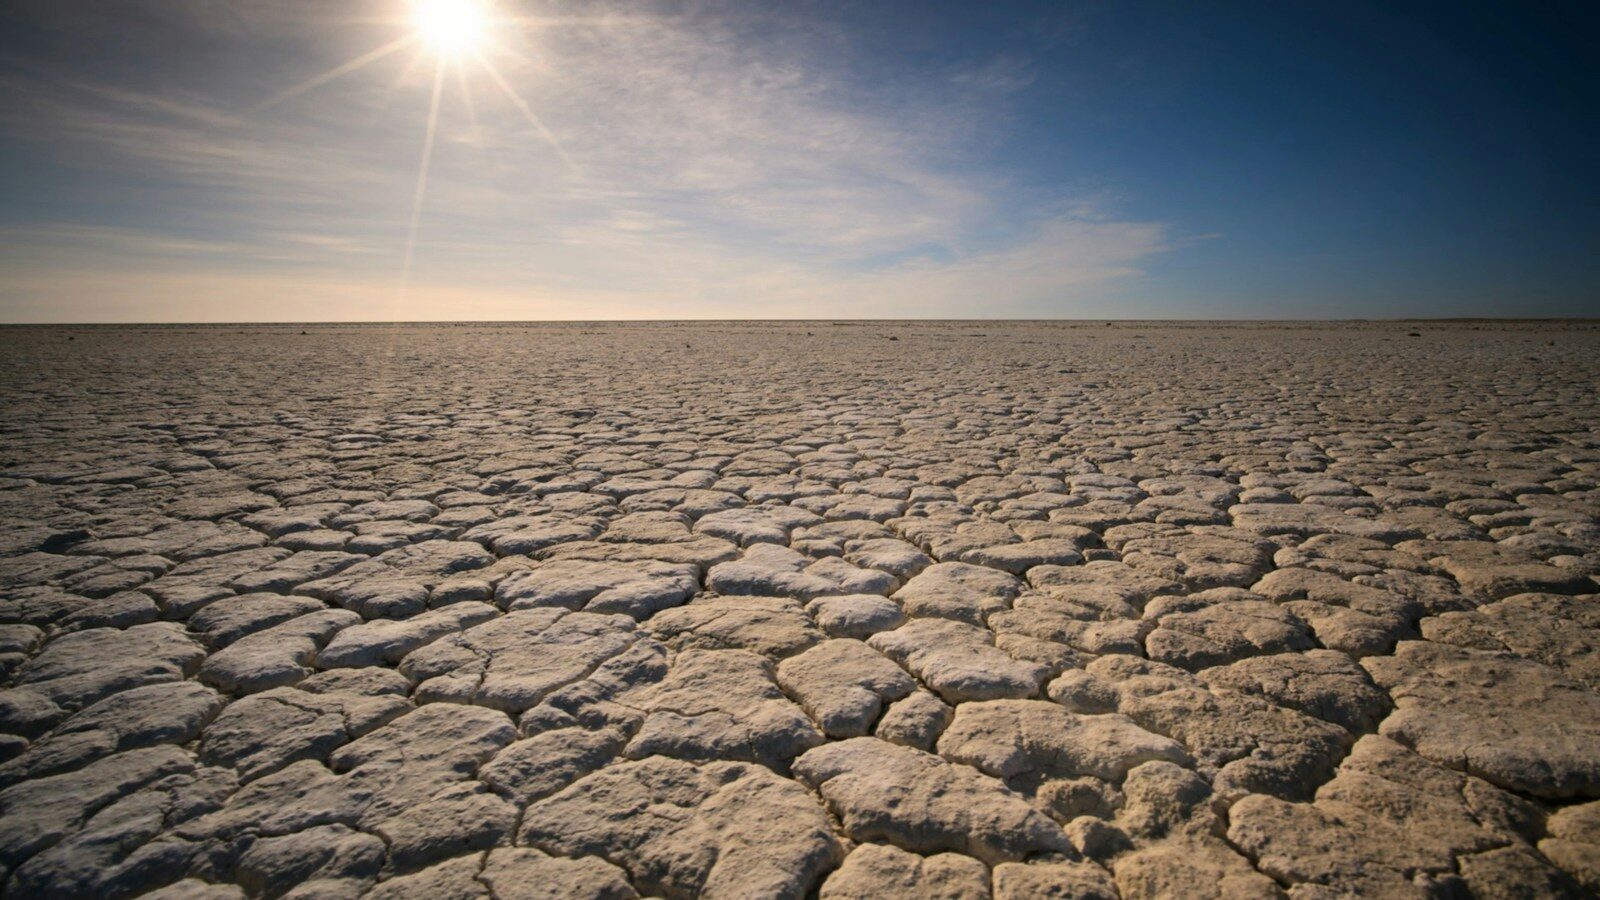
Severe drought persists across much of the US, even as summer ends. The U.S. Drought Monitor shows that extreme drought (a severe dryness event that statistically occurs only 3 to 5 times per 100 years) or exceptional drought (a rare, historic event that occurs roughly once every 50 to 100 years) now covers 17 of the lower 48 states. One of these two levels affects 35% of Colorado and 65% of Arkansas.
When high drought levels last for several weeks, the consequences can be severe: crops die, wildfires become more likely, water levels fall, wind erodes the soil, ecosystems are damaged, and economic losses mount. A May report from the USDA National Agricultural Statistics Service (NASS) rated 44% of this year’s winter wheat as poor to very poor. In Nebraska, the figure was 82%. Other crops have also suffered drought-related problems.
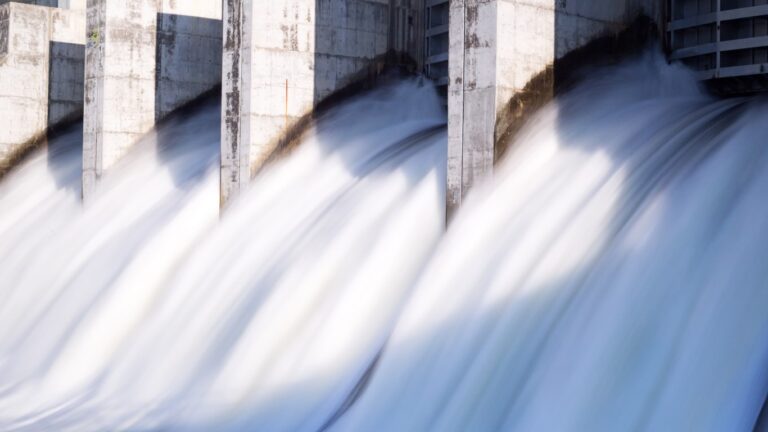
One of the most closely watched drought events in the US is the drop in Lake Mead’s water level and its effect on the Hoover Dam. The ultimate cause is the decline of the Colorado River, which feeds the lake. The State of Nevada recently reported, “Over the last 25 years, the Colorado River has suffered the worst drought in history causing Lake Mead to decline to unprecedented levels.”
After such a long dry period, affected communities might hope for relief, but it may not come. Science News recently reported that the drought in the Southwest is called a “megadrought” because it has lasted for decades and, by some measures, centuries. Researchers cited by Science Digest noted that “Even if people stopped emitting greenhouse gases today, planet-warming carbon dioxide will continue to accumulate in the atmosphere, locking the PDO (Pacific Decadal Oscillation—a recurring, long-term climate pattern in the North Pacific Ocean that cycles through warm (positive) and cool (negative) phases every 20 to 30 years) and megadrought into place, potentially for decades.”
Where Has It Been Driest This Year?
Climate Crisis247 analyzed which places in the US received the least rain from January through September. We used NOAA county-level rainfall statistics for the roughly 3,100 counties in the lower 48 states and compared this year’s figures with the 1991–2020 average for the same locations.
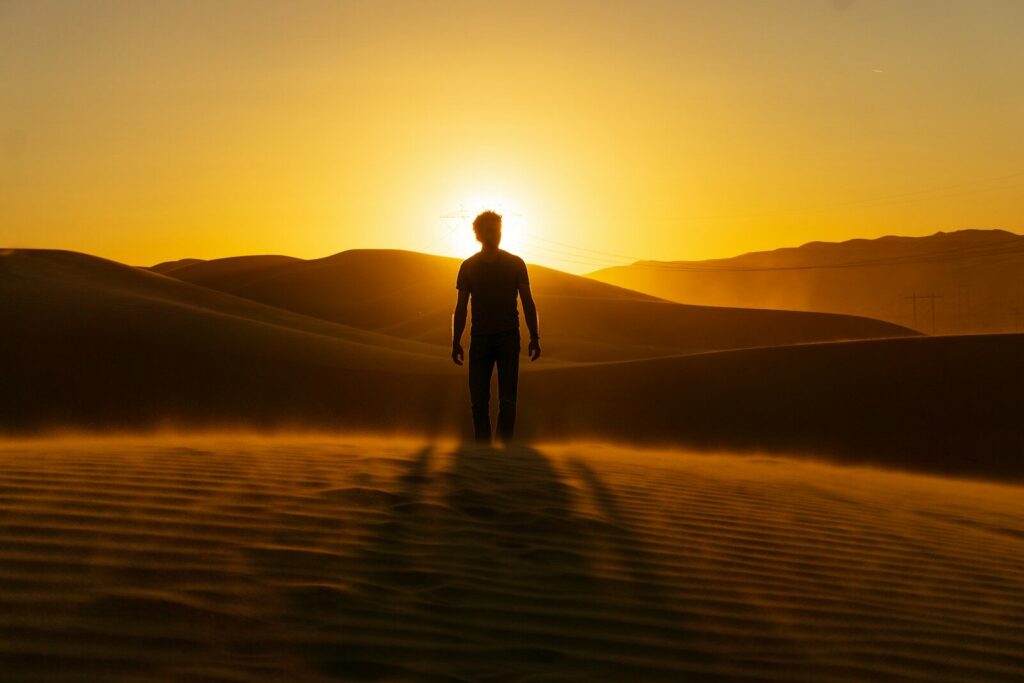
We found that the driest places change little from year to year and are mostly in desert areas. What surprised us was that the driest places became even drier this year. In some cases, rainfall was less than 40% of the baseline average.
Whether or not these data show that parts of the US are drying much faster than expected, there is every reason to worry.
| County | Jan–Sep 2026 | Normal | % of normal |
|---|---|---|---|
| Imperial County, CA | 0.60 in | 2.33 in | 26% |
| Yuma County, AZ | 1.36 in | 3.49 in | 39% |
| La Paz County, AZ | 1.72 in | 4.39 in | 39% |
| Clark County (Las Vegas), NV | 2.03 in | 5.41 in | 38% |
| San Bernardino County, CA | 2.75 in | 4.89 in | 56% |
| Inyo County (Death Valley), CA | 2.77 in | 4.55 in | 61% |
| Riverside County, CA | 2.92 in | 5.96 in | 49% |
| Esmeralda County, NV | 2.93 in | 4.16 in | 70% |
| Kings County, CA | 3.17 in | 5.48 in | 58% |
| Mineral County, NV | 3.31 in | 4.83 in | 69% |
More from ClimateCrisis 247
- The Least Reliable Electric Vehicles, According to Consumer Reports
- At the Wall of Wind, engineers blow homes apart to learn how to save them
- Is coal really making a comeback?
- States With the Deadliest Tornadoes Since 1950