U.S. Counties With The Worst Air Quality
Air quality has improved drastically in the United States in recent decades. According to the EPA, concentrations of many of the most common pollutants – including carbon monoxide, nitrogen dioxide, sulfur dioxide, and ozone – fell by anywhere from 29% to 95% between 1980 and 2024. Such improvements are largely the product of government regulation and represent meaningful achievements in both environmental protection and public health.
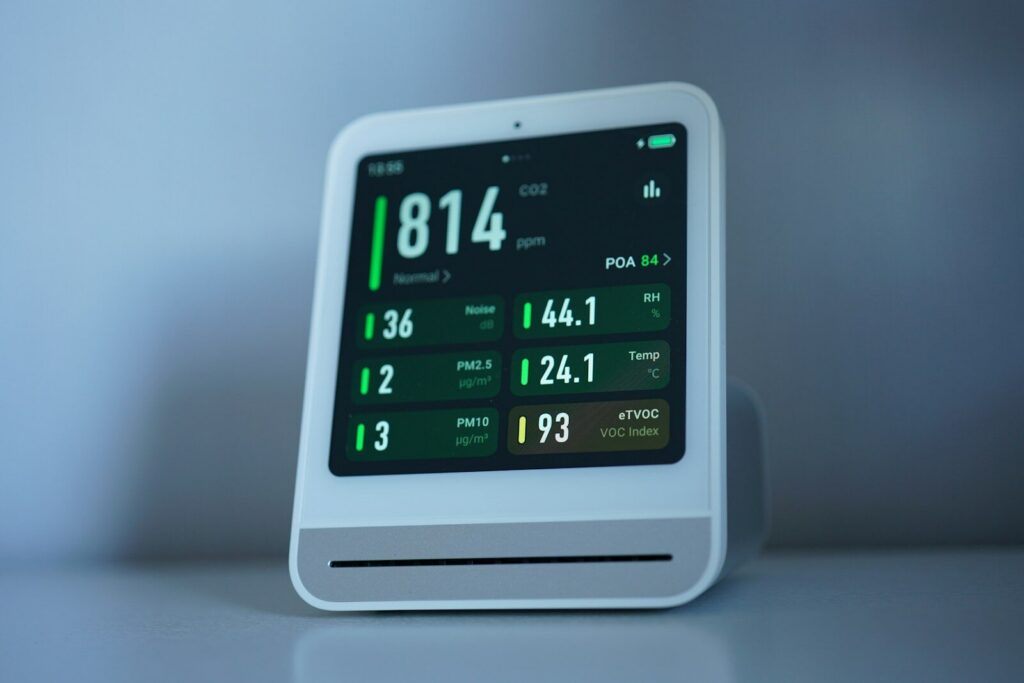
The Air Quality Index, or AQI, is a comprehensive and widely used measure of air pollution that accounts for concentrations of ozone, fine particulate matter, carbon monoxide, and other contaminants the U.S. has successfully reduced in recent decades. Based on historical AQI data, the U.S. has some of the cleanest air of any country in the world on average.
A single composite score, the AQI ranges from 0 to 301 and above. When the AQI is between 0 and 50, air quality is considered good. Between 51 and 100, the AQI indicates moderate risk, and between 101 and 150, air is considered unhealthy for sensitive groups, including young children, older adults, and those with certain heart or lung conditions. Beyond an AQI score of 150, the concentration of pollutants is unhealthy or very unhealthy for the general population, and at 301 or higher, air quality is hazardous. When pollution concentrations reach a certain threshold, even short-term exposure has been linked to serious health risks, including stroke and chronic obstructive pulmonary disease.
While the average AQI in the U.S. was 33 in 2025, there are many places where Americans are regularly exposed to harmful, and even hazardous levels of air pollution.
Using data from the EPA, Climate Crisis 247 identified the U.S. counties with the worst air quality. We ranked over 970 counties and county equivalents with available data on the frequency of days in 2025 when the AQI was either unhealthy, very unhealthy, or hazardous. Unhealthy to hazardous days are represented as a percentage of all days last year with a known AQI. Supplemental data on additional AQI measures are also from the EPA.
Among the 10 counties on this list, the share of days with unhealthy or worse air quality in 2025 ranges from 2.7% to 15.3%. According to the Centers for Disease Control and Prevention, most of these places also have a higher-than-average incidence rate of stroke and COPD. For reference, the age-adjusted incidence rate of stroke and COPD are 2.9% and 3.8%, respectively.
10. Imperial County, California
- Days of unhealthy to hazardous air quality in 2025: 2.7%
- Days of less-than-good air quality in 2025: 72.6%
- Worst measured air quality in 2025: 190 AQI score (Unhealthy for general population)
- Age-adjusted prevalence of COPD in county: 5.4%
- Age-adjusted prevalence of stroke in county: 3.6%
9. Cass County, North Dakota
- Days of unhealthy to hazardous air quality in 2025: 2.9%
- Days of less-than-good air quality in 2025: 26.8%
- Worst measured air quality in 2025: 192 AQI score (Unhealthy for general population)
- Age-adjusted prevalence of COPD in county: 4.7%
- Age-adjusted prevalence of stroke in county: 2.5%
8. Burke County, North Dakota
- Days of unhealthy to hazardous air quality in 2025: 3.3%
- Days of less-than-good air quality in 2025: 27.2%
- Worst measured air quality in 2025: 285 AQI score (Very unhealthy for general population)
- Age-adjusted prevalence of COPD in county: 5.1%
- Age-adjusted prevalence of stroke in county: 2.6%
7. Platte County, Wyoming
- Days of unhealthy to hazardous air quality in 2025: 3.4%
- Days of less-than-good air quality in 2025: 12.3%
- Worst measured air quality in 2025: 406 AQI score (Hazardous)
- Age-adjusted prevalence of COPD in county: 6.6%
- Age-adjusted prevalence of stroke in county: 3.0%
6. Luna County, New Mexico
- Days of unhealthy to hazardous air quality in 2025: 3.4%
- Days of less-than-good air quality in 2025: 20.5%
- Worst measured air quality in 2025: 321 AQI score (Hazardous)
- Age-adjusted prevalence of COPD in county: 7.8%
- Age-adjusted prevalence of stroke in county: 4.2%
5. Dona Ana County, New Mexico
- Days of unhealthy to hazardous air quality in 2025: 8.1%
- Days of less-than-good air quality in 2025: 80.6%
- Worst measured air quality in 2025: 528 AQI score (Hazardous)
- Age-adjusted prevalence of COPD in county: 5.5%
- Age-adjusted prevalence of stroke in county: 3.3%
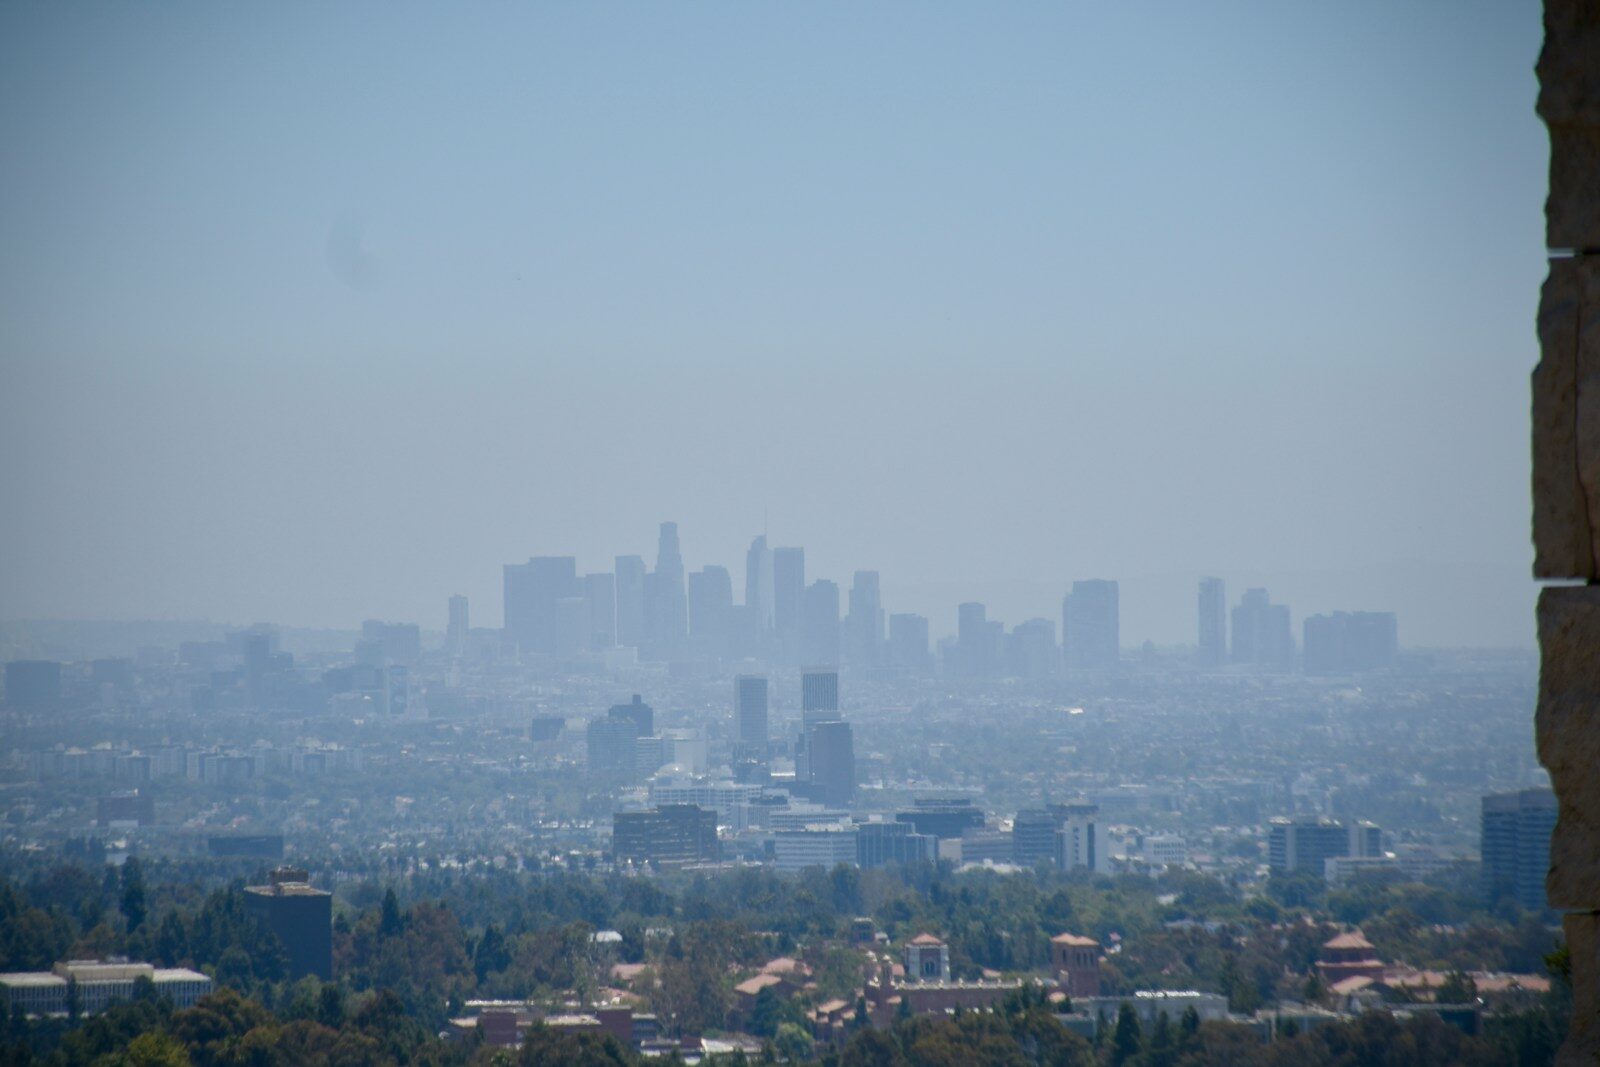
4. Los Angeles County, California
- Days of unhealthy to hazardous air quality in 2025: 10.9%
- Days of less-than-good air quality in 2025: 89.1%
- Worst measured air quality in 2025: 201 AQI score (Very unhealthy for general population)
- Age-adjusted prevalence of COPD in county: 4.5%
- Age-adjusted prevalence of stroke in county: 3.0%
3. Riverside County, California
- Days of unhealthy to hazardous air quality in 2025: 12.0%
- Days of less-than-good air quality in 2025: 89.4%
- Worst measured air quality in 2025: 365 AQI score (Hazardous)
- Age-adjusted prevalence of COPD in county: 4.9%
- Age-adjusted prevalence of stroke in county: 3.0%
2. El Paso County, Texas
- Days of unhealthy to hazardous air quality in 2025: 12.3%
- Days of less-than-good air quality in 2025: 87.3%
- Worst measured air quality in 2025: 500+ AQI score (Hazardous)
- Age-adjusted prevalence of COPD in county: 4.8%
- Age-adjusted prevalence of stroke in county: 3.1%
1. San Bernardino County, California
- Days of unhealthy to hazardous air quality in 2025: 15.3%
- Days of less-than-good air quality in 2025: 87.6%
- Worst measured air quality in 2025: 207 AQI score (Very unhealthy for general population)
- Age-adjusted prevalence of COPD in county: 5.1%
- Age-adjusted prevalence of stroke in county: 3.2%
More from ClimateCrisis 247
- 10 Automakers Losing Big in the EV Market in 2026
- Global Warming Unmakes Winter in the US West
- Places In The US Where People Don’t Have Electricity
- The States Where Electricity Rates Will Double In Ten Years


