
US Cities With Dangerous Coastal Flooding Due to Climate Change
Sea level rise is one of the most predictable—and potentially destructive—consequences of climate change. As heat-trapping greenhouse gasses continue to accumulate in Earth’s atmosphere, increasing global temperatures are causing glaciers and ice sheets to melt at an unprecedented rate, releasing billions of tons of water into the world’s oceans each year. Along much of the U.S. coastline, sea levels are now over half a foot higher than they were in the early 20th century. And by the end of the 21st century, sea-level rise will be measured in feet, not inches.
Absent rapid and substantial cuts to greenhouse gas emissions, or hundreds of billions of dollars in spending on sea wall infrastructure, many coastal communities may become uninhabitable in the coming decades. Already, major U.S. cities along the Atlantic, Pacific, or Gulf coast are grappling with coastal flooding on a regular basis. In many of these places, nearly all instances of flooding in the last decade would not have occurred if not for climate change.
Using data from Climate Central, a non-profit research and advocacy group, Climate Crisis 247 identified the coastal cities becoming uninhabitable due to climate change. We ranked all cities with available data on the average number of coastal flooding days per year between 2016 and 2025. We only considered cities where at least 85% of flooding days were due to climate change. Supplemental data on historical and projected sea-level rise are from the Coastal Risk Finder. Sea-level rise projections assume current commitments to emissions reductions.
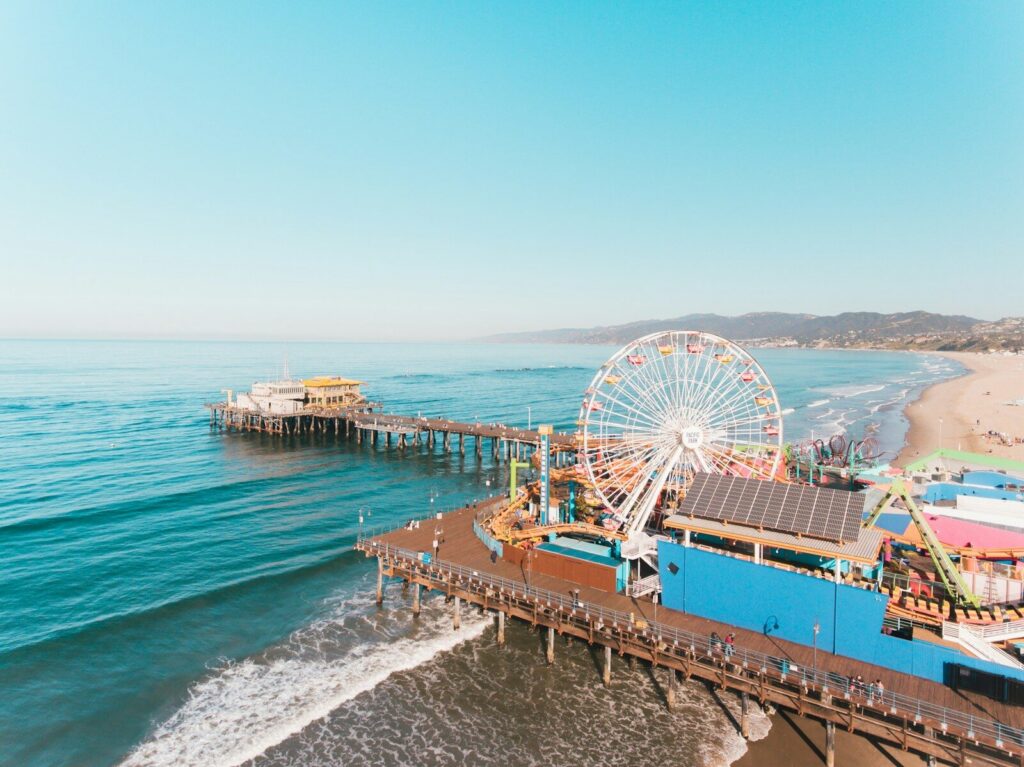
10. Santa Monica, California
- Number of days with coastal flooding, 2016-2025: 10.5 per year on average (105 total)
- Coastal flooding days due to human-caused climate change: 98%
- Worst year for coastal flooding since 1975: 2018; 18 flood days (all 18 days due to climate change)
- Local sea level rise since 1975: 3.4 inches
- Projected sea level rise by 2100: 1.5 feet
9. North Spit, California
- Number of days with coastal flooding, 2016-2025: 10.6 per year on average (106 total)
- Coastal flooding days due to human-caused climate change: 86%
- Worst year for coastal flooding since 1979: 2023; 16 flood days (15 days due to climate change)
- Local sea level rise since 1979: 3 inches
- Projected sea level rise by 2100: 1.8 feet
8. Port Canaveral, Florida
- Number of days with coastal flooding, 2016-2025: 11.3 per year on average (113 total)
- Coastal flooding days due to human-caused climate change: 87%
- Worst year for coastal flooding since 1995: 2023; 21 flood days (all 21 days due to climate change)
- Local sea level rise since 1995: 2.7 inches
- Projected sea level rise by 2100: 2.3 feet
7. Los Angeles, California
- Number of days with coastal flooding, 2016-2025: 15.2 per year on average (152 total)
- Coastal flooding days due to human-caused climate change: 95%
- Worst year for coastal flooding since 1924: 2022; 24 flood days (all 24 days due to climate change)
- Local sea level rise since 1924: 5.8 inches
- Projected sea level rise by 2100: 1.5 feet
6. San Francisco, California
- Number of days with coastal flooding, 2016-2025: 15.9 per year on average (159 total)
- Coastal flooding days due to human-caused climate change: 92%
- Worst year for coastal flooding since 1900: 2023; 35 flood days (34 days due to climate change)
- Local sea level rise since 1900: 6.1 inches
- Projected sea level rise by 2100: 1.7 feet
5. Virginia Key, Florida
- Number of days with coastal flooding, 2016-2025: 22.3 per year on average (223 total)
- Coastal flooding days due to human-caused climate change: 90%
- Worst year for coastal flooding since 1995: 2019; 47 flood days (43 days due to climate change)
- Local sea level rise since 1995: 2.8 inches
- Projected sea level rise by 2100: 2.3 feet
4. Key West, Florida
- Number of days with coastal flooding, 2016-2025: 24.3 per year on average (243 total)
- Coastal flooding days due to human-caused climate change: 97%
- Worst year for coastal flooding since 1914: 2022; 45 flood days (44 days due to climate change)
- Local sea level rise since 1914: 6.4 inches
- Projected sea level rise by 2100: 2.3 feet
3. Vaca Key, Florida
- Number of days with coastal flooding, 2016-2025: 26.6 per year on average (266 total)
- Coastal flooding days due to human-caused climate change: 96%
- Worst year for coastal flooding since 1977: 2019; 47 flood days (all 47 days due to climate change)
- Local sea level rise since 1977: 3.5 inches
- Projected sea level rise by 2100: 2.4 feet
2. Hilo, Hawaii
- Number of days with coastal flooding, 2016-2025: 38.9 per year on average (389 total)
- Coastal flooding days due to human-caused climate change: 98%
- Worst year for coastal flooding since 1928: 2020; 76 flood days (73 days due to climate change)
- Local sea level rise since 1928: 6.5 inches
- Projected sea level rise by 2100: 2.5 feet
1. Kahului, Hawaii
- Number of days with coastal flooding, 2016-2025: 44.6 per year on average (446 total)
- Coastal flooding days due to human-caused climate change: 100%
- Worst year for coastal flooding since 1954: 2020; 84 flood days (83 days due to climate change)
- Local sea level rise since 1954: 4.9 inches
- Projected sea level rise by 2100: 2.3 feet
More from ClimateCrisis 247
- States With the Deadliest Tornadoes Since 1950
- The Driest Places in America This Year
- Due to Low Sales, These Are The EVs That Disappeared This Year
- Coldest Games in NFL History





