
The Worst Years For US Wildfires In The 21st Century
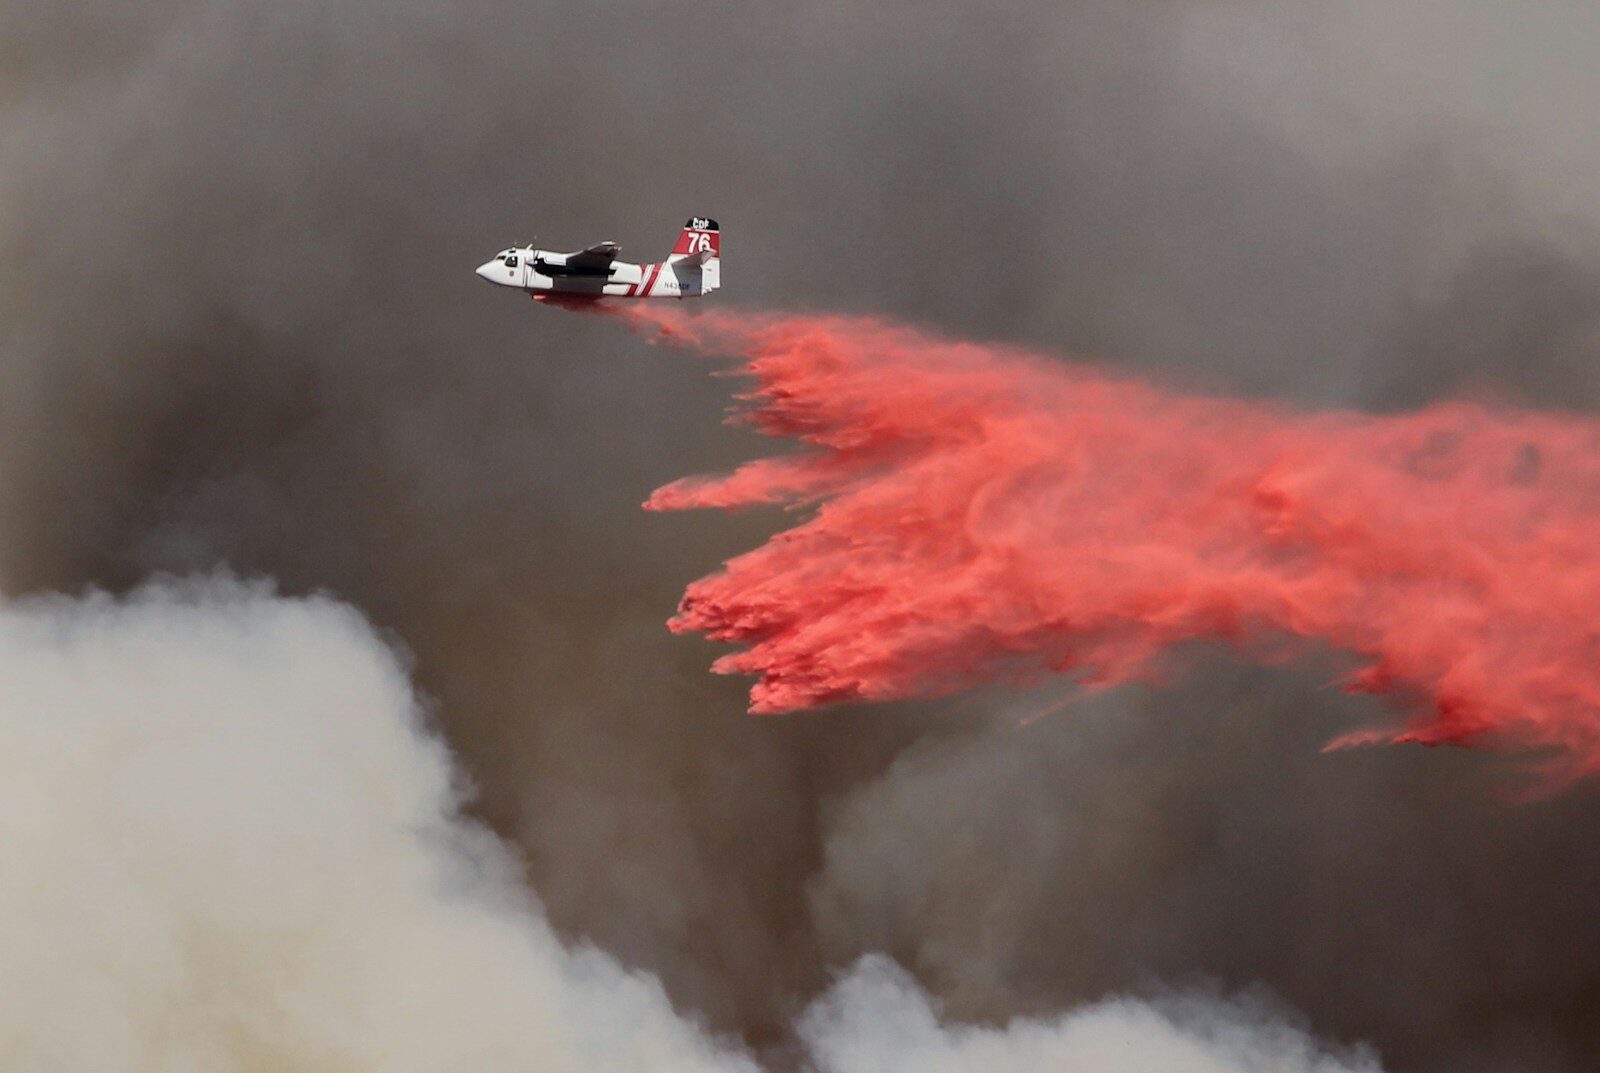
As wildfires burn across Europe, Mappr reports that the JRC/EFFIS tracker shows 628,000 acres burned so far. That official figure hasn’t been updated in two days, so the true total is likely much higher. Evacuation numbers underscore the scale of the crisis: an estimated 400,000 people have been displaced, though because each nation reports its own figures, no single hard number exists. With extreme heat and high winds continuing, the burned-acreage total is likely to keep climbing — and there’s a real chance it could top one million acres.
While this year’s European wildfires will certainly set a record, the total acreage burned still falls far short of what the US experiences in a typical year. Based on data from 2000 to 2025, US wildfires burn an average of five million acres annually.
For most of this century, large US wildfires haven’t threatened major population centers the way the current fires are threatening Europe. Madrid, metropolitan population of which is about six million, is under threat today.
The only recent case of a major wildfire threatening a major US city came in January 2025, when fires in and around Los Angeles burned 16,000 structures and consumed 57,000 acres. According to the Columbia Climate School, an estimated 440 people died as a result — 31 from direct contact with the fires, and the rest from heart and lung conditions worsened by smoke and stress, or from breakdowns in health care and mental health care systems. More than 200,000 people were evacuated.
The National Interagency Fire Center tracks US wildfires by acres burned and number of fires per year. So far, 2026 is on pace to be one of the worst years on record: year to date, there have been 42,651 fires burning a combined 4,510,189 acres — both the highest totals for this point in the year since 2016.
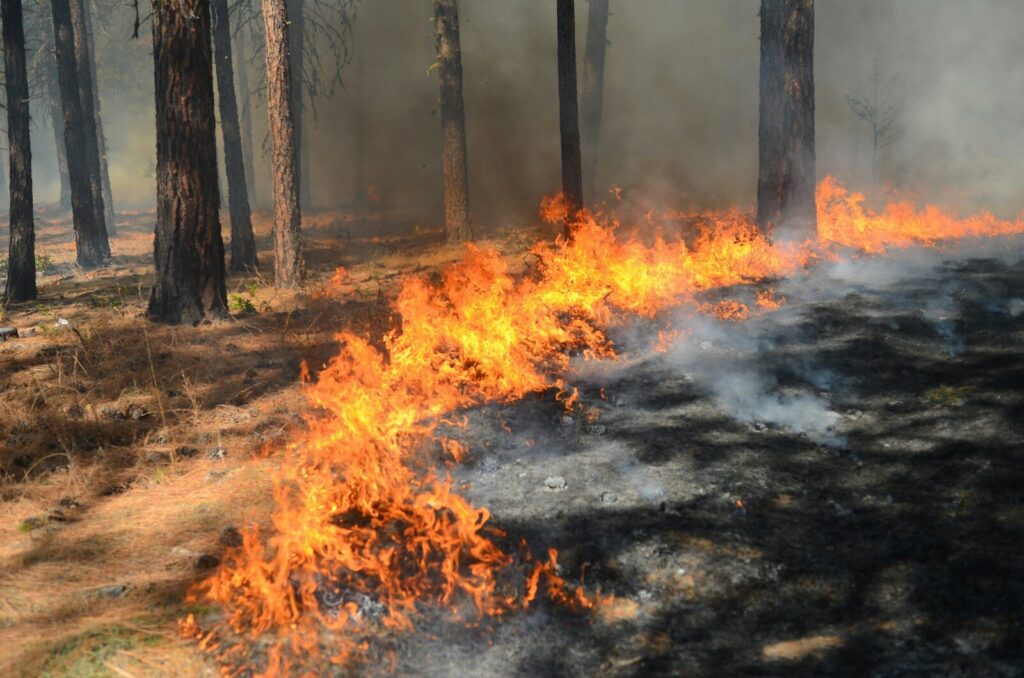
Since 2000, the most destructive US wildfire years by acreage have been 2015 and 2017, each with just over 10 million acres burned. The years with the highest number of individual fires, by contrast, were 2000 and 2006 — early in the century. Given the effects of global warming, it’s somewhat counterintuitive that the years with the most fires occurred so early on.
Climatecrisis247 measured drought severity across the US by year using the U.S. Drought Monitor, applying a methodology drawn from an established source. Index scores from 2000 to 2025 ranged from a high of 151 in 2022 to a low of 44 in 2010. The model is based on what’s known as the Drought Severity and Coverage Index (DSCI).
The DSCI condenses drought conditions into a single score from 0 to 500. Rather than tracking the five drought categories separately — from “abnormally dry” (D0) to “exceptional drought” (D4) — it applies a weighted calculation: the percentage of land in each category is multiplied by that category’s severity level, producing one unified score, where 0 means no drought and 500 means exceptional drought conditions everywhere. Because the index is calculated weekly, it’s a useful tool for comparing drought trends across weeks, seasons, or years.
The years 2006 and 2000 had relatively high drought scores, but since they weren’t the highest on record, high national drought levels alone can’t explain the large number of acres burned in those years. One complicating factor is that a single extremely large fire can skew a year’s total acreage — for example, the East Amarillo Complex fires in Texas in 2006 alone burned just over 900,000 acres.
The start of 2026 has been extremely hazardous in both the US and Europe: US wildfire activity is running at a record pace, and the fires in Europe are the worst in modern history.
| Rank | Year | Fires | Acres | Avg DSCI |
|---|---|---|---|---|
| 1 | 2006 | 96,385 | 9,873,745 | 93.8 |
| 2 | 2000 | 92,250 | 7,393,493 | 79.4 |
| 3 | 2007 | 85,705 | 9,328,045 | 103.2 |
| 4 | 2001 | 84,079 | 3,570,911 | 76.7 |
| 5 | 2008 | 78,979 | 5,292,468 | 77.9 |
| 6 | 2009 | 78,792 | 5,921,786 | 54.6 |
| 7 | 2025 | 77,850 | 5,131,474 | 105.1 |
| 8 | 2011 | 74,126 | 8,711,367 | 91.2 |
| 9 | 2002 | 73,457 | 7,184,712 | 128.9 |
| 10 | 2010 | 71,971 | 3,422,724 | 44.4 |
| 11 | 2017 | 71,499 | 10,026,086 | 45.2 |
| 12 | 2022 | 68,988 | 7,577,183 | 150.7 |
| 13 | 2015 | 68,151 | 10,125,149 | 93.9 |
| 14 | 2012 | 67,774 | 9,326,238 | 141.4 |
| 15 | 2016 | 67,743 | 5,509,995 | 63.8 |
| 16 | 2005 | 66,753 | 8,689,389 | 69.2 |
| 17 | 2004 | 65,461 | 8,097,880 | 104.0 |
| 18 | 2024 | 64,897 | 8,924,884 | 79.1 |
| 19 | 2003 | 63,629 | 3,960,842 | 129.4 |
| 20 | 2014 | 63,312 | 3,595,613 | 98.7 |
| 21 | 2021 | 58,985 | 7,125,643 | 146.7 |
| 22 | 2020 | 58,950 | 10,122,336 | 82.6 |
| 23 | 2018 | 58,083 | 8,767,492 | 85.6 |
| 24 | 2023 | 56,580 | 2,693,910 | 93.4 |
| 25 | 2019 | 50,477 | 4,664,364 | 35.8 |
| 26 | 2013 | 47,579 | 4,319,546 | 133.7 |
More from ClimateCrisis 247
- Wildfire Smoke SpreadsTo Detroit And New York
- 9,000 Americans Have Died From The Heat This Year
- 110 Days When It’s 100 Degrees in Phoenix
- This Country Will Be Underwater, 600,000 people Will Leave





