States That Are Leading America’s Energy Independence
The closure of the Strait of Hormuz amid the ongoing war in Iran has sent shockwaves through the global economy. The Strait is a key shipping route for approximately 20% of the world’s oil supply, and in the months since the war began, Brent crude oil futures have been fluctuating around $100 per barrel, up from less than $60 at the beginning of the year. Around the world, the supply squeeze has sent fuel prices soaring, triggering petroleum shortages and rationing, reduced industrial output, and broader inflationary pressure.
The crisis in the Persian Gulf has been especially challenging for countries in Asia. According to the Energy Information Administration, Asian markets import an estimated 84% of their crude oil supply from tankers that pass through the Strait of Hormuz. Under normal circumstances, major economies including India, Japan, and South Korea, import tens of billions of dollars of oil from the Gulf. Notably, however, the U.S. has been largely spared from the worst effects of the Strait’s closure.
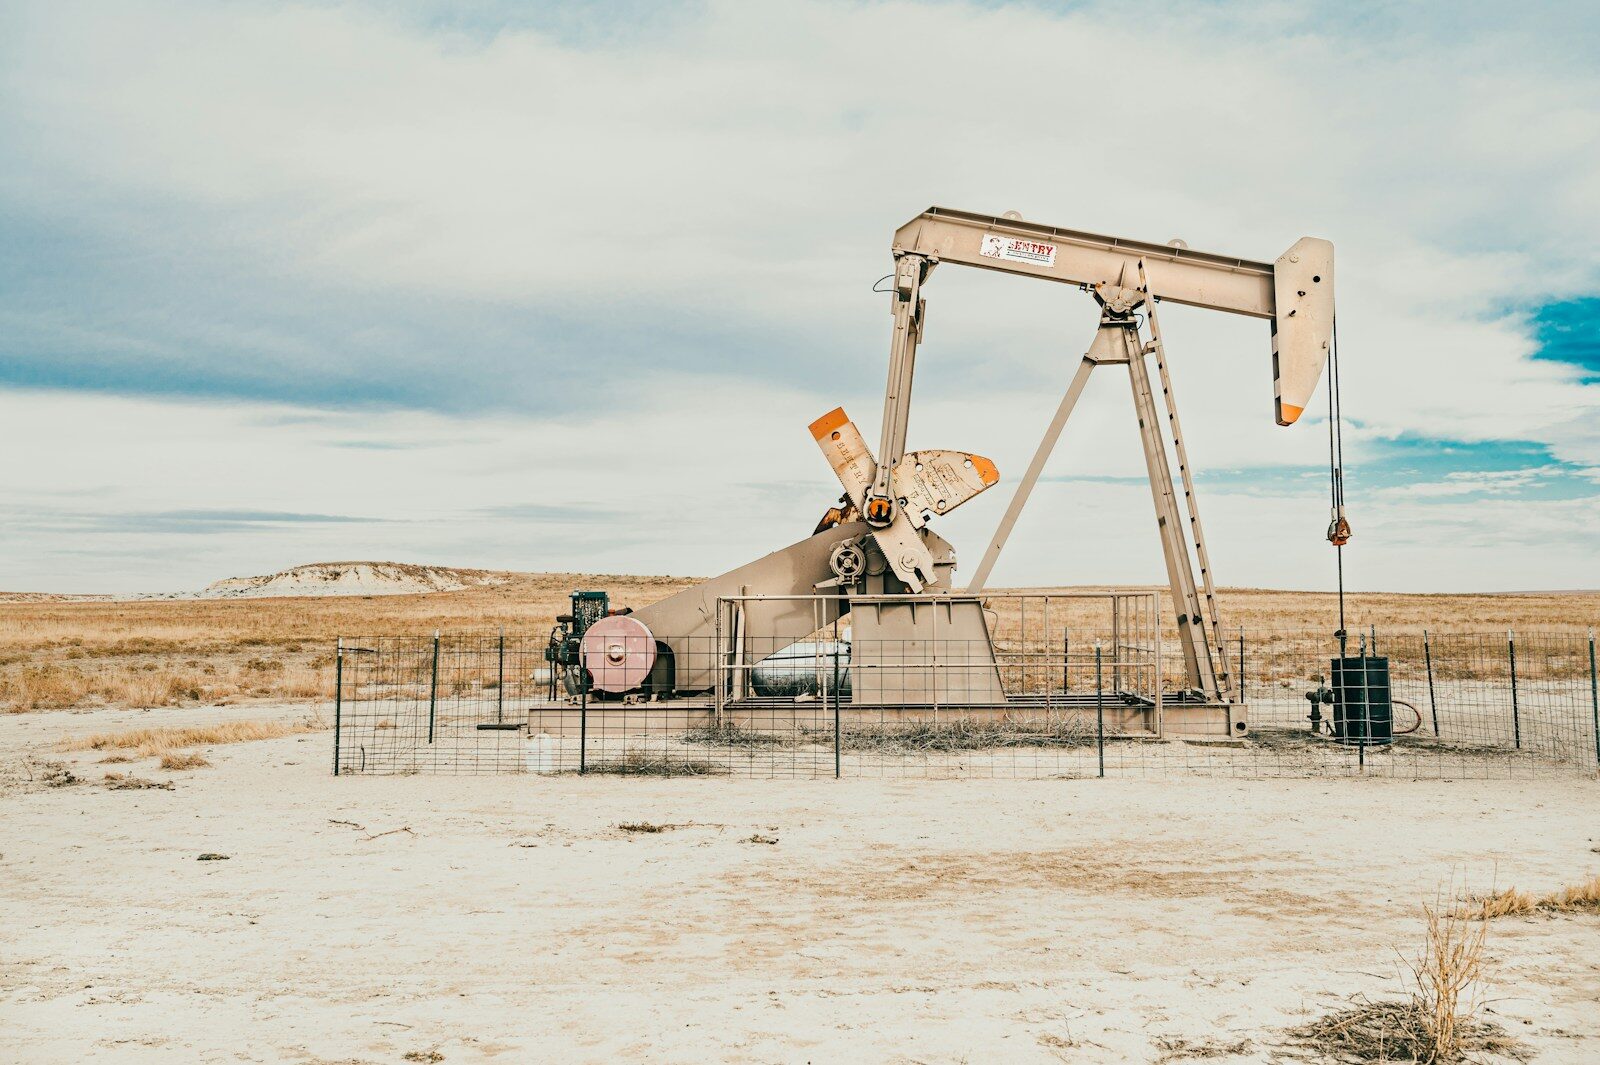
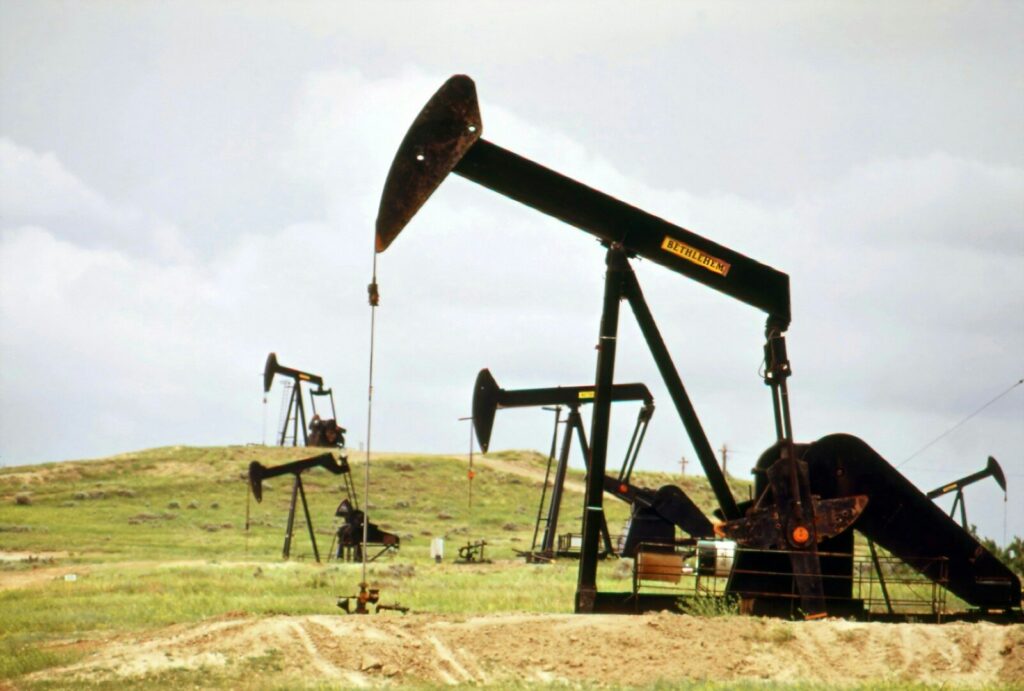
Between 2001 and 2025, U.S. oil imports from the Persian Gulf fell from more than 1 billion barrels to less than 250 million. The shift, which reduced American exposure to instability in the region, was largely due to recent developments in fracking technology that allowed companies to extract previously inaccessible subterranean oil. New extraction techniques were widely deployed throughout the 2010s, and by the end of the decade, the U.S. produced more energy than it consumed and had emerged as the world’s leading oil producer, overtaking Russia and Saudi Arabia.
American crude oil production hit a 21st century low of 5 million barrels per day in 2008. By 2019, the first year of energy independence, domestic oil production hit an all time high of over 12.3 million barrels per day. Production has continued to rise in the years since, and in 2025, daily oil production hit a new record-high of nearly 13.6 million barrels. The sharp increase necessary to achieve energy independence has been driven by a handful of states employing new horizontal drilling and hydraulic fracturing techniques.
Using data from the EIA, Climate Crisis 247 identified the states that made American energy independence possible. We ranked all oil producing states on the nominal change in output between 2008, the lowest oil production year in the 21st century, and 2019, the first year of U.S. energy independence. All supplemental data is also from the EIA.
10. Pennsylvania
- Change in crude oil production, 2008-2019: +3.1 million barrels (+104.0%)
- Total crude oil production in 2008: 3.0 million barrels
- Total crude oil production in 2019: 6.1 million barrels
- Total crude oil production last year: 4.0 million barrels
- Notable oil fields/regions in state include: Bradford Oil Field (first discovered/drilled in 1871)
9. Utah
- Change in crude oil production, 2008-2019: +14.9 million barrels (+67.6%)
- Total crude oil production in 2008: 22.0 million barrels
- Total crude oil production in 2019: 36.9 million barrels
- Total crude oil production last year: 67.7 million barrels
- Notable oil fields/regions in state include: Monument Butte Oil Field (first discovered/drilled in 1964)
8. West Virginia
- Change in crude oil production, 2008-2019: +15.1 million barrels (+711.7%)
- Total crude oil production in 2008: 2.1 million barrels
- Total crude oil production in 2019: 17.3 million barrels
- Total crude oil production last year: 15.0 million barrels
- Notable oil fields/regions in state include: Marcellus Shale Region (first discovered/drilled in 2002)
7. Ohio
- Change in crude oil production, 2008-2019: +22.9 million barrels (+449.6%)
- Total crude oil production in 2008: 5.1 million barrels
- Total crude oil production in 2019: 28.0 million barrels
- Total crude oil production last year: 50.8 million barrels
- Notable oil fields/regions in state include: Utica/Point Pleasant Shale Play (first discovered/drilled in 2011)
6. Wyoming
- Change in crude oil production, 2008-2019: +49.1 million barrels (+92.6%)
- Total crude oil production in 2008: 53.0 million barrels
- Total crude oil production in 2019: 102.2 million barrels
- Total crude oil production last year: 105.6 million barrels
- Notable oil fields/regions in state include: Pinedale Oil Field (first discovered/drilled in 1955)
5. Oklahoma
- Change in crude oil production, 2008-2019: +149.6 million barrels (+222.3%)
- Total crude oil production in 2008: 67.3 million barrels
- Total crude oil production in 2019: 216.9 million barrels
- Total crude oil production last year: 147.9 million barrels
- Notable oil fields/regions in state include: Sho-Vel-Tum Oil Field (first discovered/drilled in 1905)
4. Colorado
- Change in crude oil production, 2008-2019: +162.3 million barrels (+541.9%)
- Total crude oil production in 2008: 29.9 million barrels
- Total crude oil production in 2019: 192.2 million barrels
- Total crude oil production last year: 170.5 million barrels
- Notable oil fields/regions in state include: Wattenberg Oil Field (first discovered/drilled in 1970)
3. New Mexico
- Change in crude oil production, 2008-2019: +276.8 million barrels (+460.2%)
- Total crude oil production in 2008: 60.2 million barrels
- Total crude oil production in 2019: 337.0 million barrels
- Total crude oil production last year: 819.2 million barrels
- Notable oil fields/regions in state include: Empire Oil Field (first discovered/drilled in 1945)
2. North Dakota
- Change in crude oil production, 2008-2019: +455.4 million barrels (+730.6%)
- Total crude oil production in 2008: 62.3 million barrels
- Total crude oil production in 2019: 517.7 million barrels
- Total crude oil production last year: 421.1 million barrels
- Notable oil fields/regions in state include: Siverston Oil Field (first discovered/drilled in 2006)
1. Texas
- Change in crude oil production, 2008-2019: +1.5 billion barrels (+359.4%)
- Total crude oil production in 2008: 405.9 million barrels
- Total crude oil production in 2019: 1.9 billion barrels
- Total crude oil production last year: 2.1 billion barrels
- Notable oil fields/regions in state include: Eagleville (Eagle Ford Formation) Oil Field (first discovered/drilled in 2009)
Sponsor
Find a Vetted Financial Advisor
- Finding a fiduciary financial advisor doesn't have to be hard. SmartAsset's free tool matches you with up to 3 financial advisors that serve your area in 5 minutes.
- Each advisor has been vetted by SmartAsset and is held to a fiduciary standard to act in your best interests. Get on the path toward achieving your financial goals!
More from ClimateCrisis 247
- Drone Delivery Drives Down Pollution
- The world is about to have too much oil
- Wildfires Race Across The West As Three Firefighters Die
- The Air Conditioning War With Data Centers


