
These Major US Cities Threatened By Dangerous Coastal Flooding in The Coming Years
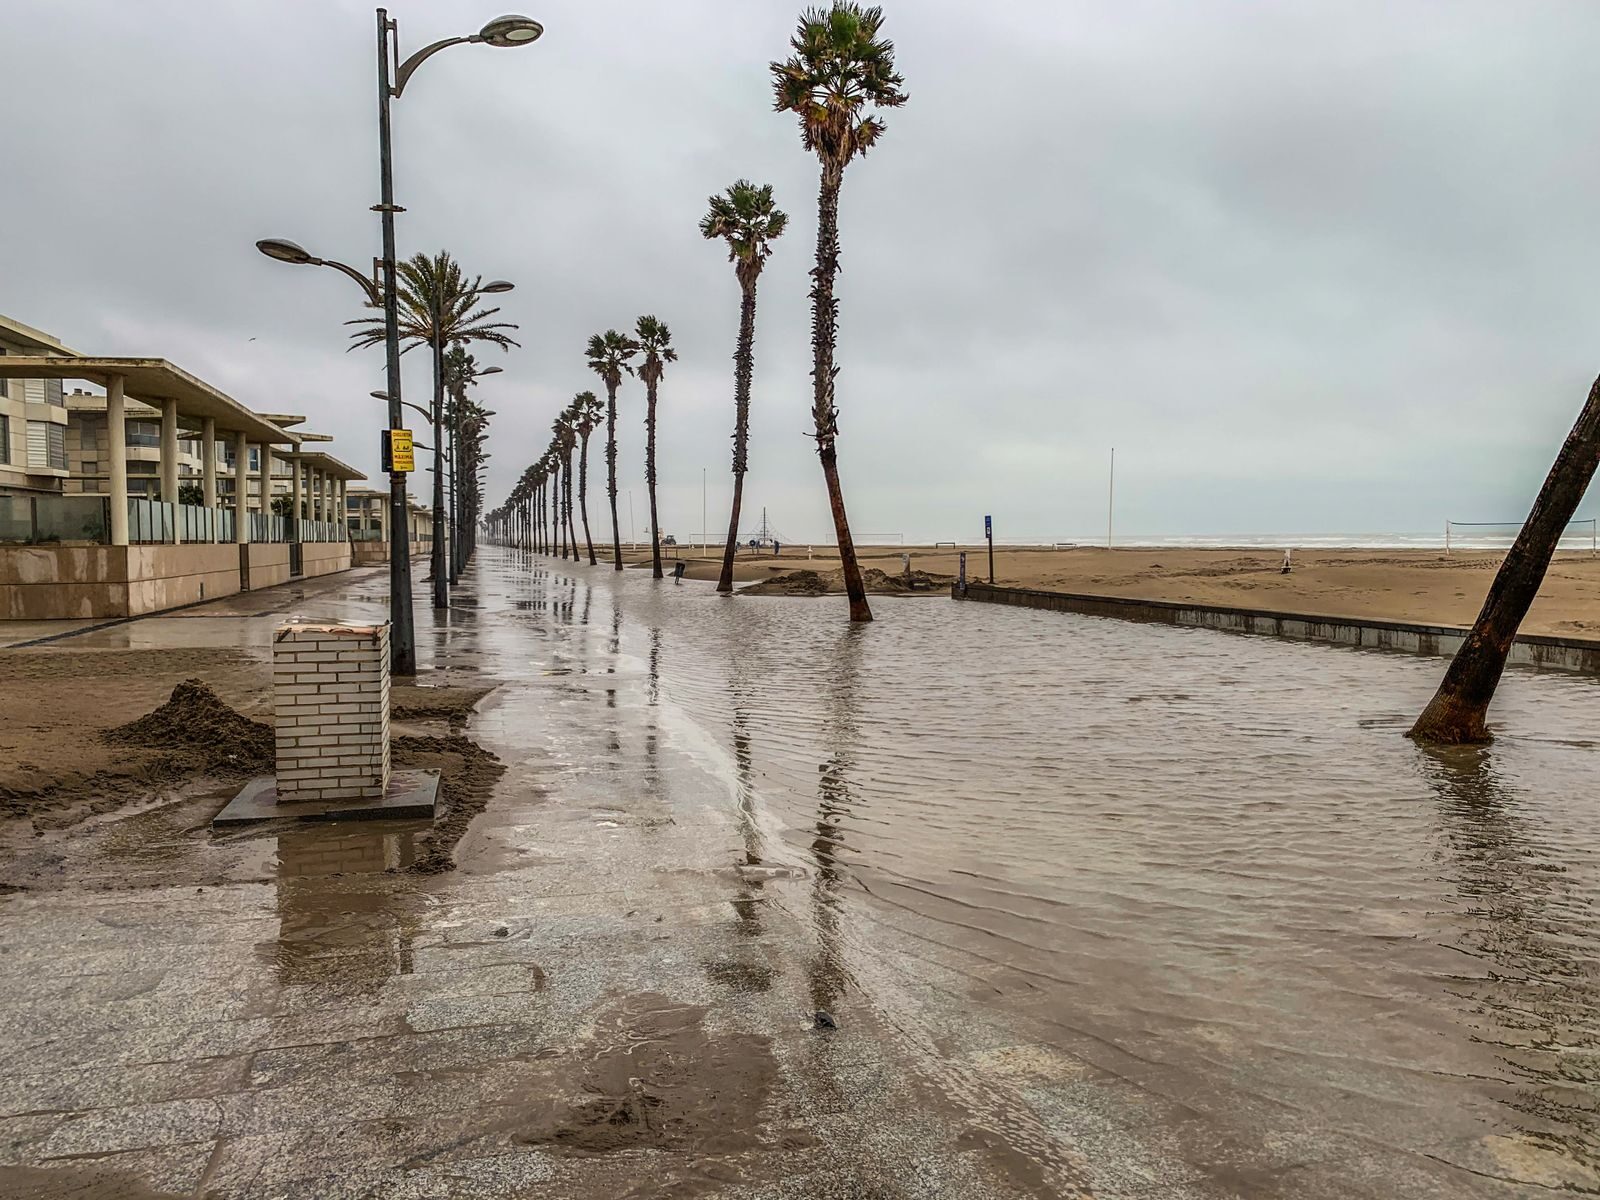
The climate change phenomenon was well established in certain corners of the scientific community decades before it received widespread public awareness. Partially as a result, earnest international cooperation to reduce global greenhouse gas emissions are relatively recent developments – and those efforts appear to have been too little too late.
The Earth’s climate is now warming at an unprecedented rate, largely due to carbon emissions from fossil fuels. The ocean absorbs about 90% of this added heat, which causes water to expand, glaciers to melt, and sea levels to rise. Exactly how much the world’s oceans will rise by the end of this century depends on how quickly and effectively we can reduce atmospheric pollution. But, among climate scientists, there is broad consensus that even if we were able to reduce emissions to zero by tomorrow, some level of sea level rise is already inevitable.
According to the U.S. Interagency Task Force on Sea Level Change, sea levels are expected to rise about 12 inches by the year 2050 under any emissions scenario. By 2100, sea levels are forecast to rise anywhere between 2.3 and 4 feet. Such an outcome could prove devastating to many low-elevation cities along the U.S. coast.
Using data from Climate Central’s Coastal Risk Finder tool, Climate Crisis 247 identified major, coastal U.S. cities most vulnerable to flooding in the coming years. Sea level rise and flood projections are based on a status quo emissions scenario and an unchecked emissions scenario. Supplemental data on each city’s elevation, relative to sea level, came from topographic map data. Cities are ranked by population, as reported in the U.S. Census Bureau’s five-year average 2024 American Community Survey.
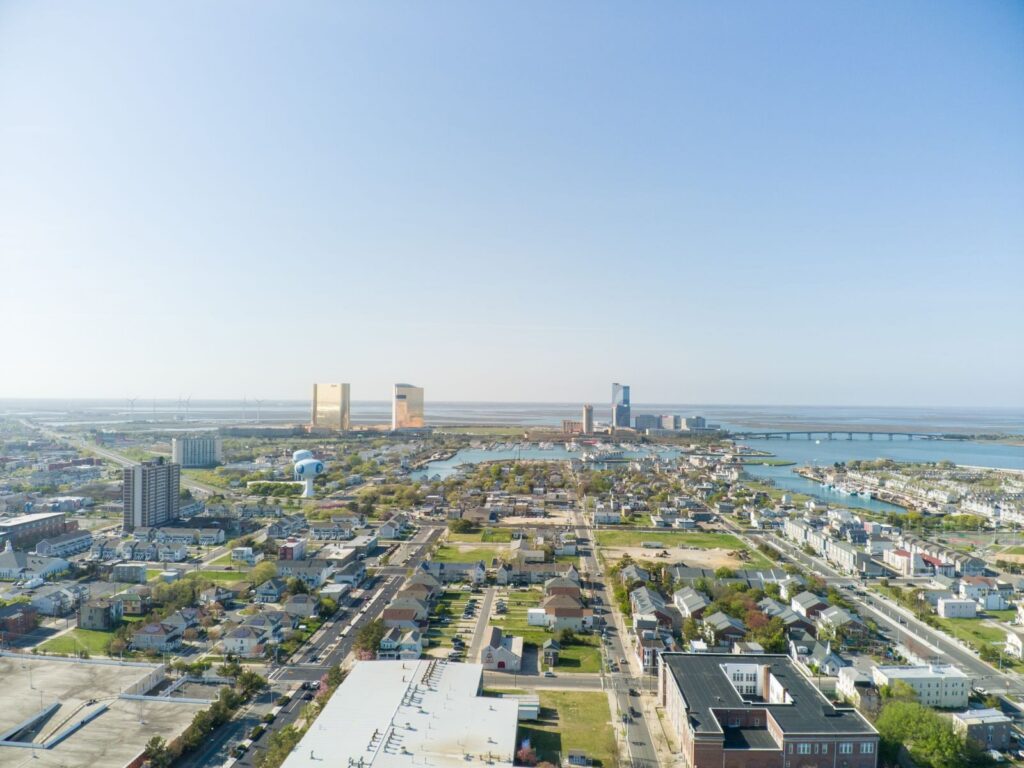
9. Atlantic City, New Jersey
- Projected sea level rise at current emissions commitments: 1.3 ft. by 2050; 2.9 ft. by 2100
- Projected sea level rise with unchecked emissions: 1.4 ft. by 2050; 3.7 ft. by 2100
- Projected annual flooding at current emissions commitments: 2.7 ft. by 2030; 3.3 ft. by 2050
- Projected annual flooding with unchecked emissions: 2.7 ft. by 2030; 3.4 ft. by 2050
- City elevation: 3 ft. average elevation; -16 ft. minimum elevation
- Population: 38,632
8. Charleston, South Carolina
- Projected sea level rise at current emissions commitments: 1.1 ft. by 2050; 2.5 ft. by 2100
- Projected sea level rise with unchecked emissions: 1.2 ft. by 2050; 3.2 ft. by 2100
- Projected annual flooding at current emissions commitments: 2.3 ft. by 2030; 2.9 ft. by 2050
- Projected annual flooding with unchecked emissions: 2.4 ft. by 2030; 3.0 ft. by 2050
- City elevation: 13 ft. average elevation; -16 ft. minimum elevation
- Population: 154,338
7. Fort Lauderdale, Florida
- Projected sea level rise at current emissions commitments: 0.9 ft. by 2050; 2.3 ft. by 2100
- Projected sea level rise with unchecked emissions: 1.0 ft. by 2050; 3.0 ft. by 2100
- Projected annual flooding at current emissions commitments: 1.5 ft. by 2030; 2.0 ft. by 2050
- Projected annual flooding with unchecked emissions: 1.5 ft. by 2030; 2.1 ft. by 2050
- City elevation: 16 ft. average elevation; -13 ft. minimum elevation
- Population: 185,604
6. Norfolk, Virginia
- Projected sea level rise at current emissions commitments: 1.3 ft. by 2050; 3.0 ft. by 2100
- Projected sea level rise with unchecked emissions: 1.4 ft. by 2050; 3.7 ft. by 2100
- Projected annual flooding at current emissions commitments: 2.9 ft. by 2030; 3.6 ft. by 2050
- Projected annual flooding with unchecked emissions: 2.9 ft. by 2030; 3.7 ft. by 2050
- City elevation: 13 ft. average elevation; -23 ft. minimum elevation
- Population: 233,596
5. New Orleans, Louisiana
- Projected sea level rise at current emissions commitments: 1.6 ft. by 2050; 3.5 ft. by 2100
- Projected sea level rise with unchecked emissions: 1.6 ft. by 2050; 4.2 ft. by 2100
- Projected annual flooding at current emissions commitments: 2.2 ft. by 2030; 3.0 ft. by 2050
- Projected annual flooding with unchecked emissions: 2.2 ft. by 2030; 3.0 ft. by 2050
- City elevation: 3 ft. average elevation; -20 ft. minimum elevation
- Population: 371,853
4. Tampa, Florida
- Projected sea level rise at current emissions commitments: 1.0 ft. by 2050; 2.4 ft. by 2100
- Projected sea level rise with unchecked emissions: 1.1 ft. by 2050; 3.1 ft. by 2100
- Projected annual flooding at current emissions commitments: 2.0 ft. by 2030; 2.5 ft. by 2050
- Projected annual flooding with unchecked emissions: 2.0 ft. by 2030; 2.6 ft. by 2050
- City elevation: 36 ft. average elevation; -10 ft. minimum elevation
- Population: 401,618
3. Virginia Beach, Virginia
- Projected sea level rise at current emissions commitments: 1.3 ft. by 2050; 2.9 ft. by 2100
- Projected sea level rise with unchecked emissions: 1.3 ft. by 2050; 3.3 ft. by 2100
- Projected annual flooding at current emissions commitments: 2.6 ft. by 2030; 3.2 ft. by 2050
- Projected annual flooding with unchecked emissions: 2.6 ft. by 2030; 3.3 ft. by 2050
- City elevation: 7 ft. average elevation; -33 ft. minimum elevation
- Population: 456,349
2. Miami, Florida
- Projected sea level rise at current emissions commitments: 1.0 ft. by 2050; 2.3 ft. by 2100
- Projected sea level rise with unchecked emissions: 1.0 ft. by 2050; 3.0 ft. by 2100
- Projected annual flooding at current emissions commitments: 1.4 ft. by 2030; 1.9 ft. by 2050
- Projected annual flooding with unchecked emissions: 1.4 ft. by 2030; 2.0 ft. by 2050
- City elevation: 16 ft. average elevation; -7 ft. minimum elevation
- Population: 459,745
1. Houston, Texas
- Projected sea level rise at current emissions commitments: 1.4 ft. by 2050; 3.3 ft. by 2100
- Projected sea level rise with unchecked emissions: 1.5 ft. by 2050; 4.0 ft. by 2100
- Projected annual flooding at current emissions commitments: 2.5 ft. by 2030; 3.2 ft. by 2050
- Projected annual flooding with unchecked emissions: 2.5 ft. by 2030; 3.2 ft. by 2050
- City elevation: 82 ft. average elevation; -10 ft. minimum elevation
- Population: 2,328,253
More from ClimateCrisis 247
- The Worst Back-to-Back Hurricanes in US History
- The Deadliest Hurricanes To Hit the US in the last half century
- States Producing The Most Greenhouse Gas Emissions
- Sea Level Rise Will Cost These U.S. Cities Billions by 2040





