
While Consumers Pay More, Big Oil Makes Millions Every Hour
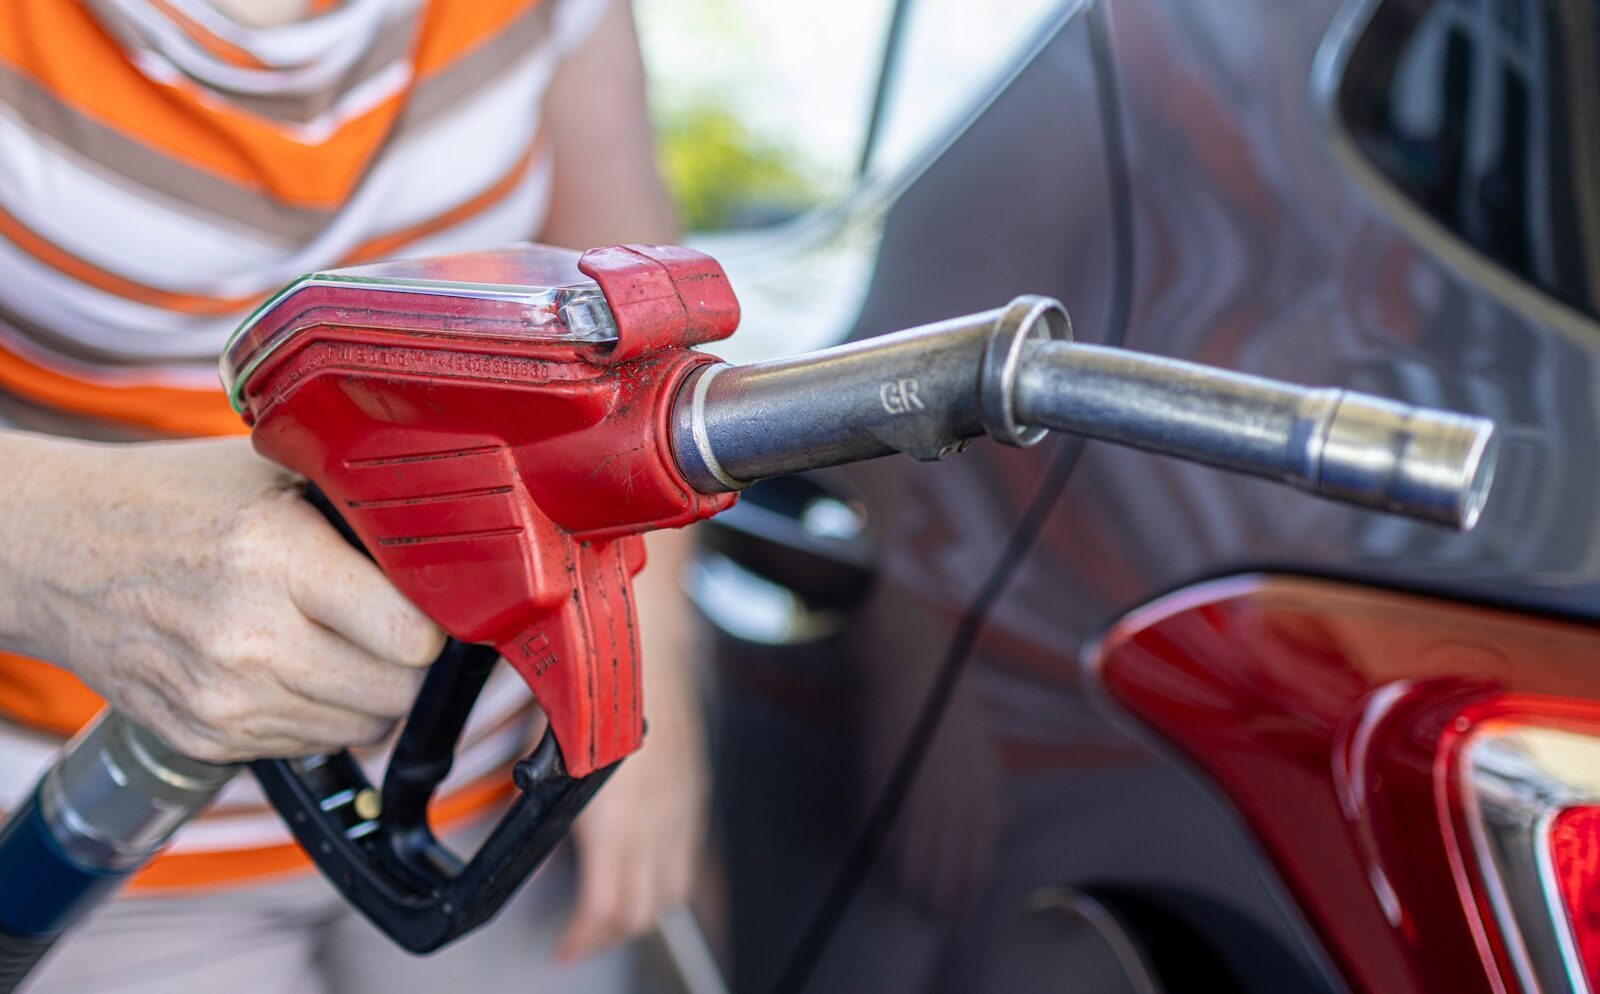
The war between Iran and U.S.-Israeli coalition forces, and the subsequent closure of the Strait of Hormuz, has resulted in a historic supply shock for global energy markets. The Strait, which connects the Persian Gulf to the Gulf of Oman, is a critical shipping lane for roughly 20% of the world’s oil – and when the Islamic Revolutionary Guard Corps effectively closed the passage to commercial vessels, oil prices spiked around the world.
In late February of this year, on the eve of war, the average price of a gallon of gas was $2.98 in the United States. In the months since, gas prices peaked at around $4.50 and remain above $4.00 per gallon today. Rising gas prices also drove up the cost of living across the board, as the consumer price index rose to 4.2% in May, its highest level in two years.
But while surging gas prices have been devastating for cash-strapped consumers in the United States, they have been a boon for American oil companies. Even as oil prices spiked globally, the cost of producing oil remained relatively flat, leading to windfall corporate profits and soaring stock prices. According to a report published by The Guardian, the world’s 100 largest oil companies made an additional $30 million in profits every hour during the first month of the war. Additionally, virtually all of the largest, publicly traded petroleum companies in the U.S. saw their share price hit new record highs since the war began.
Using stock valuation data, Climate Crisis 247 identified the largest American oil companies that reported record-high stock prices since Feb. 28, 2026, the beginning of the war in Iran. Only companies listed on the Fortune 1,000 were considered. Supplemental data on corporate revenues and profits are from Yahoo Finance and historical gas price data is from the Energy Information Administration. Additional data on corporate emissions from business operations, including petroleum processing and refining, is from the Environmental Protection Agency, and is current as of 2023, the most recent year of available data.
9. Par Pacific (PARR)
- Highest stock price in company history: $87.03 on July 31, 2026
- Average price of a gallon of gas on July 31, 2026: $4.10 (37.6% more than pre-war average)
- 12 month trailing corporate revenue: $8.6 billion ($1.8 billion in gross profit)
- Company’s annual reported greenhouse gas emissions: 1.6 million metric tons
- Corporate headquarters: Houston, Texas
8. Delek US (DK)
- Highest stock price in company history: $68.93 on July 22, 2026
- Average price of a gallon of gas on July 22, 2026: $4.00 (34.2% more than pre-war average)
- 12 month trailing corporate revenue: $10.7 billion ($522.7 million in gross profit)
- Company’s annual reported greenhouse gas emissions: 2.6 million metric tons
- Corporate headquarters: Brentwood, Tennessee
7. HF Sinclair (DINO)
- Highest stock price in company history: $94.22 on July 28, 2026
- Average price of a gallon of gas on July 28, 2026: $4.10 (37.6% more than pre-war average)
- 12 month trailing corporate revenue: $31.2 billion ($3.1 billion in gross profit)
- Company’s annual reported greenhouse gas emissions: 4.6 million metric tons
- Corporate headquarters: Dallas, Texas
6. PBF Energy (PBF)
- Highest stock price in company history: $74.74 on July 30, 2026
- Average price of a gallon of gas on July 30, 2026: $4.10 (37.6% more than pre-war average)
- 12 month trailing corporate revenue: $34.4 billion ($1.3 billion in gross profit)
- Company’s annual reported greenhouse gas emissions: 10.8 million metric tons
- Corporate headquarters: Parsippany, New Jersey
5. Phillips 66 (PSX)
- Highest stock price in company history: $216.08 on July 22, 2026
- Average price of a gallon of gas on July 22, 2026: $4.00 (34.2% more than pre-war average)
- 12 month trailing corporate revenue: $134.5 billion ($13.8 billion in gross profit)
- Company’s annual reported greenhouse gas emissions: 29.3 million metric tons
- Corporate headquarters: Houston, Texas
4. Marathon Petroleum (MPC)
- Highest stock price in company history: $326.92 on July 22, 2026
- Average price of a gallon of gas on July 22, 2026: $4.00 (34.2% more than pre-war average)
- 12 month trailing corporate revenue: $135.4 billion ($10.8 billion in gross profit)
- Company’s annual reported greenhouse gas emissions: 28.5 million metric tons
- Corporate headquarters: Findlay, Ohio
3. Valero Energy (VLO)
- Highest stock price in company history: $320.24 on July 22, 2026
- Average price of a gallon of gas on July 22, 2026: $4.00 (34.2% more than pre-war average)
- 12 month trailing corporate revenue: $139.4 billion ($11.2 billion in gross profit)
- Company’s annual reported greenhouse gas emissions: 23.5 million metric tons
- Corporate headquarters: San Antonio, Texas
2. Chevron (CVX)
- Highest stock price in company history: $214.71 on March 30, 2026
- Average price of a gallon of gas on March 30, 2026: $3.99 (33.9% more than pre-war average)
- 12 month trailing corporate revenue: $187.7 billion ($54.0 billion in gross profit)
- Company’s annual reported greenhouse gas emissions: 15.9 million metric tons
- Corporate headquarters: Houston, Texas
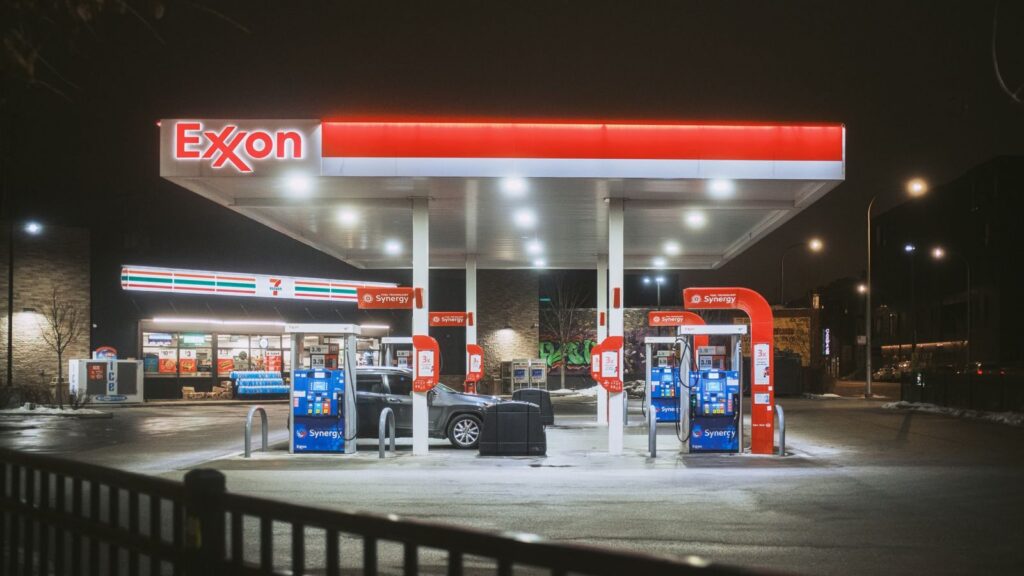
1. Exxon Mobil (XOM)
- Highest stock price in company history: $176.41 on March 30, 2026
- Average price of a gallon of gas on March 30, 2026: $3.99 (33.9% more than pre-war average)
- 12 month trailing corporate revenue: $326.0 billion ($66.7 billion in gross profit)
- Company’s annual reported greenhouse gas emissions: 31.2 million metric tons
- Corporate headquarters: Spring, Texas
More from ClimateCrisis 247
- Cities Where Americans Have the Highest Water Bills
- New Documents Add to Evidence in Climate Deception Case Against ExxonMobil
- The 10 Most Sustainable Countries In The World
- States Where Tax Payers Will Pay The Most for Rising Sea Levels





