In These Counties, the Wind Speed Is Increasing Far More Than Other Places
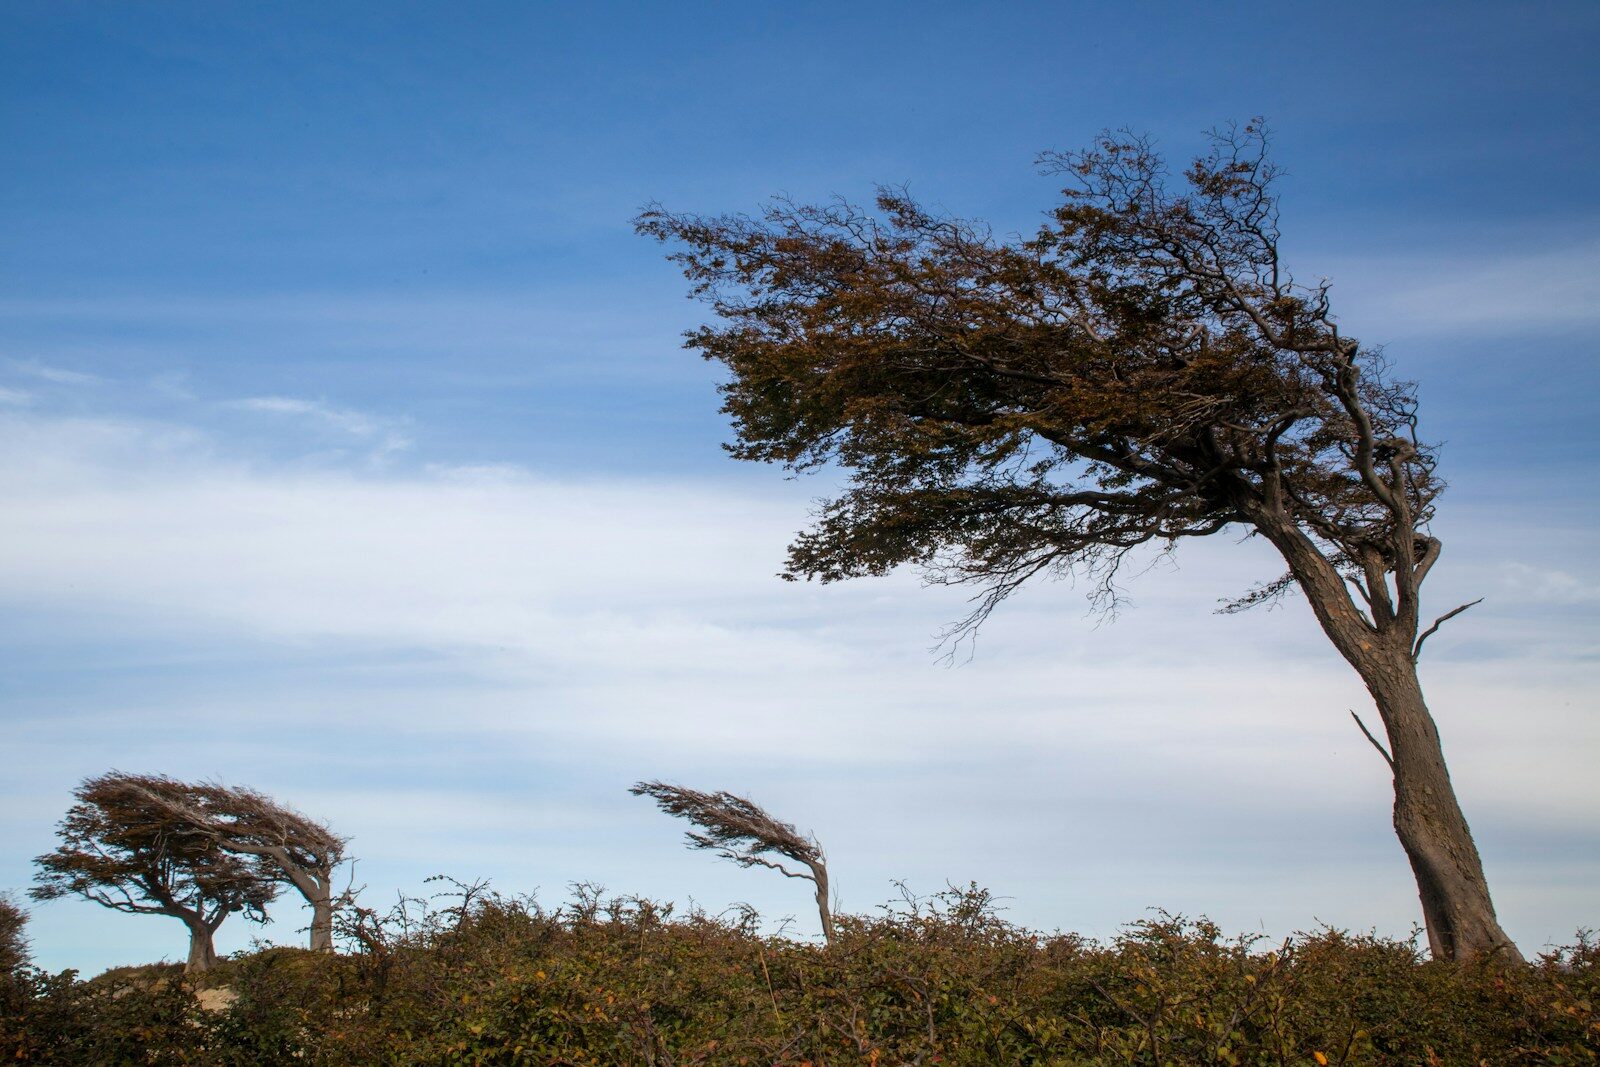
After decades of decline, average wind speeds are rising again. While scientists once blamed global stilling on land-based changes like taller buildings and increased surface drag, researchers have found that long-standing ocean-atmosphere oscillations – invisible tides of pressure and temperature swinging over decades – may be a larger causal factor in changing wind speeds.
New data shows that changes in wind speeds around the world are far from uniform, and have a complex relationship with rising temperatures. A changing climate may mean faster winds in some areas and slower winds in others. Even in the United States, there is high variability, with wind speeds rising in portions of the South and Ohio Valley and falling in portions of the Northeast. A look at historic wind gust data reveals the counties where wind speeds are rising the fastest.
To determine the counties where wind speeds are rising the fastest, Climate Crisis 247 reviewed data on historical wind patterns from the Storm Prediction Center of the NOAA’s National Weather Service. Counties were ranked based on the average annual change in the speed of wind gust events from 1950 to 2023. Only counties with at least 10 reported wind gust events were considered.

10. Schleicher County, TX
- Avg. annual increase in wind gust speed, 1950-2023: +0.41 mph per year
- Avg. speed of wind gust events: 67.40 mph
- County seat: Eldorado
9. Warrick County, IN
- Avg. annual increase in wind gust speed, 1950-2023: +0.41 mph per year
- Avg. speed of wind gust events: 64.90 mph
- County seat: Boonville
8. Decatur County, TN
- Avg. annual increase in wind gust speed, 1950-2023: +0.45 mph per year
- Avg. speed of wind gust events: 62.63 mph
- County seat: Decaturville
7. Edwards County, TX
- Avg. annual increase in wind gust speed, 1950-2023: +0.47 mph per year
- Avg. speed of wind gust events: 62.46 mph
- County seat: Rocksprings
6. East Feliciana Parish, LA
- Avg. annual increase in wind gust speed, 1950-2023: +0.47 mph per year
- Avg. speed of wind gust events: 61.50 mph
- County seat: Clinton
5. Dallas County, AR
- Avg. annual increase in wind gust speed, 1950-2023: +0.48 mph per year
- Avg. speed of wind gust events: 61.19 mph
- County seat: Fordyce
4. Austin County, TX
- Avg. annual increase in wind gust speed, 1950-2023: +0.49 mph per year
- Avg. speed of wind gust events: 64.54 mph
- County seat: Bellville
3. Menominee County, WI
- Avg. annual increase in wind gust speed, 1950-2023: +0.52 mph per year
- Avg. speed of wind gust events: 62.19 mph
- County seat: Keshena
2. Madison County, AR
- Avg. annual increase in wind gust speed, 1950-2023: +0.52 mph per year
- Avg. speed of wind gust events: 67.22 mph
- County seat: Huntsville
1. St. Helena Parish, LA
- Avg. annual increase in wind gust speed, 1950-2023: +0.93 mph per year
- Avg. speed of wind gust events: 62.78 mph
- County seat: Greensburg
Sponsor
Find a Vetted Financial Advisor
- Finding a fiduciary financial advisor doesn't have to be hard. SmartAsset's free tool matches you with up to 3 financial advisors that serve your area in 5 minutes.
- Each advisor has been vetted by SmartAsset and is held to a fiduciary standard to act in your best interests. Get on the path toward achieving your financial goals!
More from ClimateCrisis 247
- Major Sports Events Interrupted By Dangerous Weather
- These Countries Are Fueling the Global Coal Addiction
- The states with The Most Carbon Pollution In The Nation
- 100+ Degree Temperatures Forecasted for Millions Across these Southwest Cities


